Genetic and developmental basis for fin shape variation in African cichlid fishes
Abstract
Adaptive radiations are often characterized by the rapid evolution of traits associated with divergent feeding modes. For example, the evolutionary history of African cichlids is marked by repeated and coordinated shifts in skull, trophic, fin and body shape. Here, we seek to explore the molecular basis for fin shape variation in Lake Malawi cichlids. We first described variation within an F2 mapping population derived by crossing two cichlid species with divergent morphologies including fin shape. We then used this population to genetically map loci that influence variation in this trait. We found that the genotype–phenotype map for fin shape is largely distinct from other morphological characters including body and craniofacial shape. These data suggest that key aspects of fin, body and jaw shape are genetically modular and that the coordinated evolution of these traits in cichlids is more likely due to common selective pressures than to pleiotropy or linkage. We next combined genetic mapping data with population-level genome scans to identify wnt7aa and col1a1 as candidate genes underlying variation in the number of pectoral fin ray elements. Gene expression patterns across species with different fin morphologies and small molecule manipulation of the Wnt pathway during fin development further support the hypothesis that variation at these loci underlies divergence in fin shape between cichlid species. In all, our data provide additional insights into the genetic and molecular mechanisms associated with morphological divergence in this important adaptive radiation.
Introduction
African cichlids exhibit unparalleled morphological diversity, and their evolutionary history is characterized by rapid and repeated diversification along a benthopelagic axis. This axis is comprised of ecological, behavioural and morphological variables and is generally conserved across a wide range of fish taxa, including charr, stickleback and sunfish (reviewed in Cooper et al. 2010). Benthic species generally forage along the substrate with biting, scraping, plucking or crushing modes of feeding. Pelagic species, on the other hand, hunt for small and/or elusive prey, often within the water column, using suction or ram feeding. These behavioural differences correlate with consistent and predictable changes to the head/trophic structures, fins and body shape.
Benthic fish tend to have deep, sharply sloping heads with short jaws while pelagic fish often exhibit narrow, gently sloping heads with extendable jaws (arctic charr: Parsons et al. 2010, 2011; Küttner et al. 2013; stickleback: Schluter & McPhail 1992; Gow et al. 2008; Willacker et al. 2010; cichlids: Albertson & Kocher 2006; Cooper et al. 2010; coral reef fishes: Motta 1982; Wainwright et al. 2004; sunfishes: Wainwright & Shaw 1999; icefish: Klingenberg 1996). These differences have measureable effects on aspects of feeding efficiency and therefore impact performance (e.g. Liem 1974, 1978; Bouton et al. 1997, 1998; and Wainwright & Shaw 1999). Although the benthopelagic literature focuses primarily on various aspects of craniofacial variation, body and fin shape exhibit predictable variation along this axis as well.
Benthic fish typically develop deeper bodies and wider pectoral and pelvic fins than pelagic fish (e.g. Klingenberg 1996; Gow et al. 2008; Parsons et al. 2010; and Franchini et al. 2014). Hulsey et al. (2013) found a significant association between cichlid pectoral fin muscle mass and phylogenetic shifts to a benthic habitat, suggesting a potential adaptive significance of pectoral fin musculature. Body and fin shape, like craniofacial diversity, are thought to influence performance by mediating swimming ability and maneuverability (e.g. Pettersson & Brönmark 1999; Blake et al. 2005; Rouleau et al. 2010). For example, variation in pectoral fin shape has been linked to differences in propulsion and swimming speed among fishes (Wainwright et al. 2002; Walker & Westneat 2002). It was noted further that slower swimming fish tended to remain closer to the substrate, while faster swimmers usually dominated the water column, mimicking benthopelagic habitat variation (Wainwright et al. 2002). Importantly, while divergence along this ecological axis is typically studied in extreme forms, microhabitat divergence in foraging niche involves similar shifts in ecomorphology (Albertson 2008; Cooper et al. 2010; Hulsey et al. 2013).
Here, we examined the genetic and developmental basis for variation in Lake Malawi cichlid fin shape. Our ultimate goal is to gain insights into the proximate molecular mechanisms that precipitate ecologically relevant morphological variation in this trait. An additional goal is to compare the genetic architecture of fin shape to that of other foraging related traits, specifically body and head morphology. Locomotion and feeding are inextricably linked with respect to performance in fishes, which has led to calls to be more integrative in the study of organismal biodiversity (Kane & Higham 2016). Indeed, recalling Dobzhansky (1973), these authors suggest, ‘nothing in fish feeding makes sense except in the light of integration’ (Kane & Higham 2016). While we know that shifts in habitat lead to coordinated, predictable changes to the trophic structures, fins and body shape in cichlids, less is known about the genetic and developmental mechanisms that underlie these coordinated changes. We will determine whether the consistency of coordinated changes in response to dietary shifts can be partially explained by shared genetic architectures. If these three suites of traits share a common genetic architecture, it would provide an explanation for the rapid and iterative divergence along this axis in teleost lineages. Alternatively, if these traits show nonoverlapping genetic architectures, then a common selective axis likely underlies the common phenotypic responses. To accomplish these two goals, we first probe the genetic architecture of three functionally related suites of traits using a quantitative trait loci (QTL) mapping approach, assessing the extent to which they are integrated at the genetic level. We next utilize comparative genomic data to fine-map two discrete QTL for pectoral fin variation. This analysis implicated the Wnt signalling pathway, which we verified using comparative and experimental embryology. In all, these data combine to provide insights into how discrete anatomical units may evolve to promote ecomorphological diversity.
Materials and methods
In order to investigate the genetic architecture of functionally integrated traits, we utilized a genetic cross between two benthic cichlid species, Labeotropheus fuelleborni (LF) and Tropheops sp. ‘red cheek’ (TRC). LF is an obligate algal scraper with an extreme benthic morphology (Cooper et al. 2010). TRC uses a bite-and-twist mode of feeding to crop filamentous algae off the rocky substrate. Compared to LF, TRC will also forage with a sucking/shifting mode, is a member of a more ecologically diverse species complex and possesses a more pelagic phenotype (e.g. longer head, more shallow body; Albertson 2008; Cooper et al. 2010; Parsons et al. 2014). We also used a third species, Maylandia zebra (MZ), to complement our cross. MZ is a true generalist feeder that forages by combing loose algae from rocky substrata as well as by suctioning plankton from the water column. It exhibits a relatively long head and shallow body like TRC.
Fish husbandry
All fish were laboratory-reared in 10-gallon glass aquaria for 1–2 months and then moved to 40-gallon glass tanks. Fish were fed store-bought flake food containing a mixture of spirulina algae and egg yolk. Fish room temperature was maintained at a range between 27 and 29 °C. Fish were reared to adult stages, between 1 and 2 years and 6–9 cm (mean = 7 cm).
Morphological analyses
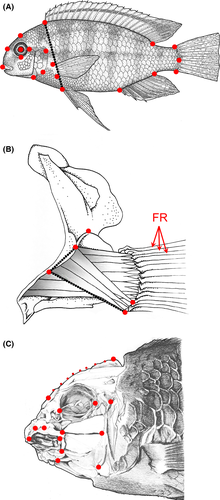
All fish were humanely sacrificed by prolonged exposure to MS-222 in ice water following the University of Massachusetts IACUC protocol 2013-0101. Geometric morphometrics were used in tandem with traditional morphometrics to quantify variation between species and across F2 individuals of the mapping population. Figure 1 provides the landmarks used to describe each of the three suites of traits. All landmarking was performed in TPSDig (Rohlf 2006). Some landmarks in the body shape analysis overlapped with those from the initial craniofacial analysis; however, we attempted to minimize overlap and emphasize new aspects of shape variation, such as eye placement on the head (Fig. 1A, C). Fins were dissected to reveal the underlying musculature; landmarks were placed to assess the origin and insertion of the most superficial muscle, the abductor superficialis (ABS), on the pectoral girdle (Fig. 1B). In addition, we counted the number of bony fin rays (FR) that underlie the pectoral fin pad (first three FRs are highlighted in Fig. 1B). We also extracted two linear measures, the width of the ABS origin and the length of the ABS from origin to insertion, from our morphometric data on fin musculature. Finally, we measured body depth as defined by the distance from the anterior dorsal fin insertion to the pelvic fin insertion. We measured these traits in the 268 F2 hybrid individuals that were used in the construction of the genetic map, as well as in wild-caught or F1 laboratory-reared LF, TRC and MZ individuals. We extracted hybrid PC scores along the major shape axes from the geometric morphometric analyses. All PC scores were derived from size-standardized landmarks using independently measured standard length values. Body depth, ABS origin width and ABS length were also size-standardized using standard length. All morphometric analyses were performed using the geomorph package in r (Adams & Otarola-Castillo 2013; R Core Team 2013).
Genotypic analyses
A single LF female was crossed to a single TRC male, creating a single F1 family, which was subsequently incrossed to produce a F2 hybrid mapping population. SNPs were identified across 268 F2 as well as 20 wild-caught LF from Makanjila Point and 20 wild-caught TRC from Chizumulu Island using restriction site-associated DNA sequencing (RAD-seq, Miller et al. 2007) following Chutimanitsakun et al. (2011). Bowtie (Langmead et al. 2009) was used to align reads to the reference cichlid sequence (metriaclima zebra version 0), and samtools was used for SNP calling. In total, 42 724 SNPs were identified with a median sequencing depth of 33× across individuals. These data were then filtered by FST values to include loci showing high differentiation between natural populations of LF and TRC (i.e. FST > 0.57, an empirical threshold for divergence between cichlid genera; Mims et al. 2010), as well as deviations from Mendelian segregation in the F2. This stringently filtered marker data set resulted in 1395 SNPs for linkage map construction. Linkage map construction followed methods contained within the R/qtl package (Broman et al. 2003; Broman & Sen 2009) and is described in detail in Albertson et al. (2014). The resulting map contained 946 loci across 24 linkage groups (between 13 and 76 loci per group), spanning 1453.3 cM. Linkage groups were numbered according to Lee et al. (2005).
Separate QTL analyses were run in R/qtl using size-standardized scores from each major shape (i.e. PC) axis, size-standardized linear measures and discrete traits. Methods followed Broman & Sen (2009) and Arends et al. (2010). First, we identified putatively significant QTL via standard interval mapping. QTL models were then verified using maximum-likelihood-based backward elimination (i.e. to identify cofactors) and permutation tests (i.e. 500 permutations to estimate significance at the 95% and 90% genomewide levels). QTL intervals were defined using the bayesint function in R/qtl. Because our linkage map was anchored to the cichlid genome, we were able to examine search for putative candidate genes within intervals using the Cambridge cichlid genome browser (http://em-x1.gurdon.cam.ac.uk/). To narrow the list of candidates within each interval, we focused on genes associated with SNPs that exhibited divergent FST values between natural populations of LF and TRC [a complete list of these SNPs can be found in Albertson et al. (2014)]. A list of divergent SNPs within QTL for fin ray (FR) number and their associated genes is provided in Table S1 (Supporting information). We focused on wnt7aa and col1a1 for subsequent expression and manipulation analyses.
Gene expression study
We used whole-mount in situ hybridization (WISH) to determine the pattern of candidate gene expression across developmental stages in LF, MZ and TRC. We performed WISH in embryos at 5–11 days postfertilization (dpf) using a modified version of protocols in Sagerström et al. (1996) and Thisse et al. (1993). Primers (all listed 5′→3′) used to generate probes were as follows:
- Wnt7aaF: GCAAGGTGCTGGAGAAGAAC
- Wnt7aaR: AGTCGCATATGTCGGGCTACA
- Col1a1F: GCGGTGAGTACTGGATTGGT
- Col1a1R: CCTCGGCTCTGATCTCAATC
- Lef1F: AGGAAGCCGCAGCACGAG
- Lef1R: GCCGATTCCTGCATCTTCTCCC
Wnt modulation
Based on our genetic mapping and gene expression analyses, Wnt signalling and bone development/patterning were implicated in mediating species differences in fin ray number. To test this prediction, we compared FR development in our three study species and experimentally modulated Wnt expression in cichlids during a key window in FR development. LiCl is a known Wnt agonist (Clement-Lacroix et al. 2005), and IWR is a known antagonist (Chen et al. 2009). Both molecules have been successfully used to modulate this pathway during cichlid craniofacial (Parsons et al. 2014; Powder et al. 2015), tooth (Fraser et al. 2013), taste bud (Bloomquist et al. 2015) and brain development (Sylvester et al. 2010, 2013). Here, we randomly split several 8 dpf MZ, LF and TRC broods and treated them with either 250 mm LiCl (n = 27, 11, 6), 250 μm IWR (n = 13, 9, 6) or DMSO carrier control (n = 11, 4, 4). An untreated control (n = 33, 6, 7) group was also examined. Animals were treated with each compound for 72 h (i.e. 8–11 dpf) and then immediately cleared and stained for bone (alizarin red) and cartilage (alcian blue). We performed one-way Student's t-tests in r to determine whether the differences in average FR number in each treatment group were significantly different from the carrier control group. We additionally performed WISH using a probe for lef1 (a transcriptional target of Wnt signalling, Filali et al. 2002) on some of the treated MZ embryos to verify that small molecule manipulation resulted in perturbed Wnt activity (Fig. S4, Supporting information).
Results
Morphological analyses
The parental species showed significant variation in fin traits. For example, juvenile (i.e. 26 dpf) LF consistently exhibited fifteen FRs (n = 18), while TRC consistently exhibited fourteen (n = 20) FRs (Fig. 2A, B). The generalist foraging species, MZ, also showed fourteen FRs (n = 12; Fig. 2C). The abductor superficialis (ABS) muscles in LF tended to be wider along both the origin and insertion when compared to TRC (Fig. 2D insets). LF ABS also tended to be shorter between the origin and insertion than TRC, which showed relatively longer fin muscles. These two species segregated relatively well along PC1 and 2 of our fin musculature geometric morphometric analysis (Fig. 2D).
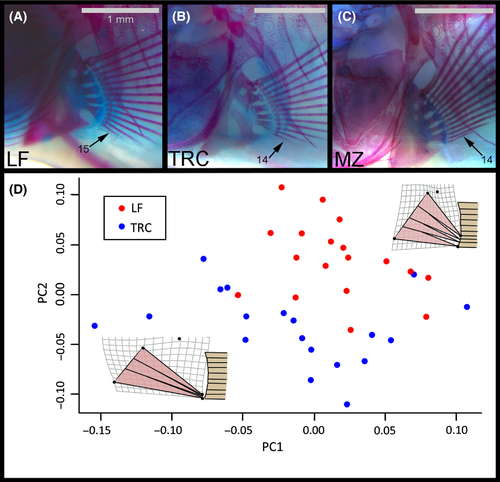
The LF × TRC F2 hybrids demonstrated considerable variation in fin, body and craniofacial shape. Craniofacial variation was quantified (Parsons et al. 2011) and mapped (Parsons et al. 2015) in this population previously. For fins, the number of FRs varied from fourteen (32% of the F2) to fifteen (68%), which is consistent with dominance of high FR number alleles. In addition to two linear measures of pectoral fin shape (length and width of the ABS musculature), we performed a separate PCA on hybrids to describe geometric variation in fin shape. PC1 (31.7% variance explained) largely described variation in the shape of the ABS muscles (Fig. S1, Supporting information). Individuals with positive PC1 scores possessed on average ABS musculature that was rectangular shaped, with a relatively shallow origin and deep insertion. Animals with negative PC1 scores possessed ABS muscles that were more triangular shaped, with deep origins and shallow insertions. Shape differences along PC2 (22.4%) involved mainly the height to the hypercoracoid bone relative to the ABS musculature (Fig. S1, Supporting information). Positive PC2 scores were associated with a shallow hypercoracoid bone, whereas negative scores were associated with a deeper bone. PC3 (16.9%) described variation in the overall length of the abductor muscles of the pectoral fin, with positive scores associated with longer muscles and relatively narrow insertion of the ABS compared to individuals with negative scores (Fig. S1, Supporting information). In terms of overall body shape variation, PC1 (19.7% variance explained) described variation in the position of the mouth on the head (high vs low), length of the preorbital region of the skull and length of the caudal peduncle region of the body (Fig. S2, Supporting information). PC2 (17.5%) captured variation in craniofacial profile, with positive scores associated with a steep craniofacial profile and ventrally directed jaws, and negative scores associated with shallow profiles and horizontally directed jaws (Fig. S2, Supporting information). In addition, PC2 captured aspects of fin morphology, with positive scores associated with a wider pectoral fin base relative to fish with negative PC2 scores. PC3 (12.4%) mainly involved variation in body depth and the position of the anterior insertion of the dorsal fin (Fig. S2, Supporting information). Fish with positive PC3 scores had more shallow bodies and dorsal fins that inserted more posteriorly compared to fish with negative PC3 scores.
QTL analyses
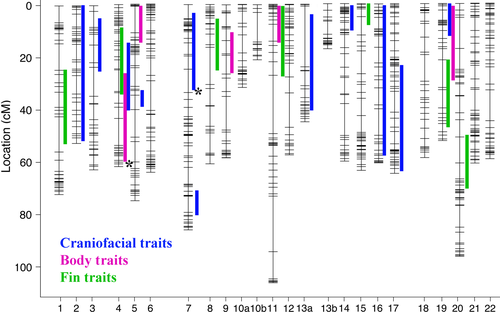
To assess the degree of trait integration at the genetic level, we next performed and compared a series of QTL analyses. Genetic mapping of craniofacial variation in these hybrids was performed previously and reported in Parsons et al. (2015). In addition, we identified 13 loci that were significantly associated with fin and body shape variation (Table 1). LOD scores for these loci ranged from 2.9 to 5.0 and explained anywhere from 5.2% to 8.7% of the variance in the phenotypic data (Table 1). Our highest LOD scores and percentages of variance explained were for discrete traits – that is body depth and the number of pectoral FRs (Table 1). In order to visualize the extent of overlap between QTL that underlie different suites of traits, we placed all significant (at the 95% genomewide level) and suggestive (at the 90% genomewide level) QTL on a single schematic of the cichlid linkage map (Fig. 3). We found minimal overlap of QTL intervals, suggesting these traits have largely distinct genetic architectures. Of a total of 25 QTL for all traits, we found only four instances of overlapping QTL intervals between different suites of traits. One on LG4 involved overlap between fin, body and craniofacial QTL. Another involved a body and fin shape QTL on LG11. The other two both involved the body shape QTL on LG19, which overlapped with a craniofacial QTL on one end of the interval and a fin QTL on the opposite end.
| Trait | LG | cM | QTL interval | LOD | PVE (%) | Lf/Lf | Allele effects | |
|---|---|---|---|---|---|---|---|---|
| Lf/Trc | Trc/Trc | |||||||
| Fin – PC2 | 4 | 30 | 9.6–33.6 | 3.06a | 5.4 | 0.009025 | −0.00207614 | −0.00622141 |
| Fin – PC3 | 15 | 5.0 | 0.0–16.4 | 3.22a | 5.7 | −0.00045 | −0.00391789 | 0.00363085 |
| FR | 8 | 15.0 | 11.3–30.6 | 5.02b | 8.7 | 12.86156 | 12.72375 | 12.17147 |
| 20 | 60.0 | 44.4–71.4 | 4.63b | 8.1 | 12.77332 | 12.69755 | 12.44446 | |
| ABS width | 19 | 30.0 | 21.5–45.9 | 3.61b | 6.0 | −5.26036 | 2.939304 | −5.263519 |
| ABS length | 11 | 5.0 | 0.0–26.1 | 4.47b | 7.4 | 2.975798 | −7.998882 | 2.249 |
| 1 | 30.0 | 24.6–55.9 | 4.34b | 7.2 | 0.097847 | −1.45368405 | −9.00882786 | |
| Body – PC1 | 4 | 30.0 | 24.5–53.9 | 3.14a | 5.6 | 0.004059 | −0.00101272 | 0.00406989 |
| Body – PC3 | 5 | 0.0 | 0.0–15.5 | 3.54b | 6.2 | −0.00128 | −0.00252299 | 0.00288055 |
| Body – PC4 | 11 | 0.0 | 0.0–15.7 | 2.94a | 5.2 | 0.000377 | 0.00091447 | −0.0016883 |
| Body depth | 9 | 20.0 | 9.2–26.5 | 4.46b | 7.4 | 1.135957 | −0.0969783 | −0.6623961 |
| 19 | 5.0 | 0.0–32.1 | 3.34b | 5.6 | 0.01392 | −0.78827912 | 1.71184921 | |
| 4 | 45.0 | 37.8–62.2 | 2.97a | 5.0 | 0.704943 | −0.3756745 | 0.1749134 | |
- PCs, shape axes for fin and body traits; FR, number of fin ray elements; ABS, abductor superficialis muscle; LG, linkage groups; cM, centimorgans.
- a Genomewide significance at P < 0.1.
- b Genomewide significance at P < 0.05.
Fine-mapping fin QTL with population genomic data
We wanted to further investigate the QTL associated with variation in the number of FRs, as the genetic basis for fin morphology, especially variation in FR number, is poorly understood. Moreover, these two loci had relatively high LOD scores and explained a relatively high amount of variation in this trait class. The allele effects at each of the two loci on LGs 8 and 20 were in the expected direction, with LF alleles increasing FR number and TRC alleles decreasing FR number (Fig. S3, Supporting information). This trend is consistent with FR number being under divergent selection (Albertson et al. 2003). The LF allele also exhibited dominance to the TRC allele, which is consistent with the observation of proportionally more (i.e. >2/3) F2 exhibiting 15 FRs. Since our linkage map was anchored to the Lake Malawi cichlid genome, we were able to examine genetic variation within these QTL intervals to find potential candidate genes (Fig. 4, Table S1, Supporting information). To do so, we took advantage of an FST data set derived from genome scans in LF and TRC from natural populations (Albertson et al. 2014). A list of all genes associated with divergent SNPs in these intervals is provided in Table S1. From this list, we identified wnt7aa and col1a1 as robust candidates (Fig. 4). Wnt7aa is between 4.512 and 4.522 Mb on scaffold 12, which maps to the QTL on LG 20, and a SNP at 4.470 Mb is fixed for alternate alleles between LF and TRC (i.e. FST = 1.0). Col1a1 is at 2.556–2.564 Mb on scaffold 47, which maps to the QTL on LG 8, and a SNP at 2.659 Mb is divergent between LF and TRC (i.e. FST = .7). Wnt signalling plays critical roles throughout limb development (Church & Francis-West 2002), as well as during early bone differentiation (reviewed in Long 2011). Col1a1 codes for a type 1 collagen protein and is a well-studied bone cell differentiation marker. This gene is expressed in developing zebrafish fin folds (Fisher et al. 2003) and is upregulated upon fin amputation in zebrafish (Durán et al. 2011). We therefore considered these genes to be strong candidates for modulating variation in cichlid FR number.

Gene expression study
In order to determine whether these genes are expressed during cichlid fin development, we performed whole-mount in situ hybridization (WISH) on cichlid embryos at different stages (Fig. 5). We found no wnt7aa expression in the fins prior to 6 dpf or after 10 dpf (not shown), whereas discrete punctate wnt7aa expression was observed in the developing fins of LF at both 6 and 8 dpf. Specifically, nodes of expression were present close to the dorsal edge of the fin fold at 6 dpf (Fig. 5D) and expanded ventrally by 8 dpf (Fig. 5E). Nodes of expression were strongest along the distal edge of the fin fold, but extended proximally towards the girdle, and foreshadowed the developing FRs. This dorsal to ventral (D to V) wave of wnt7aa expression during fin development is consistent with the D to V pattern of FR development in the pectoral fin (Fig. 5A–C). Notably, while strong wnt7aa expression was observed in the central nervous system of MZ and TRC (not shown), this gene was not expressed in the fin folds of MZ or TRC at any stage of development (Fig. 5H, I, L, M). This observation suggests that wnt7aa expression was co-opted during FR specification in LF. While wnt7aa was not expressed in the fins of MZ or TRC, the Wnt target lef1 was (e.g. Fig. S4, Supporting information), and its expression followed a similar punctate pattern reminiscent of wnt7aa. These data suggest that the Wnt pathway is active during fin development in MZ and TRC, even if wnt7aa is not.
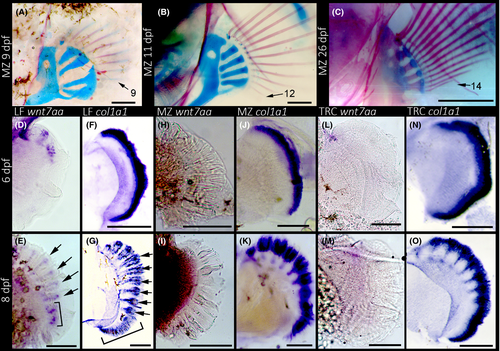
We observed a continuous band of expression of col1a1 along the proximal edge of the pectoral fin in all three species at 6 dpf (Fig. 5F, J, N), followed by more punctate expression at 8 dpf (Fig. 5G, K, O). Col1a1 expression followed a similar D to V pattern as wnt7aa, where by 8 dpf, nodes of expression towards the dorsal edge of the fin fold were clearly defined and foreshadowed FR development, whereas expression along the ventral edge was continuous. Notably, the D to V pattern in col1a1 appears slightly delayed compared to wnt7aa expression, as discrete nodes of expression were observed earlier for wnt7aa compared to col1a1 at the same D–V position along the developing fin fold (e.g. Fig. 5D vs. F). This is consistent with Wnts playing an early role in osteoblast differentiation (Long 2011). Finally, at 8 dpf, LF showed a greater number of discrete nodes of col1a1 expression than MZ or TRC (Fig. 5G vs. K and O), which suggests that FR development in this species is accelerated.
Wnt modulation
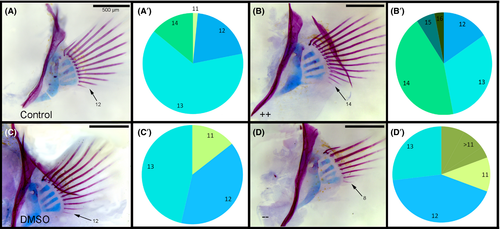
The localization of wnt7aa and lef1 in the developing fins suggests that the Wnt signalling pathway is involved in regulating FR development, and variation in this pathway underlies variation in FR number. To test this hypothesis, we mis-expressed the Wnt pathway during fin development (i.e. 8–11 dpf) using small molecules. First, we upregulated Wnt signalling in MZ with LiCl and found that treated animals developed significantly more pectoral FRs than their control siblings (Figure 6A and B, P-value < 0.01, n = 27 LiCl fish, n = 24 control fish). The number of FRs in the LiCl group ranged from 12 to 16, while the number of FRs for the control siblings ranged from 11 to 14. Next, we blocked Wnt signalling with the small molecule antagonist, IWR, and found that treated animals exhibited fewer FRs than their control siblings (Fig. 6A and C, P-value < 0.001, n = 13 IWR fish, n = 9 control fish). The number of FRs in the IWR treatment group ranged from 8 to 13. We also mis-expressed Wnt signalling in both TRC and LF embryos and found similar patterns as in MZ (Fig. S5, Supporting information). We verified that Wnt signalling was being modulated in MZ pectoral fins by performing WISH using a lef1 probe on a subset of treated and control larvae (Fig. S4, Supporting information). IWR treatment resulted in a clear reduction in lef1 expression, especially in the craniofacial region (Fig. S4C, Supporting information). Alternatively, LiCl treatment resulted in an expansion of lef1 expression, which is especially obvious in the caudal fin (Fig. S4A, Supporting information). In addition, altered lef1 expression in the pectoral fin upon Wnt manipulation foreshadows differences in FR numbers (Fig. S4A′–C′, Supporting information). Thus, our data suggest that Wnt signalling is necessary to maintain proper FR development in cichlids.
Discussion
Genetic insights and hypotheses
Key aspects of cichlid craniofacial, fin and body shape are broadly associated with foraging mode and often evolve in a coordinated fashion as species diverge in niche space (Young et al. 2009; Cooper et al. 2010; Hulsey et al. 2013). This consistent response could be explained by a common selective axis leading to the functional integration between locomotion and prey capture traits during fish feeding (Kane & Higham 2016). Alternatively, pleiotropy might play a role whereby a single locus mediates the development of functionally related characters (e.g. Hu & Albertson 2014). It is also possible that a combination of factors (e.g. selection and pleiotropy) underlies the coordinated evolution of these traits. As a step towards disentangling these alternate hypotheses, we examined and compared the genetic architectures of craniofacial, fin and body shape. We found minimal overlap of QTL intervals between the three suites of traits, which suggests that these ecologically relevant, functionally integrated suites of traits have distinct genetic architectures. While our interpretations are limited to the traits that we examined, our results suggest that pleiotropy (e.g. integration at the genetic level) does not play an especially strong role in the covariation of head, body and fin shape among cichlids.
These data also speak to the evolvability of this system. Populations with more genetically modular traits (e.g. nonoverlapping genetic architectures) should have the potential to evolve into a wider area of trait space. Having distinct genetic underpinnings would allow organisms to theoretically ‘mix and match’ different traits to respond to new selective pressures. This evolvability may be directly evidenced by the wide range of feeding strategies available to cichlids. We speculate that genetic modularity may facilitate such microniche partitioning, as slight shifts in distinct anatomical modules (e.g. increased numbers of FRs) could enable similarly subtle shifts in behavioural patterns and foraging habitat.
In spite of largely unique G-P maps for these suites of traits, four intervals of overlapping QTL were observed. While it cannot be ruled out that with the addition of more recombinant chromosomes, these apparently overlapping QTL would also become separate; such intervals might represent loci that have broad pleiotropic effects on multiple sets of traits. Such ‘hotspots’ might provide large targets for natural selection (Albertson et al. 2003), helping to kick-start divergence along the benthopelagic axis. Characterizing the molecular basis of putatively pleiotropic loci could be especially important as evolutionary biologists seek to understand the proximate factors that precipitate adaptive morphological divergences (e.g. Malinsky et al. 2015).
Developmental insights and hypotheses
Based on our developmental data, we suggest a mechanism through which Wnt activity and col1a1 expression influence variation in pectoral FRs (Fig. 7). Col1a1 is expressed in a thin, continuous band along the distal edge of the fin fold at 5 dpf in LF, MZ and TRC (not shown). By 6 dpf, this band has thickened and over the next several days becomes restricted to punctate nodes of expression in a D to V fashion. Nodes of col1a1 expression correspond to the number of fin rays present at that stage of development, which also develop in a D to V pattern (Fig. 2). This pattern of col1a1 expression in cichlid fins is similar to what has been observed in zebrafish (Fisher et al. 2003; Durán et al. 2011).
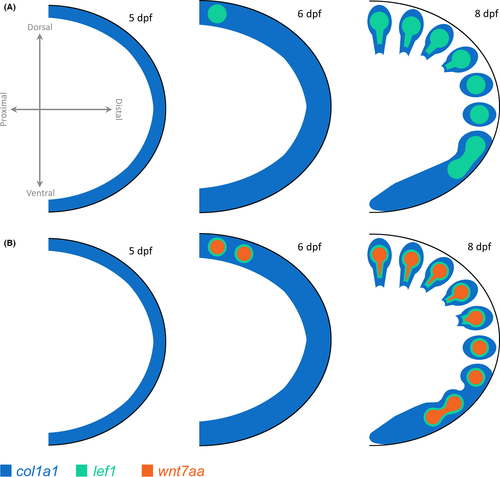
Wnt7aa is a notable candidate gene for variation in cichlid fin development, as its homolog is known to influence the formation of distal limb elements in both mouse and chick (Dealy et al. 1993; Parr & McMahon 1995; Yang & Niswander 1995). In LF, we find that wnt7aa is first expressed at 6 dpf as discrete nodes in the dorsal-most edge of the fin fold, which then appear to sweep down the fin fold from the dorsal to ventral edge of the fin. The punctate expression of wnt7aa precedes that of col1a1, which suggests that wnt7aa may act upstream of col1a1. This is consistent with roles for the Wnt signalling pathway in early osteoblast differentiation, before col1a1 expression [reviewed by Long (2011)]. These observations were corroborated by our functional experiments where knock-down of Wnt activity led to the loss of ventral FRs and expanded Wnt signalling led to expanded FR numbers. Collectively, our mapping and developmental data suggest that Wnt signalling is critical to the proper formation and patterning of these distal fin elements.
Notably, while wnt7aa was robustly expressed in the fin fold of LF, no such expression was observed in MZ or TRC. All three species exhibited strong wnt7aa expression in the central nervous system (not shown) and cleithrum (Fig. 5), which suggests that this gene product is active during MZ and TRC embryogenesis, but not in the developing fin rays. It is likely that Wnt signalling does act during fin development across cichlid species, since lef1, a core component of the canonical Wnt transcriptional machinery (and a target of Wnt signalling), is expressed as discrete nodes in the pectoral fins of all three species, and global manipulation of the Wnt pathway in these species led to significant differences in FR number. We therefore posit that the expanded number of FRs in LF is due to increased Wnt activity in the pectoral fins of this species, via the recruitment of wnt7aa as a novel ligand during pectoral fin development (e.g. Fig. 7). This hypothesis rises logically from our mapping and expression data; however, the precise molecular mechanism through which this putative recruitment has occurred remains unknown and will require further analysis.
Conclusions
Understanding the factors that promote and maintain species diversity is an active area of research. To this end, the genetic architectures of various adaptive traits have been examined in an array of organisms (e.g. Kim & Rieseberg 1999; Albertson et al. 2003; Colosimo et al. 2004; Kronforst et al. 2006; Rogers & Bernatchez 2007; Chan et al. 2010). With advances in genotyping technologies, such studies have led to a rapidly growing list of loci that underlie adaptive morphological variation. However, the vast majority of these studies focus on one trait, or a single character complex. While there is nothing wrong with this approach per se, species divergence almost always involves more than one character, and the efficiency of an adaptive response likely depends on the combined evolvability of multiple traits (Kane & Higham 2016). Thus, understanding the molecular factors that promote the efficiency and extent of diversification will require a more holistic view of organismic design and the examination of the genetic basis of multiple traits. On the one hand, regions of the genome that integrate an evolutionary response across a suite of traits may be important in the first steps of divergence, as they will represent a ‘large’ target for selection. This is related to the concept of ‘genomic islands’ of divergence, wherein contiguous regions of the cichlid genome were found to segregate together during early stages of speciation (Malinsky et al. 2015). Alternatively, distinct genetic architectures could facilitate the expansion of ecological opportunity through the mixing and matching of alleles at multiple loci to come up with unique combinations of morphological characters. Such comparisons could be made in a single study or through meta-analyses. We illustrate this approach by examining a suite of ecologically relevant traits. We find that the genetic architectures for different traits are largely distinct, but also identify some potential areas of overlap. Finally, through fine-mapping and developmental analyses, we hypothesize a mechanism through which one such trait, the pectoral fin, may diverge by altering Wnt activity and col1a1 gene expression. Collectively, our data add to the growing body of literature on how species divergence occurs at the genetic and developmental levels.
Acknowledgements
We would like to thank three anonymous reviewers and members of the Albertson laboratory for their thoughtful input on the ideas and experiments presented here. This study was funded by a grant from the National Science Foundation to R.C.A. (IOS 1054909).
References
D.N. and R.C.A. conceived the project, designed the experiments, interpreted the data, and wrote and edited the manuscript. D.N. and N.O. collected the phenotypic data and performed the genetic analyses. D.N. performed WISH and experimental manipulation of the Wnt pathway.
Data accessibility
Genotypic and phenotypic data for QTL analyses (formatted for R-qtl); fin ray counts and linear measures; morphometric landmark data (TPS formatted): Dryad. doi: 10.5061/dryad.p7v21.


