Phytoplankton assemblages in response to environmental variability in tropical coastal waters of the Malacca Straits, Malaysia
Abstract
Surface phytoplankton community, abundance, and species spatial distributions were investigated in the Malacca Straits (MS) of Peninsular Malaysia during the late northeast monsoon (March) and southwest monsoon (August) in 2019 to understand factors controlling their community dynamics. This study reveals that the monsoonal transitions lead to changes in sea surface temperature (SST), sea surface salinity (SSS), total nitrogen (TN), total chlorophyll-a (Tchl-a), and phytoplankton density in the MS. A total of 204 and 163 phytoplankton species were identified during March and August, respectively, with diatoms representing the most (80.6%), followed by dinoflagellates (9.9%), cyanobacteria (8.3%), and others (1.2%). Meanwhile, the average total phytoplankton density was lower in March (10.78 × 10³ ± 14.70 cell L−1) and greater in August (26.98 × 10³ ± 45.63 cell L−1), with Chaetoceros compressus and Thalassiosira sp. Seven found the highest in each season, respectively. There was no significant correlation between phytoplankton density and environmental parameters in the MS, except for the cyanobacteria and dinoflagellate communities. However, the Canonical Correspondence Analysis results showed that environmental parameters such as SST, SSS, and nutrients in the MS could affect the dominant phytoplankton species, particularly diatoms. The findings suggest that environmental changes between the seasons may act as ecological drivers in the formation of phytoplankton communities in marine habitats of the MS.
1 INTRODUCTION
Phytoplankton are the main component of marine ecosystems and, are exceedingly crucial to ocean life, which dominates primary productivity ~50% of the earth's surface (Käse & Geuer, 2018). Phytoplankton also act as a primary producer in the food web, providing food for organisms ranging from microscopic zooplankton to multi-ton whales, including commercial fishes (Hays et al., 2005). Due to their rapid succession and high sensitivity, phytoplankton are commonly regarded as one of the essential biological indicators of the marine ecosystem for climate- and environmental-change-induced shifts in the plankton community (El-Kassas & Gharib, 2016; Katsiapi et al., 2016; Yusuf, 2020). Changes in phytoplankton community assemblages are expected to have a cascading effect on the succession of food webs in marine ecosystems, particularly the characteristics of the top-consumer community (Balci & Balkis, 2017).
Various warm and cold-water species coexist in subtropical regions with moderate temperature. Nevertheless, temperate regions experience distinct seasons that significantly influence phytoplankton dynamics, including the occurrence of spring blooms when light availability increases (Acevedo-Trejos et al., 2018). Diatoms typically dominate biomass in the spring, dinoflagellate in the late spring, coccolithophore in the early summer, dinoflagellate in the summer, and nano-flagellate in the autumn season (Mikaelyan et al., 2021). Meanwhile, in the stratified water column where the surface layers were nutrient-poor, the nano- and microplankton community, which includes both phytoplankton and heterotrophic protists was primarily dominated by dinoflagellates, other flagellates, and coccolithophores (Estrada et al., 2016). Due to the environmental conditions remaining relatively stable in tropical and subtropical areas during the year and the interplay between nutrient uptake and grazing pressure, narrow size distributions are characterized by small mean cell size, and low biomass dominated the regions (Acevedo-Trejos et al., 2018; Uitz et al., 2010).
Numerous studies on phytoplankton communities have shown that many abiotic (water temperature, light intensity, nutrient level, and salinity) and biotic (predation, grazing effect) interaction factors can influence the phytoplankton dynamic (Hays et al., 2005; Parmar et al., 2016). Among the abiotic, temperature, and salinity have received significant attention as important factors affecting the productivity of phytoplankton (Obolewski et al., 2018; Trombetta et al., 2019). Specifically, an increase in temperature may influence the biological efficiency of phytoplankton and lead to the alteration of primary producers' standing stock (Seifert et al., 2020). On the other hand, enhanced osmotic pressure induced by increasing salinity is a major cause of changes in the composition and cell abundance of the phytoplankton community (Obolewski et al., 2018). For example, some diatoms species with low salinity tolerance levels may outcompete dinoflagellates and cyanobacteria that are more tolerant to high-salinity seawater. Additionally, nutrient concentration, mainly of nitrogen and phosphorus, has been a major focus of phytoplankton research and is considered responsible for eutrophication and algal blooms (Lee et al., 2019; Wang et al., 2020).
The Malacca Straits (MS) offer the shortest and most important maritime route connecting the Indian and Pacific Oceans. The straits have a complex bathymetry that divides the area into two main basins: a narrow and shallow basin (<35 m) in the southern region and a deeper basin (>100 m) in the northern region. Due to its geographic position, the marine environment of the MS is subject to the influence of large-scale climatic anomalies, such as the Indian Ocean dipole (IOD) and the El Niño/Southern Oscillation (ENSO). The MS is also strongly influenced by the Asian monsoon system: the summer southwest monsoon (June to September) and the winter northeast monsoon (November to March), which are separated by two shorter inter-monsoonal periods; and the spring inter-monsoon (April to May) and fall inter-monsoon (October) (Malaysian Meteorology Department, 2019). In the MS, coastal regions have experienced tremendous population and economic growth, including anthropogenic activities such as agriculture, fisheries, tourism, and urbanization, which may significantly affect the marine environment (McGrane, 2016). The MS also receives significant freshwater runoff from both the west coast of Peninsular Malaysia and Sumatera Island. This freshwater supply often leads to elevated levels of nutrients and sediment within the strait (Hii et al., 2006; Praveena & Aris, 2013).
Thus far, there is a paucity of comprehensive interpretations of large-scale studies on spatio-temporal phytoplankton interactions with diverse hydrodynamic properties in the MS. The majority of related phytoplankton research around the MS has been reported (Li et al., 2013; Siswanto & Tanaka, 2014), but many studies only focused on the physical properties of sea water, salinity, or the distribution of remotely sensed Chl-a (Amiruddin et al., 2011; Mandal et al., 2021; Sprintall et al., 2003). The latest phytoplankton study in the MS has also been reported but was primarily concerned in the offshore area with an average of 79 m bottom depth (Liu et al., 2020). While this research provides insights into phytoplankton responses in deep-sea environments, there remains a lack of consensus on how the phytoplankton community composition shifts over time and across different regions of the MS, especially in coastal areas. The MS are ecologically and socioeconomically important, necessitating further investigation into phytoplankton dynamics. These concerns raise questions about the varied responses of phytoplankton to environmental changes and highlight their resilience. Given that Malaysia's coastal regions are active areas for fishing industries and aquaculture activities, a greater understanding of the effects of environmental changes on phytoplankton ecology is essential. Therefore, the main intention of this study was to examine the spatio-temporal variation of the phytoplankton community covering the area from 6 to 71 m water depth between the late northeast monsoon (March) and southwest monsoon (August), and its relationship with environmental parameters in the MS. We hypothesized that changes of the environmental parameters between seasons would affect the distribution of phytoplankton and their community dynamic.
2 MATERIALS AND METHODS
2.1 Study area and sampling stations
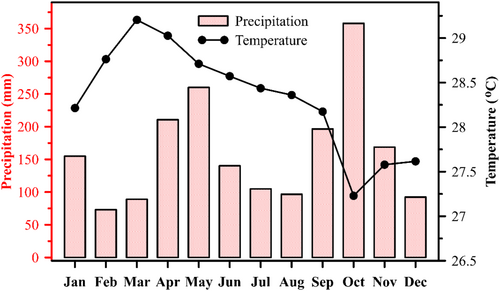
The Malacca Strait (MS) is located between the Peninsular Malaysia and Sumatera Island, extending approximately 800 km from the southern limits of the Andaman Sea to the South China Sea (SCS, Figure 1). Due to strong tidal currents and seawater intrusion from both the Andaman Sea and SCS (Liu et al., 2020; Siswanto & Tanaka, 2014), the water column is generally mixed except during the southwest monsoon, when the thermocline depth is about 15–20 m (Ibrahim & Yanagi, 2006; Isa et al., 2020; Johari & Akhir, 2019). In this area, warmer temperatures usually exist during the late northeast monsoon (March), while cold temperatures are accompanied by great amounts of precipitation occur during the fall inter-monsoon period (Figure 2).
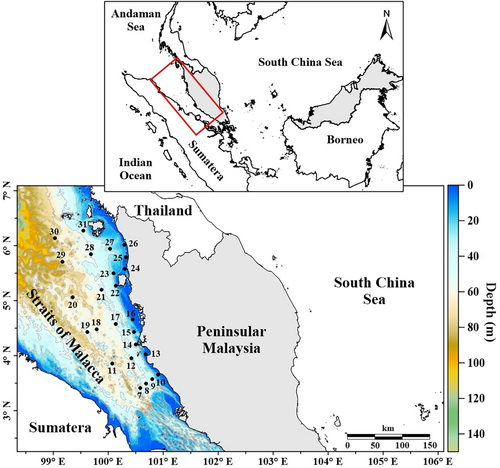
The sampling stations are located in the northern part of MS, covering an area from coastal to offshore waters with depth ranging from 6 to 71 m (Figure 1). Field measurements were carried out onboard the Discovery research vessel during 18th to 22nd March 2019 and 20th to 23rd August 2019. In total, 25 representative stations were visited during both research campaigns. The sampling sites consist of 11 nearshore stations (<35 m depth) and 14 of stations (>45 m depth).
2.2 In-situ measurements and water sampling
All water sample collections were made at a depth of about 0.5 m at each sampling station. Simultaneously with water sampling, hydrographical parameters such as salinity and temperature were measured using a Castaway-CTD profiler (SonTex, USA). Surface water samples for phytoplankton were obtained using a submersible water pump (calibrated pump rate 2.143 L s−1) and were filtered immediately with 200 and 20 μm of the serial net (30 × 30 cm) approximately ~645 L. The net was submerged into a container which contained seawater to reduce blockage and possible damage to the cells. Samples were then stored in polyethylene bottles and preserved with formalin solution (5% v/v) until analysis. Only samples in the range of 20–200 μm were observed and calculated in the laboratory. Water samples for chlorophyll-a concentration were filtered approximately 1 to 3 L (depending on particle load) onto 47-mm Whatman glass-fibre (GF/F) filters (0.7 μm pore size) under low vacuum pressure (<0.5 atm). For nutrient analysis, 1 L seawater samples were filtered through the 0.45 μm pore size hydrophilic Polyethersulfone (PES) membrane and stored for further analysis in pre-acid washed (20% hydrochloric acid) polyethylene bottles. Samples for chlorophyll and nutrients were stored in the dark at −20°C for laboratory analyses.
2.3 Samples analysis
The percentage of occurrences was measured by dividing the number of stations of dominant species with the total sampling stations. Taxonomic identification was mainly determined at the species level as possible using a phytoplankton identification guide (Grethe & Syvertsen, 1990; Hoppenrath et al., 2009; Jomas et al., 1996; Manal et al., 2009). All the taxa were verified using the Algaebase website (Guiry & Guiry, 2022). The spatial distribution of phytoplankton across the study region for both seasons, March and August, was visualized using the Surfer V27 software.
2.4 Statistical analysis
Multivariate analysis of phytoplankton community structure was performed using PRIMER V7 (Clarke et al., 2014). The hierarchical cluster analysis (HCA) and non-metric multidimensional scaling (NMDS) were applied to examine the similarity of phytoplankton species composition and abundance collected during different monsoon periods. The similarity percentage analysis (SIMPER) was used to identify the species with the most considerable contribution to the community based on Bray-Curtis similarities. The statistical Kruskal-Wallis analysis was performed to evaluate the significant differences in phytoplankton group abundance between the sampling periods and stations. Spearman correlation coefficient and canonical correspondence analysis (CCA) were applied to elucidate the relationship between the phytoplankton community and the environmental parameters. Since the assembly of phytoplankton included many rare species, those with a relative abundance of more than 1% were only selected as the major dominant species in the CCA. Prior to CCA analysis, the environmental data were standardized and normalized by subtracting the mean value and dividing by the standard deviation whereas the phytoplankton data were transformed with the fourth-root transformation. The CCA analysis was performed using XLSTat Perpetual 2019.2.2.
3 RESULTS
3.1 Environmental variables
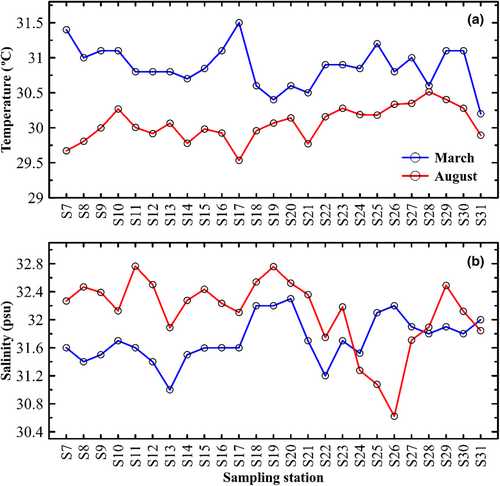
Table 1 summarizes the statistics of environmental variables of the MS, while Figure 3 shows the seasonal variability and data distribution of sea surface temperature (SST) and sea surface salinity (SSS) at each sampling station in March and August. Mean SST showed a clear seasonal pattern of warm surface water in March (30.9 ± 0.3°C) and cool surface water in August (30.1 ± 0.2°C). Similarly, mean SSS also varied between the sampling period, being fresher during March (31.7 ± 0.3 psu) than during August (32.1 ± 0.5 psu). The notable exceptions to this trend are the coastal stations located in the northern region (S24 to S27), which exhibit a marked decrease in SSS in August (Figure 3). Considerable temporal differences in total chlorophyll-a (Tchl-a) variability were observed between the sampling periods. Tchl-a varied noticeably, increasing from 0.60 ± 0.81 μg L−1 in March to 1.27 ± 1.42 μg L−1 in August. Additionally, the concentration of Tchl-a also tends to rise progressively from nearshore (<35 m) to offshore (>45 m) for both seasons March (p < .001) and August (p < .003). In general, DIN concentrations were generally much higher (p < .01) than those of DIP. Similar to Tchl-a, there were also greater fluctuations in DIN levels which are generally much higher in the coastal region than the offshore waters. Mean DIN concentrations showed a significant increase (p < .01) from 0.972 ± 0.608 μmol L−1 in March to 3.705 ± 2.028 μmol L−1 in August. The phosphate content of the MS has, however, not shown any marked seasonal trend, ranging from 0.034 ± 0.032 μmol L−1 (March) to 0.048 ± 0.013 μmol L−1 (August).
| Month | SST (°C) | SSS (psu) | Tchl-a (μg L−1) | DIN (μmol L−1) | DIP (μmol L−1) | |
|---|---|---|---|---|---|---|
|
March 2019 |
Min | 30.2 | 31.0 | 0.12 | 0.060 | n.d |
| Max | 31.5 | 32.3 | 3.63 | 2.292 | 0.097 | |
| Average | 30.9 | 31.7 | 0.61 | 0.972 | 0.034 | |
| Std | 0.3 | 0.3 | 0.80 | 0.608 | 0.032 | |
|
August 2019 |
Min | 29.5 | 30.6 | 0.19 | 2.25 | n.d |
| Max | 30.5 | 32.8 | 5.37 | 12.059 | 0.120 | |
| Average | 30.1 | 32.1 | 1.27 | 3.705 | 0.048 | |
| Std | 0.2 | 0.5 | 1.42 | 2.028 | 0.013 |
- Abbreviations: DIN, dissolved inorganic nitrogen; DIP, dissolved inorganic phosphorus; n.d, non-detectable; SSS, sea surface salinity; SST, sea surface temperature.
3.2 Species composition and abundance of phytoplankton
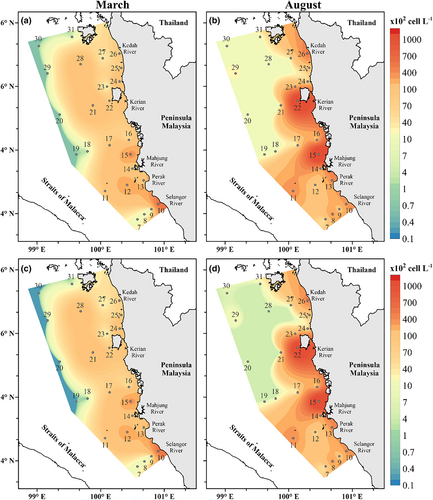
The average total phytoplankton density was lower in March (10.78 × 10³ ± 14.70 cell L−1) and higher in August (26.98 × 10³ ± 45.63 cell L−1). There was no significant difference in mean changes of total phytoplankton density in both seasons (p = .143). However, in terms of depths <35 m and >45 m, the total density of the phytoplankton proved significantly different in August (p < .05), while March does not show a difference (p > .05). The cell density is the highest in the middle of MS for both seasons (Figure 4a). The highest phytoplankton density was observed in August at S15 (183.0 × 10³ cell L−1), which is located 15 km from the coastal area, while the lowest density was recorded during March at S20 (0.06 × 10³ cell L−1). The full species dataset is available in Sohaimi et al. (2021) and Data S1.
Bacillariophyta (diatoms), Chlorophyta (green algae), Cyanobacteria (blue-green algae), Haptophyta, Miozoa (dinoflagellates), and Ochrophyta (brown algae) were the six phyla discovered in the study area for both seasons. In all of the stations, a total of 204 and 163 phytoplankton species were identified during March and August, respectively (Table S1). Among all species, 20 taxa in March and 29 taxa in August had a relative abundance of >1%, accounting for 64.9% and 68.1% of the total phytoplankton abundance (Table 2), respectively. The dominating species in March were Chaetoceros compressus (1083.9 cell L−1), Skeletonema sp. (1057.3 cell L−1), and Bacteriastrum furcatum (883.5 cell L−1). Meanwhile, Thalassiosira sp.7 appears to have the largest cell density (6462.2 cell L−1) in August, followed by Hemiaulus chinensis (2530.9 cell L−1) and Chaetoceros pseudocurvisetus (2370.2 cell L−1). Proboscia alata and Thalassiosira oestrupii were commonly observed and presented in all stations with the highest occurrence (100%) in March and August, respectively.
| Species | Density (cell L−1) | Abundance % | Occurrence % | |||
|---|---|---|---|---|---|---|
| March | August | March | August | March | August | |
| Diatoms | ||||||
| Bacteriastrum delicatulum | 558.0 | 627.3 | 2.9 | 1.6 | 76.0 | 72.0 |
| Bacteriastrum furcatum | 883.5 | 421.9 | 7.1 | 3.2 | 96.0 | 92.0 |
| Bacteriastrum hyalinum | 615.9 | 583.4 | 3.9 | 2.1 | 92.0 | 80.0 |
| Cerataulina pelagica | — | 241.7 | — | 1.2 | — | 72.0 |
| Chaetoceros compressus | 1083.9 | 845.4 | 4.5 | 7.7 | 64.0 | 76.0 |
| Chaetoceros costatus | — | 815.5 | — | 2.9 | — | 56.0 |
| Chaetoceros danicus | 356.9 | 192.7 | 2.8 | 1.2 | 80.0 | 76.0 |
| Chaetoceros decipiens | 657.9 | 720.8 | 3.7 | 4.1 | 84.0 | 92.0 |
| Chaetoceros diversus | 137.5 | — | 1.8 | — | 84.0 | — |
| Chaetoceros lorenzianus | — | 389.4 | — | 1.6 | - | 88.0 |
| Chaetoceros pseudocurvisetus | — | 2370.2 | — | 3.6 | - | 44.0 |
| Cylindrotheca sp. | — | 105.5 | — | 1.3 | - | 52.0 |
| Guinardia delicatula | — | 664.4 | — | 2.5 | — | 80.0 |
| Guinardia flaccida | 237.7 | - | 1.4 | - | 88.0 | — |
| Guinardia striata | — | 509.3 | — | 2.4 | — | 92.0 |
| Hemiaulus chinensis | — | 2530.9 | — | 4.7 | — | 84.0 |
| Lauderia annulata | — | 692.2 | — | 2.7 | — | 72.0 |
| Proboscia alata | 128.1 | — | 2.0 | — | 100.0 | — |
| Pseudo-nitzschia fraudulenta | 163.8 | — | 1.3 | — | 76.0 | — |
| Pseudo-nitzschia pungens | 206.1 | — | 1.9 | — | 76.0 | — |
| Pseudo-nitzschia seriata | 239.9 | — | 1.8 | — | 80.0 | — |
| Rhizosolenia bergonii | 197.7 | — | 1.8 | — | 68.0 | — |
| Rhizosolenia imbricata | 679.3 | 297.0 | 6.7 | 1.2 | 92.0 | 92.0 |
| Skeletonema sp. | 1057.3 | 406.5 | 6.6 | 2.2 | 76.0 | 48.0 |
| Thalassionema frauenfeldii | — | 260.3 | — | 1.2 | — | 80.0 |
| Thalassionema nitzschioides | — | 160.0 | — | 1.0 | — | 60.0 |
| Thalassiosira oestrupii | — | 559.2 | — | 2.7 | — | 100.0 |
| Thalassiosira punctigera | — | 242.3 | — | 1.5 | — | 60.0 |
| Thalassiosira sp. 7 | — | 6462.2 | — | 6.5 | — | 20.0 |
| Thalassiothrix sp. | 414.9 | 222.9 | 5.1 | 1.9 | 92.0 | 80.0 |
| Cyanobacteria | ||||||
| Cyanobacteria sp. | 71.8 | 380.9 | 1.2 | 2.1 | 16.0 | 36.0 |
| Trichodesmium sp. | 207.4 | — | 5.5 | — | 88.0 | — |
| Dinoflagellates | ||||||
| Dinoflagellates cyst | — | 197.0 | — | 2.6 | — | 92.0 |
| Scrippsiella sp. | 13.9 | — | 1.4 | — | 48.0 | — |
| Syltodinium undulans | 6.4 | 45.9 | 1.5 | 1.1 | 24.0 | 52.0 |
| Unarmored dinoflagellate sp. 1 | — | 63.5 | — | 1.5 | — | 48.0 |
- Note: Data was calculated across 25 stations during March and August. (—) represent the abundance below 1% or not found.
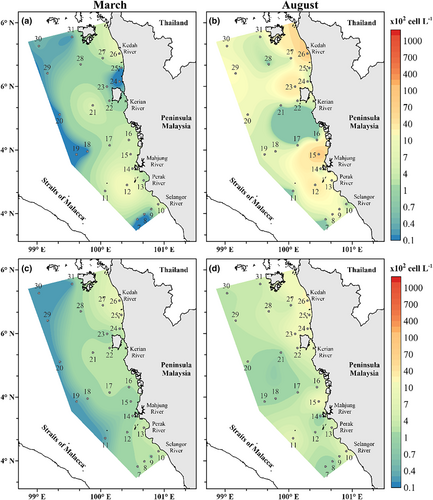
Diatoms were the most dominant phytoplankton group in MS, accounting for 95% of the total phytoplankton abundance for both seasons. They were widely distributed throughout the MS but were most prominent in the middle of MS. High density was recorded at S10 (62.18 × 10³ cell L−1) during March and S15 (177.3 × 10³ cell L−1) in August (Figure 4b). The relative abundance of cyanobacteria and dinoflagellates was usually low, accounting for about 2.5% each of the total cell abundance. In March, the density of cyanobacteria was the highest at S12 (18.36 × 10² cell L−1) and greatest at S15 (44.57 × 10² cell L−1) during the sampling period of August (Figure 5a). On the other hand, the dinoflagellate group has a higher cell density in the north of MS at S26 in both the sampling periods of May and August, with cell densities of 10.00 × 10² cell L−1 and 25.81 × 10² cell L−1, respectively (Figure 5b). The number of cell densities among the three major phytoplankton groups increases from March to August. However, only dinoflagellates demonstrated significant variations across the seasons (p = .008).
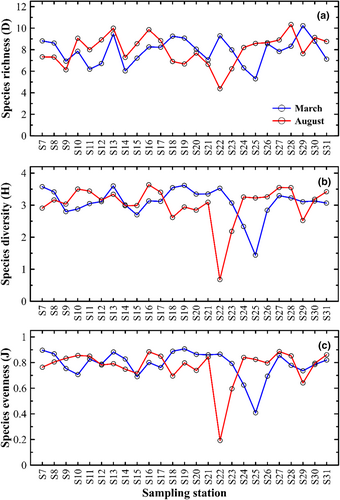
The Margalef species richness (D), Shannon diversity index (H), and Pielou's evenness (J) trends are relatively similar for March and August sampling (Figure 6). The species richness ranged from 4.37 to 10.34 in March and August, respectively. The average species diversity was 7.90 ± 1.22 in March and 8.00 ± 1.38 in August, and the species evenness was 0.79 ± 0.11 (March) and 0.77 ± 0.14 (August). Species diversity and evenness were lower in the coastal area of the northern part of MS at S25 during March and S22 in August. Still, some stations, such as S16 and S27, showed higher species diversity and evenness. No significant differences (p > .648) of the three indices were observed for both seasons in this studied region.
3.3 Phytoplankton community structure and multivariate analysis
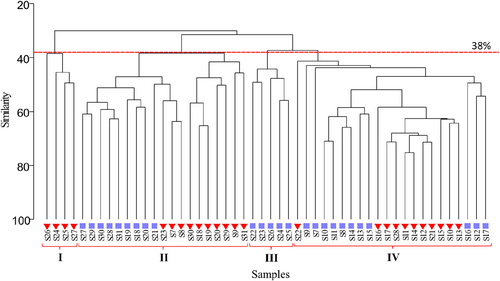
Analysis of multivariate similarity (Bray-Curtis at 38% similarity level) based on phytoplankton species community and abundance revealed the formation of the distinct major groups. Furthermore, the dendrogram results from the hierarchical cluster analysis (HCA) showed that the phytoplankton community may be divided into four major clusters (Figure 7). This was confirmed by the NMDS two-dimensional plot (stress 0.16), reflecting the substantial heterogeneity of the phytoplankton community between the sampling stations (Figure 8). Group I was made up of stations from north MS (March). Groups II and III were composed of stations from middle and north MS. However, the sample division in group II was formed with samples from both the sampling periods of March and August, whereas August samples primarily comprised of group III. The samples from all remaining stations in both seasons were used to develop group IV.
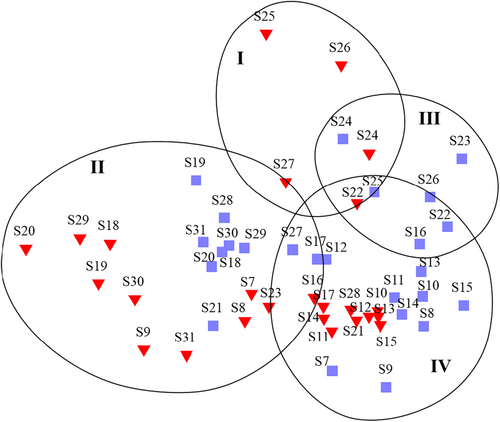
Apart from the Bray-Curtis similarities, the SIMPER program on phytoplankton abundance analysis was run to indicate the fraction of related species that most contributed to the sample division (Table 3). The analysis was divided based on seasons and regions. Our result shows that August exhibited a high resemblance (44.25%) to similar major species, with diatoms being the main contributors, preceded by Chaetoceros decipiens (4.11%), Thalassiosira oestrupii (3.84%), and Bacteriastrum furcatum (3.46%). Meanwhile, in March, diatoms accounted for 65.79% of similar species, mostly contributed by Bacteriastrum furcatum (3.98%), Bacteriastrum hyalinum (3.34%), and Thalassiothrix sp. (3.28%). Furthermore, based on the region analysis, the middle MS has higher similarity (46.31%) compared to the north MS (38.19%), with diatoms (89.4%) revealing the highest percentage of similar species, which was greatly contributed by Bacteriastrum hyalinum (3.76%), Chaetoceros decipiens (3.73%), and Bacteriastrum furcatum (3.63%).
| Seasons | Main group | Major contributors species | Av.Sim | Contrib % |
|---|---|---|---|---|
| March | Diatoms (65.79%) | Bacteriastrum furcatum | 1.95 | 3.98 |
| Av. Similarity: | Thalassiothrix sp. | 1.91 | 3.28 | |
| 40.93% | Proboscia alata | 1.61 | 2.80 | |
| Bacteriastrum hyalinum | 1.54 | 3.34 | ||
| Rhizosolenia imbricata | 1.39 | 3.09 | ||
| Cyanobacteria (2.92%) | Trichodesmium sp. | 1.55 | 2.92 | |
| Dinoflagellates (1.36%) | ||||
| August | Diatoms (77.85%) | Chaetoceros decipiens | 1.82 | 4.11 |
| Av. similarity: | Thalassiosira oestrupii | 1.70 | 3.84 | |
| 44.25% | Bacteriastrum furcatum | 1.53 | 3.46 | |
| Guinardia striata | 1.50 | 3.39 | ||
| Chaetoceros compressus | 1.42 | 3.20 | ||
| Cyanobacteria (7.91%) | ||||
| Dinoflagellates (8.62%) | Dinoflagellates cyst | 1.66 | 3.75 | |
| Region | ||||
| Middle MS | Diatoms (89.4%) | Bacteriastrum hyalinum | 1.74 | 3.76 |
| Av. similarity: | Chaetoceros decipiens | 1.73 | 3.73 | |
| 46.31% | Bacteriastrum furcatum | 1.68 | 3.63 | |
| Chaetoceros compressus | 1.57 | 3.40 | ||
| Thalassiothrix sp. | 1.55 | 3.34 | ||
| Cyanobacteria (2.57%) | ||||
| Dinoflagellates (3.25%) | ||||
| North MS | Diatoms (71.49%) | Bacteriastrum furcatum | 1.81 | 4.74 |
| Av. similarity: | Proboscia alata | 1.62 | 4.25 | |
| 38.19% | Chaetoceros decipiens | 1.43 | 3.75 | |
| Rhizosolenia imbricata | 1.38 | 3.62 | ||
| Cyanobacteria (3.78%) | Trichodesmium sp. | 1.44 | 3.78 | |
| Dinoflagellates (3.1%) | ||||
- Note: The percentage contribution of phytoplankton groups in parenthesis.
- Abbreviations: Av, average; contrib, contribution; sim, similarity.
3.4 Relationship between environmental factors and phytoplankton community
Spearman's correlation analysis and CCA biplot were used to investigate the effects of environmental conditions on distinct groups and particular dominating species. The results of correlation coefficient analysis revealed that the total phytoplankton density and diatoms had no significant correlation with SST, SSS, and nutrients in MS (Table 4). However, the abundance of phytoplankton, diatom, and dinoflagellate was significantly correlated with Tchl-a (p < .01). On the other hand, the proportion of cyanobacteria exhibited a significant negative relationship with TP (p < .05), whereas dinoflagellates showed a substantial correlation with DIN (p < .01). Nevertheless, in terms of seasonally correlation (Table 4), the total density (p < .05) and diatoms (p < .05) significantly correlate with SSS during March, while dinoflagellates have a relationship with DIN (p < .05). During August, only cyanobacteria show a correlation with DIN and DIP (p < .05), meanwhile, dinoflagellates correlate with SST and SSS (p < .01). Community diversity was main influenced by SSS (August), while evenness was driven by SST (March) (p < .05).
| Seasons | SST | SSS | DIN | DIP | Tchl-a | |
|---|---|---|---|---|---|---|
| March | Total density | 0.014 | −0.445* | 0.248 | 0.052 | 0.370 |
| Diatoms | 0.005 | −0.458* | 0.235 | 0.046 | 0.371 | |
| Cyanobacteria | 0.033 | −0.302 | −0.180 | −0.181 | 0.145 | |
| Dinoflagellates | 0.335 | −0.240 | 0.418* | 0.221 | 0.407* | |
| Richness, D | 0.050 | 0.086 | −0.050 | 0.044 | −0.074 | |
| Diversity, H | −0.253 | −0.032 | −0.069 | −0.212 | −0.335 | |
| Evenness, J | −0.400* | −0.071 | −0.004 | −0.233 | −0.308 | |
| August | Total density | 0.002 | −0.134 | −0.272 | 0.242 | 0.791** |
| Diatoms | −0.054 | −0.107 | −0.265 | 0.271 | 0.775** | |
| Cyanobacteria | 0.229 | 0.077 | −0.461* | −0.431* | 0.054 | |
| Dinoflagellates | 0.639** | −0.521** | −0.105 | −0.113 | 0.414* | |
| Richness, D | 0.234 | −0.375 | 0.191 | 0.069 | 0.051 | |
| Diversity, H | 0.092 | −0.408* | 0.110 | 0.222 | 0.013 | |
| Evenness, J | −0.030 | −0.288 | 0.147 | 0.238 | −0.200 | |
| All | Total density | −0.153 | −0.145 | 0.089 | −0.013 | 0.619** |
| Diatoms | −0.144 | −0.155 | 0.082 | 0.028 | 0.612** | |
| Cyanobacteria | 0.028 | −0.068 | −0.085 | −0.334* | 0.128 | |
| Dinoflagellates | −0.061 | −0.133 | 0.389** | −0.104 | 0.464** | |
| Richness, D | 0.037 | −0.102 | 0.067 | 0.032 | 0.016 | |
| Diversity, H | −0.035 | −0.193 | −0.008 | 0.009 | −0.169 | |
| Evenness, J | −0.067 | −0.153 | −0.028 | −0.020 | −0.278 |
- *p < .05; **p < .01.
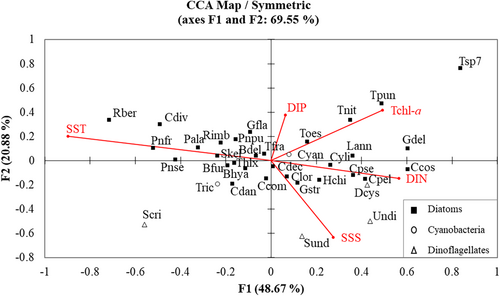
Despite the fact that the total density and diatoms had no correlation with SST, SSS, or nutrients, the dominating phytoplankton species were shown to have positive associations with the environmental factors. This can be validated through the CCA biplot graph (Figure 9) which described 69.55% of the total variance within the entire dataset of phytoplankton. The first canonical axis (F1), accounting 48.67% of the total variance, showed a strong negative correlation with SST and a moderate positive association with Tchl-a and DIN. In contrast, the second axis (F2) showed a negative correlation with SSS and a weak positive contribution by Tchl-a and DIP. As the most dominant species found in MS, Thalassiosira sp. Seven were highly associated with the two axes (Figure 9), favouring lower temperatures with high nutrients. Meanwhile, some other diatoms species such as Rhizosolenia bergonii, Chaetoceros diversus, Pseudo-nitzschia fraudulenta, Proboscia alata, Pseudo-nitzschia seriata, Rhizosolenia imbricata, Skeletonema sp., Thalassionema frauenfeldii, Thalassiothrix sp., Bacteriastrum delicatulum, Bacteriastrum hyalinum, and Pseudo-nitzschia pungen were barely influenced by the SST. However, Scrippsiella sp. from the dinoflagellates group was negatively affected by the environmental variables along axis 2; particularly, it was adversely related to SST and nutrients. The other dinoflagellates species Syltodinium undulants, Unarmored dinoflagellate sp. 1, and dinoflagellate cyst with some diatoms such as Chaetoceros lorenzianus, Hemiaulus chinensis, Cylindrotheca sp., Cerataulina pelagica, Chaetoceros costatus, and Chaetoceros pseudocurvisetus tend to prefer high-salinity and nitrogen-enriched seawater.
4 DISCUSSION
4.1 Variations of environmental parameters
Generally, the surface seawater of Peninsular Malaysia is influenced by seasonal variations of the monsoon season. Monsoons can drive a pronounced variation in currents and precipitation, which in turn affects the physical–chemical characteristics of sea water and the phytoplankton community (Ke et al., 2014). It is clear from our findings that sea surface temperatures (SST) were slightly warmer during the late northeast monsoon (March) than the southwest monsoon (August). This finding is consistent with the results of Isa et al. (2020), who recorded that SSTs began to warm during March, ranging from 29.35°C to 29.81°C in the MS. This consistency might be attributed by several oceanic factors, including the weakening of surface winds and low amounts of total cloud cover, which consequently cause ocean warming between March and April (Ashin et al., 2019; Yang & Wu, 2019).
Contrastingly, this study suggests that sea surface salinity (SSS) is marginally higher in August than March. The prevailing south-westerly wind during August may cause high-saline water from the Indian Ocean and the Andaman Sea to enter the MS (Amiruddin et al., 2011). Changes in SST and SSS during both seasons, especially from the middle of the MS to the northern part of the MS, might be caused by the intrusion of seawater flows from the Andaman Sea. This intrusion was confirmed by Thia-Eng et al. (2000), Siswanto and Tanaka (2014), and Isa et al. (2020), who stated that seawater currents flowed from the central Andaman Sea towards the MS due to variances in the sea-surface height between the endpoints of the northern part of the straits and the Andaman Sea.
Interestingly, this study indicates that the amount of total chlorophyll-a (Tchl-a) increased significantly in August near the coastal areas of the middle and northern parts of the MS. This increase is consistent with a rise in nutrient concentrations, suggesting that the nutrients in seawater may enhance the increase of phytoplankton biomass in the MS. The nutrient concentration might arise partly because of river-water discharge from Sungai Klang, which is close to the study area at station S13, and Sungai Nipah, located at S22. Ke et al. (2016) validated that salinity and nutrient concentration were the key environmental elements that affected phytoplankton community fluctuations in the MS, which were induced by river runoff and deep-water intrusion. However, considering the exchange of seawater with the Andaman Sea, the occasional incursion of nutrient-rich seawater from the Andaman Sea could also have promoted phytoplankton growth in the MS (Siswanto & Tanaka, 2014; Tan et al., 2006).
4.2 Phytoplankton community and the controlling factors
The average total phytoplankton density in this study indicates increased abundance in August, specifically two-fold higher than in March, and thus seasonal differences. This finding is consistent with trends in other research studies (He et al., 2022; Huang et al., 2004), but the density is slightly higher than that previously reported in the MS (Liu et al., 2020). The differences may have resulted from variations in sampling area and method of sampling. Our study employed the use of plankton net sampling, which towed vertically rather than bottle sampling. Additionally, the influence of river discharge in the shallow nearshore area diluted the seawater, especially close Sungai Klang and Sungai Nipah, and delivered abundant nutrients that were essential to the growth and propagation of phytoplankton, thus increasing the phytoplankton community in this particular area. The straits are also connected to the deep-sea water of the Andaman Sea and are greatly influenced by the tides (Rizal et al., 2012) that could induce the phytoplankton abundance from the offshore to the nearshore area since the findings in this study have a significant difference in depth. Thia-Eng et al. (2000) demonstrated that the deeper area of the northern MS exposed to open areas has lower chlorophyll rather than the shallower and narrower southern region in MS.
In this study, the diatom group dominated the phytoplankton population in both seasons, representing 80.9% and 82.8% in March and August, respectively. According to the previous literature, the MS sea-surface water, including estuaries and coastal regions, is often dominated by the diatoms group, whose abundance is more than 50% in the ocean (Jalal et al., 2011; Ke et al., 2016; Lassen et al., 2004; Nursuhayati et al., 2013; Salleh et al., 2005, 2008; Sidik et al., 2008). Notably, an increase in total phytoplankton density has been associated with increases in diatom abundance, demonstrating that these groups are the primary contributors to communities across the study region. This trend was also supported by nMDS and SIMPER analysis, which showed that the diatoms group contributed the most to the division samples. According to Bowler et al. (2010), the ecological resilience of diatoms in global oceans reveals that the diatoms use complex processes to monitor and easily adapt to different environmental conditions. They have potentially helpful characteristics, including the existence of vacuoles for nutrient storage, a solid silicified cell wall, and fast reflexes to alterations in ambient light.
Variations in the richness of phytoplankton species D (4.37, March; 10.34, August), H (7.9, March; 8.0, August), and J (0.79, March; 0.14, August) showed great similarity, with pronounce decreases only at S22 and S25 for both seasons. Community diversity was mainly influenced by SSS (August), while evenness was driven by SST (March). In marine phytoplankton studies, the diversity index is a biodiversity measurement tool commonly used to more accurately reflect the attributes of the phytoplankton community and its relationship with the environment (Mitra et al., 2012). In other studies, it has frequently been reported that water salinity and temperature drove the dynamics of phytoplankton communities, such as estuaries in the Mediterranean Sea (Dursun & Tas, 2019) andcoastal waters during the monsoon in India (Vajravelu et al., 2018). The study conducted in other regions also proved that the phytoplankton communities were principally impacted by the fluctuations of temperature, silicate concentration, and the suspended solid in seawater (Wang et al., 2023; Zhang et al., 2023). According to Acevedo-Trejos et al. (2018), the wide range of environmental variability in temperate areas retains phytoplankton populations with higher biomass, bigger mean cell sizes, high diversity, and larger productivity and export than the tropical ocean. However, the negative relationship observed in this study indicates that increased SST and SSS may favor the competitive dominance of relatively few species, thus leading to a decrease in diversity and evenness.
As for the spatial distribution of phytoplankton, our results were relatively similar in both seasons, with the highest abundance recorded near the coastal region and showing a decreasing trend towards the offshore region. Nutrient load from the river-water runoff could be the driving factor enhancing the abundance of phytoplankton, particularly at S10 and S15 in March and August, respectively. Despite no correlation between total phytoplankton and environmental parameters, total cyanobacteria and dinoflagellates were limited by the available nutrients DIP and DIN, respectively, which was consistent with previous research results (Chen et al., 2021; Teeling et al., 2012). Various nutrient conditions could eventually contribute to different algae compositions and variations in dominant organisms, densities, and biomass (Miao et al., 2019). The Canonical Correspondence Analysis (CCA) biplot proved that most of the dominant diatom species in this study area positively correlated with the environmental factors SST and DIN, especially from the genera of Chaetoceros spp. and Bacteriastrum spp. due to their morphological adaptability. These cosmopolitan chain-forming species can reproduce rapidly under nutrient-rich conditions and form long chains of thin-walled cells through the fusion of setae (Itakura, 2000). Additionally, Li et al. (2019) explained that the lower nitrogen concentration was attributed to phytoplankton proliferation, and in this study, the biomass of dinoflagellate Scrippsiella sp sp. increased with decreasing DIN, suggesting that this species could satisfactorily reproduce but also grow when available nitrogen was limited.
In our study, we observed a shift in dominance from the chain-forming centric diatom genera of Chaetoceros spp. in March to Thalassiosira spp. in August. Research suggests these chain-forming species are ubiquitous in world oceans and are particularly predominant in coastal areas (Booth et al., 2002; Chappell et al., 2013; Gin et al., 2000; Jin & Agustí, 2018; Salleh et al., 2008). Contrastingly, the species of Chaetoceros sp. was generally found to be dominant in most previous studies conducted along the MS (Mohammad-Noor et al., 2013; Salleh et al., 2005, 2008), including some other species, such as Skeletonema sp. (Ke et al., 2016) and Thalassionema nitzschioides (Liu et al., 2020). The shift of these dominant species in this study is likely due to their fast adaption to environmental changes, particularly ocean temperatures (Jin & Agustí, 2018), and a high degree of eutrophication (He et al., 2022). Moreover, the MS itself has undergone tremendous developments that may enhance pollution from land-based sources, notably an aquaculture farm (Kawasaki et al., 2016) as well as ship congestion in the region (Thia-Eng et al., 2000). These aspects might have contributed to the variability of the phytoplankton distribution pattern and the succession of dominant phytoplankton species during the monsoon cycle. Nevertheless, further studies are required to perform long-term monitoring of phytoplankton communities and determine the response of phytoplankton to the coastal ecological environment of the MS.
5 CONCLUSION
This study evaluated the phytoplankton community structure, ecological indicators, and environmental conditions during the late northeast monsoon (March) and southwest monsoon (August) in the MS. The mean changes of sea surface temperature (SST), sea surface salinity (SSS), and total chlorophyll-a (Tchl-a) were found to differ significantly between the two seasons, suggesting that the fluctuations of physical-biological variables in the MS depended on the monsoon transitions. Moreover, we confirmed that phytoplankton abundance increased from March to August and rapidly expanded from the deep water offshore to the shallower nearshore in southwest monsoon season. Meanwhile, the indices demonstrated a similar pattern from the middle MS to the northern MS, with diatoms dominating the phytoplankton community throughout the study period. However, only the dinoflagellates showed significant differences between the two seasons, suggesting that the abundance of dinoflagellates varied across the sampling month. The variation might also have been promoted by the intrusion of seawater flow from the Andaman Sea and river-water discharge because the highest densities found in the coastal area were in the middle and northern part of the MS. The findings of this study may act as a new benchmark for understanding the physico-chemical interaction of phytoplankton. Going forward, understanding of the long-term patterns of phytoplankton species is required, including their environmental interaction, for maintaining biodiversity and ecosystem functionality.
AUTHOR CONTRIBUTIONS
Erqa Shazira Sohaimi: Conceptualization, data collection and analysis, interpretation of the result, writing and editing; Roswati Md Amin: Conceptualization, project administration, data analysis, interpretation of the result, writing, editing and funding; Md Suffian Idris: Interpretation of the result, review and editing; Poh Seng Chee: Data collection and analysis; Mohd Fadzil Mohd Akhir: Editing and funding.
ACKNOWLEDGEMENTS
Thanks to the Centre of Research & Field Service, UMT's research vessel (RV Discovery), the captain and crew on board, and Faculty of Science and Marine Environment (FSSM), Universiti Malaysia Terengganu, for supporting this research. We also acknowledge everyone involved in the sampling onboard RV Discovery for Langkawi International Maritime & Aerospace's (LIMA) scientific expedition to Langkawi, 2019. Our thanks also to En. Che Mohd Zan Husin, En. Abdul Manaf for their assistance in the laboratory analysis.
FUNDING INFORMATION
This research was funded by a grant (UMT/TAPE-RG/2019–55187) from Universiti Malaysia Terengganu.
CONFLICT OF INTEREST STATEMENT
The authors declare that they have no known competing financial interests or personal relationships that could have appeared to influence the work reported in this paper.
Open Research
DATA AVAILABILITY STATEMENT
The data that supports the findings of this study are available in the supporting information of this article.


