The impact of space, host dissimilitude, and environment on prokaryotic communities of golf ball sponges
Abstract
Golf ball sponges are small, sometimes inconspicuous, sponges. They can be found across a range of habitats varying from perturbed and pristine coral reefs to harbours and marine lakes and from the deep sea to shallow waters. They can be difficult to distinguish in the field and have presented some problems with taxonomists lumping and splitting species due to the difficulty in defining clear species boundaries. In the present study, we sampled golf ball sponges from Indo-Pacific and Caribbean locations and used 16S gene amplicon sequencing to study their prokaryotic communities. We show that golf ball sponges harbour a wide variety of prokaryotic communities. Among the most prevalent operational taxonomic units (OTUs), several belonged to a range of taxa, including the bacterial AqS1 and EC94 groups, which have been associated with genes known to facilitate interactions between hosts and microbes. Certain host taxa were enriched with OTUs classified to the SAR202 clade of Chloroflexi. Our findings show that prokaryotic dissimilarity varied as a function of space (geographical distance) and host dissimilitude. The importance of space and host dissimilitude, however, varied depending on the data transformation with host dissimilitude a more important predictor of untransformed data whereas space was a more important predictor of log-transformed data. Given that log-transformation downscales the influence of abundant taxa, we interpret these results by the tendency of closely related host organisms to host similar sets of abundant symbiotic microorganisms; distantly sampled specimens, in contrast, tend to harbour less abundant prokaryotic microorganisms found in the surrounding environment (e.g., seawater or sediment).
1 INTRODUCTION
Beta diversity plays a crucial role in unravelling the dynamics of ecosystems and is often explored by examining shifts in community dissimilarity as a function of distance, a phenomenon known as distance dependence (Cleary et al., 2004; Nekola & White, 1999; Tuomisto et al., 2003). The study of distance dependence in microbial communities holds particular pertinence because it challenges the conventional notion that microbes are ubiquitously distributed (Baas Becking, 1934). Given their exceptionally large population sizes and apparent ease of dispersal, it was initially assumed that microbes would not be constrained by dispersal limitations; it is worth noting that some studies have indeed failed to establish a definitive link between geographical distance and community dissimilarity, as highlighted in Clark et al. (2021). Other studies, however, have shown microbial communities to exhibit significant distance dependence including communities associated with host organisms (Clark et al., 2021; Green et al., 2004; Hanson et al., 2012; Martiny et al., 2006, 2011; Papke et al., 2003; Whitaker et al., 2003).
Microbes not only inhabit various environmental niches such as soil, sediment and water but can also form intricate associations with multicellular host organisms. These microbial communities often develop into stable, host-specific assemblages, exerting a profound influence on host fitness and fulfilling vital ecological functions (Thompson et al., 2015). In previous studies of the poriferan Xestospongia species complex (Cleary et al., 2022; Swierts et al., 2018), we showed that variation in prokaryotic dissimilarity was primarily associated with geography with minor contributions of host dissimilitude and environmental parameters (sea surface temperature and chlorophyll a concentrations). Likewise, other studies have highlighted the importance of space in addition to environment in structuring microbial communities across a range of disparate habitats (Clark et al., 2021; Hanson et al., 2012 and references therein).
In the present study, we tested to what extent space, environment, and host dissimilitude structured prokaryotic communities associated with a golf ball sponge species complex; the name derives from the golf ball-like shape and appearance with numerous porocalices. Golf ball sponges tend to be highly adaptable and can be found across a wide range of habitats including coral reefs, marine lakes, mangroves, and rocky shores (Cleary et al., 2013, 2018b; de Voogd et al., 2009; de Voogd & Cleary, 2008, 2009; Ferreira & Cleary, 2022). It can also be particularly difficult to identify species in the field.
We employed a comprehensive approach combining 16S rRNA gene amplicon sequencing, 28S rRNA gene sequencing of sponge hosts, classical taxonomy, and the use of remotely sensed environmental parameters to investigate golf ball sponges (Family Tetillidae; de Voogd et al., 2022) and their prokaryotic communities. All specimens of golf ball sponges here were identified as belonging to the genera Cinachyrella and Paratetilla. Previous studies of the family Tetillidae used COI, 18S, and 28S markers (Carella et al., 2016; Szitenberg et al., 2010) to study phylogenetic relationships. Szitenberg et al. (2010) noted that the genus Cinachyrella was not monophyletic and Carella et al. (2016) suggested that species of Cinachyrella should be moved to the genus Paratetilla, as this is the older genus name (1905 vs. 1925).
In line with a previous study of the Xestospongia species complex (Cleary et al., 2022), we test the hypotheses that 1. golf ball sponge prokaryotic communities are structured by space, host dissimilitude, and environment and 2. log transformation of prokaryotic community data amplifies the relative importance of space at the expense of host dissimilitude. We believe this to be the case because log transformation increases the relative importance of less abundant community members. Much of the sponge prokaryotic community consists of rare, locally derived microorganisms of largely unknown importance. Giving greater weight to these community members should increase the relative importance of space. In contrast, highly abundant community members may be shared among closely related sponge host species, which should give greater importance to host dissimilitude. In addition to the above, we provide a description of the dominant prokaryotic taxa inhabiting golf ball sponge (morpho)species.
2 MATERIALS AND METHODS
2.1 Sampling
Samples were collected in various sites across the Indo-Pacific and Caribbean (Data S1). Site descriptions have been previously provided for the Berau (Cleary et al., 2018a; Cleary & Gomes, 2019) and Papua (Cleary et al., 2018b) regions of Indonesia, Taiwan (Cleary et al., 2019; Coelho et al., 2018), Mayotte (de Voogd et al., 2019), Martinique (Cleary, de Voogd, et al., 2023) and Rodrigues (Cleary, Oliveira, et al., 2023). Fragments of the sponge including the surface and interior, in order to sample as much of the prokaryotic community as possible, were stored in tubes containing 96% ethanol. All samples were kept cool (<4°C) immediately after collection and during transport. In the laboratory, samples were stored at −20°C until DNA extraction. Data for all samples including the sampling location and time of sampling can be found in Data S1.
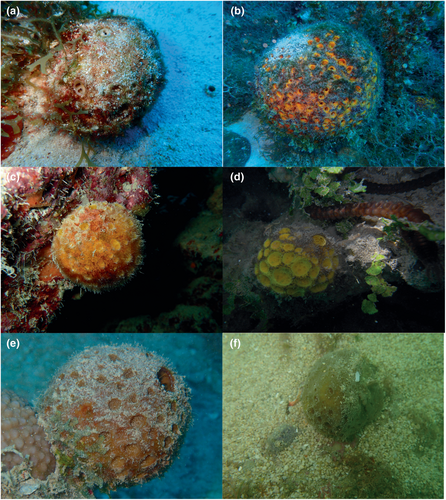
A total of 46 sponge specimens were included in the present study. Voucher samples of all specimens have been deposited in the sponge collection of Naturalis Biodiversity Center (Data S1). Sponge samples were separated into distinct (morpho)-species based on classical taxonomical characters (Figure 1). For each specimen, the dimension and morphology of the silicious spicules were measured and compared with one another and with type material of various Cinachyrella species including C. porosa, C. providentiae, C. australiensis and Paratetilla arcifera. Using this, we identified 11 groups, that is (morpho)-species from different sampling locations. These included Cinachyrella spA from Berau (CaB) and Papua (CaP), Cinachyrella spB from Berau (CbB) and Papua (CbP), Cinachyrella spN from Taiwan (CnT), Cinachyrella kuekenthali (Uliczka, 1929) (CkM) from Martinique, Cinachyrella alloclada (Uliczka, 1929) (ClM) from Martinique, Cinachyrella spT from Rodrigues (CtR), Cinachyrella spU from Rodrigues (CuR), Cinachyrella spX (CxS) and spY (CyS) from Saudi Arabia, and Paratetilla bacca (Selenka, 1867) from Berau (PbB), Mayotte (PbM) and Taiwan (PbT). In addition to these specimens, we also sampled four specimens of Cinachyrella (CnZ) from a zoo aquarium in the Netherlands of unknown origin. Photographs of selected specimens are shown in Figure 1.
2.2 Host dissimilitude
DNA was extracted from the sponge tissue of 28 specimens using the DNeasy Blood and Tissue kit (Qiagen, Germantown, MD) following the manufacturer's instructions. For the nuclear 28S marker, the D3-D5 region of the 28S rRNA gene was amplified using primers f RD3A (5′-GACCCGTCTTGAAACACGA-3′) and RD5B2 (5′-ACACACTCCTTAGCGGA-3′), which amplified a fragment of 596 bps. Amplifications were carried out in 25 μL reaction volumes containing 8.9 μL of MilliQ water, 5 μL 5× Phire® reaction buffer, 5 μL Q-solution, 2 μL dNTPs (2.5 mM), 1.3 μL of each primer (10 μM), 0.5 μL Phire® Hotstart II Taq polymerase, and 1 μL DNA. The PCR profile was as follows: an initial denaturing step of 98°C for 30 s, 35 cycles of denaturing at 98°C for 5 s, annealing at 50°C for 5 s, extension at 72°C for 15 s, and a final extension step at 72°C for 5 min. Sequence lengths of the 28S rRNA nucleotide data varied from 540 to 824 bps with an average of 705 bps.
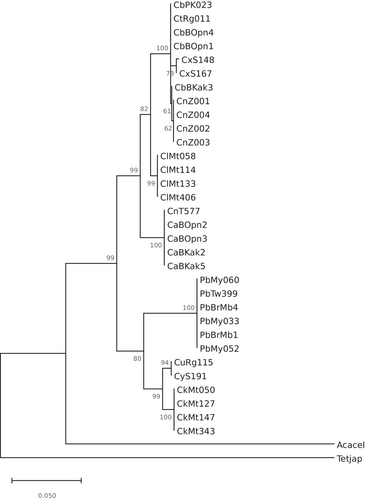
We constructed a phylogenetic tree with the 28S rRNA nucleotide sequences, including specimens of all sponge (morpho)species, with the MEGAX program (http://www.megasoftware.net/; last checked 2019/09; Tamura et al., 2011). In addition to these sequences, we included 28S sequences of two other species belonging to the family Tetillidae, Tetilla japonica (GenBank #: JX177956) and Acanthotetilla celebensis (GenBank #: JX177920) as outgroups. The 28S rRNA gene sequences were first aligned using the ClustalW algorithm in MEGAX. A maximum-likelihood phylogenetic tree was subsequently built using the generalised time-reversible model (Tavaré, 1986) with discrete Gamma distribution and invariant sites. Initial tree(s) for the heuristic search were automatically obtained with Neighbour-Join and BioNJ algorithms to a matrix of pairwise distances estimated using the Maximum Composite Likelihood (MCL) approach, followed by selection of the topology with superior log likelihood value. Branches with <50% bootstrap support were collapsed. In the results, we present a bootstrap consensus tree based on 100 replicates (Felsenstein, 1985). The bootstrap value is shown next to each branch when this exceeds 50%. This value represented the percentage of replicate trees in which the associated taxa clustered together.
2.3 DNA extraction for next-generation sequencing analysis
PCR-ready genomic DNA was isolated from all samples using the FastDNA® SPIN soil Kit (MPbiomedicals) following the manufacturer's instructions. Briefly, ±500 mg of sponge tissue (including parts of the surface and interior) was added. The microbial cell lysis was performed in the FastPrep® Instrument (Q Biogene) for 80 s at 6.0 ms−1. The extracted DNA was eluted into DNase/Pyrogen-Free water to a final volume of 50 μL and stored at −20°C until use. The 16S rRNA gene V3-V4 variable region PCR primers 341F 5′-CCTACGGGNGGCWGCAG-3′ and 785R 5′-GACTACHVGGGTATCTAATCC-3′ (Klindworth et al., 2013) with barcode on the forward primer were used in a 30-cycle PCR assay using the HotStarTaq Plus Master Mix Kit (Qiagen, USA) under the following conditions: 94°C for 3 min, followed by 28 cycles of 94°C for 30 s, 53°C for 40 s and 72°C for 1 min, after which a final elongation step at 72°C for 5 min was performed. After amplification, PCR products were checked on a 2% agarose gel to determine the success of amplification and the relative intensity of bands; the blank control did not yield any bands. PCR product was used to prepare the DNA library following the Illumina TruSeq DNA library preparation protocol. Next-generation, paired-end sequencing was performed at MrDNA (Molecular Research LP; http://www.mrdnalab.com/; last checked 18 November 2016) on an Illumina MiSeq device (Illumina Inc., San Diego, CA, USA) following the manufacturer's guidelines. Sequences from each end were joined following Q25 quality trimming of the ends followed by reorienting any 3′–5′ reads back into 5′–3′ and removal of short reads (<150 bp).
2.4 16S rRNA gene sequencing analysis
The 16S rRNA amplicon libraries were analysed using QIIME2 (version 2019.7; Bolyen et al., 2019). Raw data were imported yielding a demultiplexed ‘qza’ data file (artefact). The DADA2 plugin (Callahan et al., 2016) in QIIME 2 was subsequently used to trim sequences (final length 400 nt). The DADA2 analysis yielded output archives containing an OTU (at 100% sequence similarity, also known as amplicon sequence variant or ‘ASV’) table, denoising stats and a fasta file of representative sequences. The feature-classifier plugin with the extract-reads method was then used with the i-sequences argument set to silva-138-99-seqs.qza. This was followed by the feature-classifier plugin with the fit-classifier-naive-bayes method and the i-reference-taxonomy method set to silva-138-99-tax.qza. Both silva-138 files can be obtained from https://docs.qiime2.org/2020.8/data-resources/?highlight=silva; last checked 2024-02-20. The feature-classifier plugin was then used with the classify-sklearn method and the i-reads argument was set to the representative sequences file generated by the DADA2 analysis to produce a table with taxonomic assignment for all OTUs. Finally, mitochondria, chloroplasts, and Eukaryota were filtered out using the QIIME taxa plugin with the filter-table method. The OTU and taxonomy tables were later merged in R. After denoising, removal of chimera, mitochondria, chloroplasts, Eukaryota, and OTUs unclassified at Domain or Phylum level, the final dataset consisted of 3,975,174 sequences and 15,348 OTUs.
2.5 Remotely sensed data
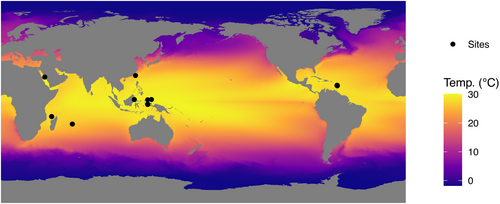
Global, remotely sensed data were downloaded from the National Oceanic and Atmospheric Administration OceanWatch website (https://oceanwatch.pifsc.noaa.gov/erddap/index.html; last checked 2020-12-11). This consisted of cumulative long-term mean (January 2003–February 2019) Aqua MODIS data for chlorophyll a (Chla) and Coral Reef Watch data (2003–2017) for Sea Surface Temperature (SST). All data were downloaded in netCDF format and imported into R (R Core Team, 2020) using the raster function from the raster package. Missing values were added using the knnImputation function from the DMwR package (Torgo, 2010) with a K of 2. A map of the study area showing long-term variation in SST, including the locations of the sampling sites, is shown in Figure 2.
2.6 Statistical analyses
Tables containing OTU counts, geographic coordinates, SST, and Chla values were imported into R. Data S2 contains all operational taxonomic unit (OTU) counts per sample and taxonomic classifications of all OTUs. The 50 most abundant OTUs are presented in Data S3. The OTU counts matrix was used to compare diversity among host groups. Diversity indices were obtained using the rarefy and diversity functions from the vegan (Oksanen et al., 2020) package in R.
Variation in OTU composition among biotopes was visualised with principal coordinates analysis (PCO) using the Phyloseq package (McMurdie & Holmes, 2013). Prior to PCO analysis, the count data matrix was rarefied using the rarefy_even_depth function from the Phyloseq package with the sample.size argument set to the minimum sample size (12,398 in the present study). Subsequent to rarefaction, two matrices were generated consisting of an untransformed matrix and a log10 (x + 1) transformed matrix. In multidimensional scaling (MDS) and other ordination techniques, log transformation scales down the effect of abundant species, thus amplifying the affect of rarer species (Field et al., 1982; Ribera et al., 2001; van Tongeren, 1995).
In addition to data visualisation using PCO, we tested for significant associations between prokaryotic dissimilarity and space (geographic distance), host dissimilitude, and environment. For geographic distance, a distance matrix was obtained using the earth.dist function from the fossil package. This creates a distance matrix of pairwise distances in kms between all sample sites. The environmental data matrix (consisting of SST and Chla values) was obtained using the vegdist function in vegan with the method argument set to ‘euclidean’. The 28S sequences were used to generate a matrix of host dissimilitude with the dist.ml function in the R package phangorn (Schliep, 2011).
Relationships between dissimilarity and geographic distance have been shown to follow power laws for a wide range of taxa (Clark et al., 2021). In the present study, we applied the Levenberg–Marquardt algorithm using the nlsLM function from the minpack.lm library in R to estimate the parameters of power law models of dissimilarity versus geographic distance. The MRM function from the ecodist library in R was used with 1000 permutations to carry out multiple regressions on distance matrices with the Bray–Curtis dissimilarity matrix as response variable and spatial (geographic distance), environmental (SST and Chla) and host dissimilitude distance matrices as predictor variables. Variance partitioning (Borcard et al., 1992) was used to partition the variance in community dissimilarity attributable to space, host dissimilitude and environment in addition to the union (e.g., the spatially structured environmental component) of all data sets. Tests were performed using untransformed and log-transformed response dissimilarity matrices. Previous studies that have used a distance-based variance partitioning approach to disentangle the impact of spatial and other factors, for example environmental, on beta diversity include Duivenvoorden et al. (2002), Tuomisto et al. (2003), Cleary et al. (2004), Jones et al. (2006) and Lichstein (2007). More recent microbiome studies, which have used MRM to study beta diversity, include Chen et al. (2020), Díez-Vives et al. (2020), Hou et al. (2020), Locey et al. (2020) and Wang et al. (2020).
3 RESULTS
Results of the phylogenetic analysis are presented in Figure 3 with six well-supported clusters (bootstrap values >90%) evident, namely cluster 1, consisting of Cinachyrella spB from Berau and Papua, Cinachyrella spT from Rodrigues, Cinachyrella spX from Saudi Arabia and the specimens of unknown origin from Burgers' Zoo; cluster 2, consisting of C. alloclada; cluster 3, consisting of Cinachyrella spA and Cinachyrella spN from Taiwan; cluster 4, consisting of P. bacca; cluster 5, consisting of Cinachyrella spY from Saudi Arabia and Cinachyrella spU from Rodrigues; and cluster 6, consisting of C. kuekenthali. These six clusters were included in two well-supported major clusters consisting of specimens from clusters 1, 2 and 3 in one major cluster and specimens from clusters 4, 5 and 6 in the other.
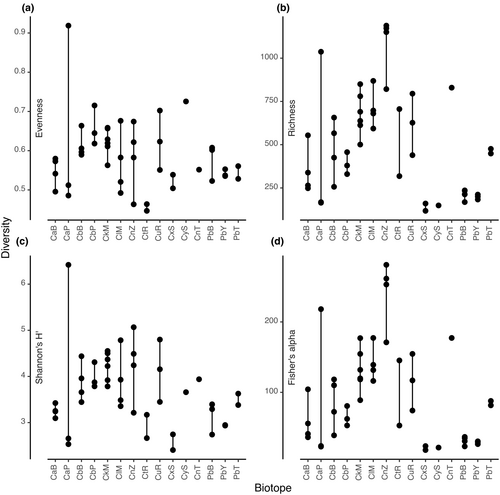
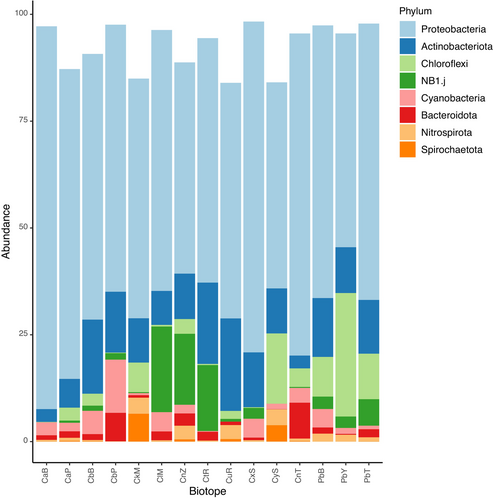
The most abundant higher taxa in the present study were Proteobacteria (6497 OTUs, 2,440,118 sequences), Actinobacteriota (783 OTUs, 453,771 sequences), Chloroflexi (709 OTUs, 236,175 sequences) and NB1-j (492 OTUs, 203,855 sequences). Plots of evenness (Pielou's J), richness, Shannon's H′, and Fisher's alpha diversity indices are shown in Figure 4. The mean relative abundances of the eight most abundant taxa are presented in Figure 5. These taxa accounted for 91.82% of all sequences and 66.74% of all OTUs. Proteobacteria and Actinobacteria were abundant in all groups with the highest abundance of Proteobacteria in Cinachyrella spA from Berau. Of note are the relatively high abundances of Chloroflexi in P. bacca, Cinachyrella spY from Saudi Arabia and C. kuekenthali, and NB1-j in Cinachyrella spZ from Burgers' Zoo, Cinachyrella spT from Rodrigues, and C. alloclada.
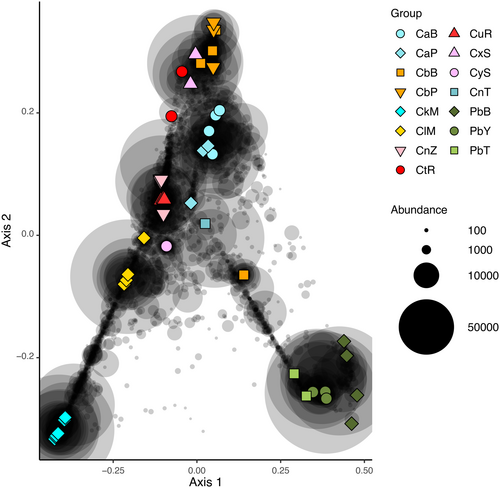
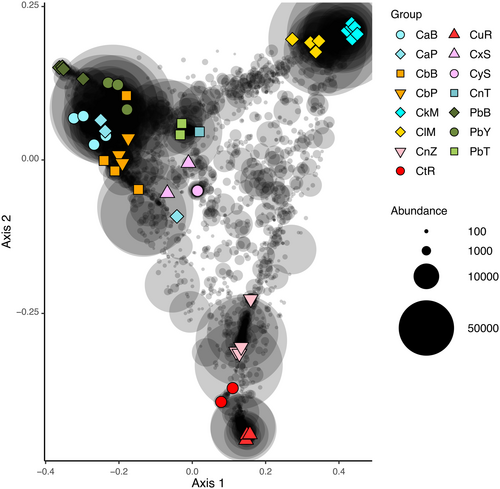
In the PCO analysis of untransformed data (Figure 6), the first axis separated samples of P. bacca from samples of C. kuekenthali. The second axis separated all samples of P. bacca and C. kuekenthali from samples of the remaining (morpho)species. Samples of Cinachyrella spB from Berau and Papua clustered with Cinachyrella spX from Saudi Arabia in line with the phylogenetic analysis of the host sponges. Specimens of Cinachyrella sp. from Burgers Zoo, however, clustered together with samples of Cinachyrella spU from Rodrigues in contrast to the phylogenetic analysis. The single sample of Cinachyrella sp. from Taiwan clustered with Cinachyrella spA in the phylogenetic analysis and the PCO ordination. In the PCO analysis of log-transformed data (Figure 7), the first axis separated samples of Cinachyrella species from Martinique and Rodrigues from the remaining samples. The second axis separated samples of Cinachyrella species from Martinique from samples of Cinachyrella species from Rodrigues. In Figure 7, samples tended to cluster according to geographical proximity (e.g. C. kuekenthali and C. alloclada from Martinique, and Cinachyrella SpT and spU from Rodrigues), in contrast to the results presented in Figure 6.
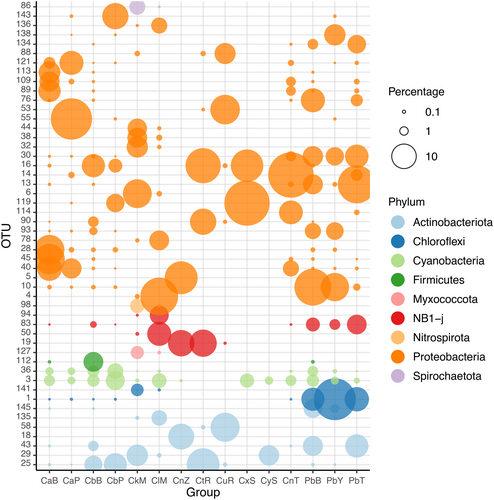
The 50 most abundant OTUs are presented in Figure 8 and listed in Data S3. Of these, the most frequent families were the Nitrosococcaceae (9), Rhodobacteraceae (7), EC94 (7), NB1-j (4) and Microtrichaceae (4). Most (41 of 50) of these abundant OTUs were related to microorganisms previously obtained from a range of sponge species, including Amphimedon queenslandica, Ancorina alata, Astrosclera willeyana, Cinachyra sp., Coelocarteria singaporensis, Corallistes sp., Cymbastella coralliophila, Holoxea sp., Ircinia variabilis, Isops phlegraei, Vaceletia crypta and Xestospongia muta (Data S3). Furthermore, 19 of the 50 OTUs had very high (>99%) sequence similarities to sequences in GenBank, while 5 had relatively low (<93%) sequence similarities. Of these, one (OTU-14) was most dominant in Cinachyrella sp. from Taiwan, one (OTU-113) in Cinachyrella spB, one (OTU-136) in C. alloclada, and two (OTUs 76 and 138) in P. bacca. The OTUs shown in Figure 8 also revealed pronounced enrichment in particular host species. OTU-1, for example, was most abundant in samples of P. bacca and was closely related (sequence similarity >99%) to an organism obtained from a sponge identified as Cinachyra sp. from the Great Barrier Reef (Data S3). The most abundant OTU in C. kuekenthali, OTU-6, was also closely related (sequence similarity = 100%) to an organism obtained from a sponge identified as Cinachyra sp. from the Gulf of Mannar, India. The most abundant OTU in C. alloclada (OTU-4) had 96% similarity to an organism obtained from a sponge identified as Coelocarteria singaporensis. OTU-16 was the most abundant OTU in Cinachyrella spB from Berau, Cinachyrella spT from Rodrigues and Cinachyrella spX (CxS) from Saudi Arabia, all of which clustered together in the phylogenetic analysis (Figure 3). It had 97% similarity to an organism obtained from a sponge identified as Ircinia variabilis (Data S3).
There were highly significant associations of space (MRM: Untransformed: F = 93.34, R2 = .199, p < .001; Log-transformed: F = 343.69, R2 = .478, p < .001), host dissimilitude (MRM: Untransformed: F = 87.34, R2 = .189, p < .001; Log-transformed: F = 87.34, R2 = .189, p < .001), environment (MRM: Untransformed: F = 23.23, R2 = .058, p < .001; Log-transformed: F = 73.73, R2 = .164, p < .001), and the full model, which included all of the previous three predictors (Full additive MRM model: Untransformed: F = 127.11, R2 = .505, p < .001; Log-transformed: F = 179.28, R2 = .590, p < .001) with prokaryotic dissimilarity. The relationships of prokaryotic dissimilarity with space (geographic distance) and host dissimilitude are presented in Figure 9 (untransformed data) and 10 (log-transformed data). Histograms of Bray–Curtis dissimilarities exhibited pronounced left-skewed distributions for both untransformed and log-transformed data (Figures 9c and 10c). The masses of dissimilarities were thus concentrated at high values with a long tail of lower dissimilarities.
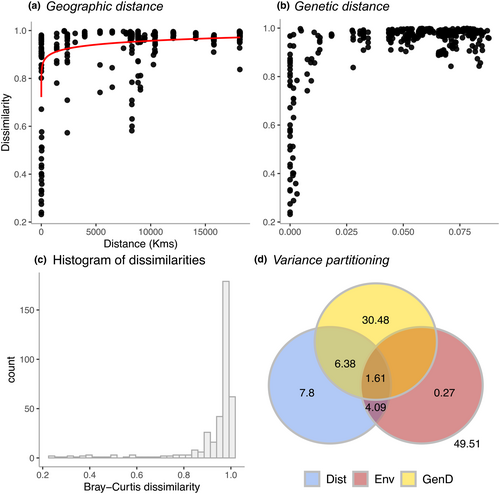
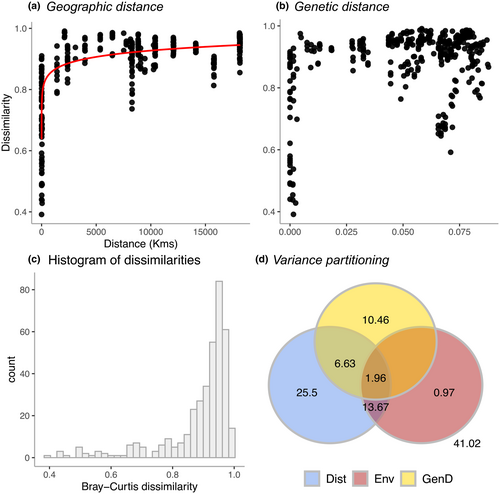
For the untransformed data, space, host dissimilitude, and environment explained >50% of the variation in Bray–Curtis dissimilarity (Figure 9d). The purely spatial component (geographic distance alone) explained 7.8%, the purely host dissimilitude component 30.48%, and the purely environmental component 0.27% of the variation in composition. The union of all three components (space, host dissimilitude, and environment) explained a further 1.61% of the variation in dissimilarity while the union of space and host dissimilitude explained an additional 6.38% and environment and space an additional 4.09%. For the log-transformed data, the purely spatial component explained 25.5%, the purely host dissimilitude component 10.46%, and the purely environmental component 0.97% of the variation in dissimilarity. The union of all three components explained a further 1.96% of variation in dissimilarity while the union of space and host dissimilitude explained an additional 6.63% and environment and space an additional 13.67%.
4 DISCUSSION
Golf ball sponges are small, morphologically similar, and difficult to identify to species level in the field. They are present across a range of habitat types, including reef flats, mangroves and perturbed reef areas and are often covered with sediment making it, sometimes, difficult to distinguish them from the surrounding environment. They are also present across a very large spatial range, including Indo-Pacific, Caribbean, and Antarctic waters (Carella et al., 2016).
4.1 Dominant prokaryotic taxa inhabiting golf ball sponges
Several bacterial taxa were well represented in the list of most abundant OTUs including OTUs classified as belonging to the Rhodobacteraceae, Nitrosococcaceae, NB1-j, EC94, and Microtrichaceae families. Rhodobacteraceae are a major component of marine ecosystems, where they can be found in the bacterioplankton and as symbionts of multicellular organisms (Dogs et al., 2017; Elifantz et al., 2013; Simon et al., 2017).
Abundant Nitrosococcaceae OTUs, most of which were classified to the genus AqS1, were observed in C. kuekenthali, Cinachyrella spA, Cinachyrella spB, Cinachyrella spT, Cinachyrella spU from Rodrigues, and Cinachyrella spX from Saudi Arabia. Nitrosococcaceae is a family of ammonia-oxidising bacteria within the Gammaproteobacteria. A draft genome of AqS1 was previously identified from the sponge Amphimedon queenslandica and indicated that it was capable of sulphur oxidation, carbon monoxide oxidation, and inorganic phosphate assimilation (Gauthier et al., 2016). In particular, the AqS1 genome was shown to encode for a Sox enzyme complex involved in the oxidation of reduced sulphur compounds in addition to a reverse dissimilatory sulphate reduction pathway. AqS1 has also been shown to be enriched in ankyrin repeat-containing proteins. These are putatively used to promote host-microbe interactions and facilitate a symbiotic lifestyle, for example, by inhibiting eukaryotic phagocytosis. In addition to ankyrin repeats, tetratricopeptide repeats, leucine-rich repeats, fibronectin domain IIIs, and cadherins putatively fulfill similar functions (references in Gauthier et al., 2016).
Abundant members of the EC94 clade were observed in Cinachyrella spA, C. alloclada, and P. bacca. Taylor et al. (2021) included the EC94 clade in their novel proposed order Tethybacterales and noted that its members were associated with sponges suggesting a symbiotic relationship with sponge hosts. As with AqS1, the genomes of Ca. Tethybacterales members were enriched with ankyrin repeat proteins highlighting their potential symbiotic nature. In addition to this, Ca. Tethybacterales genomes contained genes for lipoprotein release via the ABC-2 transporter LolABCDE complex, which have been reported to play roles in bacterial colonisation, host defence evasion, and immunomodulation (Taylor et al., 2021).
Abundant NB1-j members were observed in Cinachyrella alloclada, Cinachyrella sp. from Burgers Zoo, Cinachyrella spT from Rodrigues, and P. bacca. Relatively little is known about the NB1-j clade. It was previously identified as a dominant member of the alfalfa rhisosphere (Zhu et al., 2022), saltmarsh sediment (Cleary et al., 2016), and the microbiomes of the LMA sponge species Stylissa carteri and S. massa (Cleary et al., 2015).
Abundant Microtrichaceae members, most of which belonged to the Sva0996 marine group, were observed in C. kuekenthali, Cinachyrella spY (CyS) from the Red Sea, Cinachyrella spU from Rodrigues, and P. bacca. Relatively little is known about the Sva0996 marine group, but members have been reported to be involved in nitrogen cycling and assimilation of dissolved protein (Orsi et al., 2016). Sva0996 was also reported to be an abundant component of the microbiomes of the brown alga Laminaria digitata (Ihua et al., 2020), and the carnivorous sponge Chondrocladia grandis (Verhoeven et al., 2016).
In addition to the above-mentioned taxa, certain host sponges were enriched with abundant Chloroflexi members, mostly belonging to the SAR202 clade, including Cinachyrella kuekenthali (OTU-141), Cinachyrella spY from Saudi Arabia (OTU-427), and P. bacca (OTU-1). OTU-1 was, furthermore, the most abundant OTU overall. Previous studies have suggested that SAR202 members play a role in the degradation of recalcitrant dissolved organic matter such as humic substances (Colatriano et al., 2018; Landry et al., 2017). Importantly, P. bacca and other Paratetilla species are often found in coastal areas, in proximity to riverine outflow. They also appear to tolerate high sediment loads and are often covered with sediment (pers. obs. both authors).
4.2 Role of space, host dissimilitude and environment in structuring prokaryotic communities inhabiting golf ball sponges
The sponge taxa (clusters) identified using the phylogenetic analysis housed compositionally distinct prokaryotic communities. The samples from Burgers' Zoo, the Netherlands, however, proved to be an exception. They all belonged to the cluster, including Cinachyrella spB, but housed prokaryotic communities compositionally similar to samples of Cinachyrella spU from Rodrigues. It is unclear why this should be the case. It is noteworthy that the Cinachyrella specimens from Burgers' Zoo maintained a prokaryotic community similar to wild specimens, but living in an artificial environment probably had an impact on their microbiomes.
Prokaryotic dissimilarity varied as a function of geographic distance and host dissimilitude with the most pronounced shifts in dissimilarity at the smallest spatial scales and degree of host dissimilitude. There was, furthermore, considerable variation at the smallest scales with dissimilarity ranging from 0.2 (0.4 for log-transformed data) to >0.9 as shown in Figures 9 and 10. The purely spatial component (space alone) varied from 7.8% for untransformed data to 25.5% for log-transformed data. In the barrel sponge species complex (Xestospongia spp.), the purely spatial component explained 39% of total variation (Cleary et al., 2022). The importance of space in structuring microbial communities in general, and host-associated microbial communities in particular, aligns with recent microbial studies (Hanson et al., 2012 and references therein; Chen et al., 2020; Clark et al., 2021; Díez-Vives et al., 2020; Hou et al., 2020; Locey et al., 2020; Wang et al., 2020) and earlier studies of multicellular communities of organisms (Cleary et al., 2004, 2005, 2008; Condit et al., 2002; Nekola & White, 1999; Tuomisto et al., 2003). The importance of space has been attributed to dispersal limitation, which may be intrinsic and depend on dispersal ability or due to the habitat configuration. Microorganisms, which strictly depend on host sponges for their survival, for example, may vary in their ability to disperse depending on host density. This will probably be less important in the cases where the microorganisms are horizontally derived from the ‘rare biosphere’ (Pascoal et al., 2021). In addition to this, other factors such as mass and founder (initial colonisers) effects may influence the spatial structure of host-associated microbial communities (Guélat et al., 2008; Leibold et al., 2004; Maas et al., 2018). The importance of space in structuring microbial communities may, thus, be related to a range of disparate processes including intrinsic limitations of the organisms in question and processes collectively known as historical processes (Hanson et al., 2012).
The variation explained by host dissimilitude alone varied from 10.46% for log-transformed data to 30.48% for untransformed data. In barrel sponges (Xestospongia spp.), this component explained 3% of the variation in prokaryotic composition using log-transformed data (Cleary et al., 2022). There did, however, appear to be scale dependence in Xestospongia spp. where host dissimilitude explained >24% of variation at a single location (Cleary et al., 2022). Our results suggest an interplay between space and host dissimilitude with much lower mean dissimilarities at smaller scales, but with considerable variation. Taken together, space and host dissimilitude explained >50% of the variation in the prokaryotic communities of golf ball sponges.
The relative importance of space versus host dissimilitude, however, shifted depending on whether the response matrix of prokaryotic dissimilarity was untransformed or log-transformed. Host dissimilitude was a more important explanatory factor for untransformed data. This suggests that host dissimilitude plays a more important role for more abundant prokaryotic taxa, whereas space is more important for less abundant taxa. We attribute this to the tendency of closely related host taxa to share abundant symbionts across large spatial scales. Distantly sampled specimens, in contrast, housed less abundant prokaryotic taxa reflective of their distant environments, thus increasing the importance of spatial distance when using log-transformed data, which scales down the effect of abundant taxa. This effect is highlighted by the spatially structured environmental component, which was more important for log-transformed (13.67%) than untransformed data (4.09%).
Previous studies have identified genetic dissimilarity among hosts (host dissimilitude) as a significant determinant of microbiome beta diversity across a wide range of host taxa including mice, humans, black soldier flies, plants, oysters, and sponges (Bonder et al., 2016; Easson et al., 2020; Greenwood et al., 2021; Griffiths et al., 2019; Wegner et al., 2013; Zhang et al., 2023). Sponge studies have also shown that host identity is one of the most important determinants of microbiome variation (Cleary et al., 2019, 2020, 2021; Thomas et al., 2016). Thomas et al. (2016), however, noted that sponge phylogeny only explained a minor amount of the variation in dissimilarity of sponge-associated prokaryotic communities.
In contrast to space and host dissimilitude, the purely environmental component only explained a very small amount of variation in composition, 0.3%. Almost 40%–50% of the variation in dissimilarity also remained unexplained. The unexplained variation may be attributable to stochastic processes, historical factors such as past perturbations or unmeasured environmental variables. Potentially important environmental factors that should be considered in future studies include pH, nutrient concentrations, sediment load and the concentration and composition of dissolved organic matter in addition to others. Future research should attempt to ascertain to what extent these and other environmental parameters may be important in structuring prokaryotic community composition in golf ball sponges.
In summary, the present study points to an important role of space and host dissimilitude in structuring prokaryotic communities of golf ball sponges. Our study, however, has considerable limitations due to the small sample size. That being said, the results largely align with a previous study of the sponge species complex Xestospongia spp. sampled over a similarly large spatial scale encompassing IndoPacific and Caribbean sites (Cleary et al., 2022). Future studies of other sponge species complexes should help to shed greater light on the importance of space, host dissimilitude and environment in structuring prokaryotic communities.
5 CONCLUSION
In the present study, we identified putative host sponge taxa using a phylogenetic analysis of the 28S rRNA gene and dominant prokaryotic taxa associated with these host sponges. The most abundant OTUs were classified to a range of taxa including the AqS1 and EC94 groups, which have been shown to carry genes that are known to promote host–microbe interactions. In addition to the above, certain sponge hosts were enriched in OTUs classified to the SAR202 clade of Chloroflexi. We, furthermore, showed that prokaryotic dissimilarity was significantly structured by space and host dissimilitude.
ACKNOWLEDGEMENTS
This work is part of the research programme NWO-VIDI with project number 16.161.301 by the Netherlands Organization for Scientific Research (NWO). This work was also supported by European Funds through COMPETE [FCOMP-01-0124-FEDER-008657] and by National Funds through the Portuguese Foundation for Science and Technology (FCT) within the LESS CORAL [PTDC/AAC-AMB/115304/2009] project. Thanks are due for financial support to CESAM (UID/AMB/50017-POCI-01-0145-FEDER-007638), to FCT/MCTES through national funds (PIDDAC) and co-funding by FEDER, within the PT2020 Partnership Agreement and Compete 2020. We would also like to acknowledge Yusheng Huang, Kate Liao, and Lisa Becking.
CONFLICT OF INTEREST STATEMENT
The authors declare that they have no conflicts of interest.
Open Research
DATA AVAILABILITY STATEMENT
The DNA sequences generated in this study can be downloaded from NCBI BioProject Ids: PRJNA382576, PRJNA479568, PRJNA715755, PRJNA715750, and PRJNA715763.


