Environmental-driven dynamics of phytoplankton assemblages in the Bay of Bengal, Southeast coast of India
Abstract
A study conducted from January to December 2018 examined seasonal variations in horizontal phytoplankton communities. A total of 93 species were identified, including 63 Coscinodiscophyceae, 4 Fragilariophyceae, 7 Bacillariophyceae, 15 Dinophyceae, and 4 Cyanophyceae. The highest species diversity and abundance occurred during the postmonsoon and premonsoon periods. Environmental parameters (viz., temperature, salinity, dissolved oxygen, pH, ammonia, nitrite, silicate, total suspended solids) were all statistically significant except for nitrite (p > .05). Multivariate statistical analyses (PCA and CCA) revealed that in the postmonsoon period, silicate and nitrate were responsible for the proliferation of phytoplankton abundance, species composition and density, while in the premonsoon period, temperature, salinity, and pH significantly influenced and favored specific phytoplankton groups (such as Chaetocerotaceae) in terms of species composition and abundance.
1 INTRODUCTION
The Bay of Bengal (BOB) encompasses the northeast region of the Indian Ocean, stretching across a distance of 2500 km between 22° N and the equator, enclosing the Andaman and Nicobar Islands. Due to semiannual reversing monsoon winds (Shetye et al., 1991), it experiences changes in seasonal circulation pattern. Every year, a large amount of freshwater (ca. 1.6 × 10¹² m3 year−1) is discharged into the Bay, causing lower surface salinities over a large area. As a result, surplus precipitation, river runoff, and excessive evaporation create regions of lesser salinity and highly stratified upper layers (Gomes et al., 2000; Prasanna Kumar et al., 2002), which affect biological organisms and biogeochemical processes (Ittekkot et al., 1991). Coastal areas are generally affected by a multitude of physical, chemical, and biological processes. A key part of determining the quality of coastal waters is to study phytoplankton diversity and abundance, as it reflects the productive and regenerative status (Legendre & Le Fèvre, 1991; Malone, 1980) of the marine environment. Phytoplankton is a key component of the marine ecosystem because it responds quickly to changes in water quality caused by local or global factors (Wetzel, 2001). In the ocean phytoplankton usually consist of multiple taxonomic groups, and they contribute to primary production and tropic-level interactions (Roy et al., 2006). Phytoplankton, as a primary producer, contributes significantly to the global net primary productivity, carbon fluxes, biogeochemical cycles, and Ocean–atmosphere interactions (Bauer et al., 2013; Litchman et al., 2015; Tweddle et al., 2018). In addition to serving as a primary producer, free-living phytoplankton acts as a source of food and energy for planktivorous species and plays a crucial role in determining the fisheries potential (Falkowski et al., 1998). The distribution of phytoplankton community exhibits significant geographic and temporal fluctuations due to the complex interplay of physical, chemical, and biological processes. These dynamics influence variations in phytoplankton community structure and biomass over time (Elliott et al., 2002; Grenz et al., 2000). Phytoplankton, as a sensitive indicator, exhibits rapid responses to changes in slight variations in environmental parameters, due to this they are extensively used in ecosystem assessment studies (Lomartire et al., 2021; Racault et al., 2017).
Coastal ecosystems are highly productive and serve as vital nursery habitats to key fisheries species (Nagelkerken et al., 2015). Compared to oceanic water, coastal water is typically dominated by microphytoplankton due to their competitive advantage in fluctuating nutrient-rich environments (Malone, 1980). Therefore, changes in phytoplankton size structure can serve as indicators of their responses to environmental perturbations, with implications for ecosystem function and health. Assessing phytoplankton dynamics along with their seasonal patterns aids in understanding the quality of coastal waters (Hulyal & Kaliwal, 2009), as many phytoplankton species serve as bioindicators (Bianchi et al., 2003; Hoch et al., 2008; Tiwari & Chauhan, 2006; Vareethiah & Haniffa, 1998). Consequently, monitoring variations in phytoplankton communities concerning seasonal patterns provides a valuable tool for comprehending water pollution and ecosystem ecology. Thus, the present study aims to elucidate the current status of phytoplankton abundance and diversity in relation to physicochemical parameters.
2 MATERIALS AND METHODS
2.1 Sampling sites
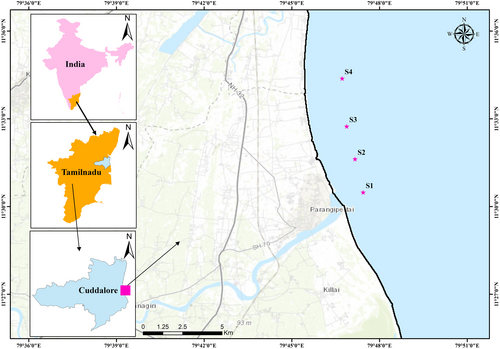
Four stations were chosen horizontally from Parangipettai Shore (mouth Vellar estuary) to the North of Samiyarpettai located on the southern and eastern coast of the Bay of Bengal, Tamil Nadu (Station 1 through Station 4) (Figure 1). The distance between each sampling station is 2.5 Km.
2.2 Analysis of physicochemical parameters
Water samples were collected on a monthly basis from January 2018 to December 2018 during dawn to investigate seasonal variation. The study period was divided into four seasons, viz., postmonsoon (POM) (January–March), summer (April–June) (SUM), premonsoon (PRM) (July–September), and monsoon (MON) (October–December) (Mahesh et al., 2015). Water samples were collected using 1-L polyethylene bottle for the analysis of nutrients and chlorophyll-a (1 L) by using Niskin water sampler. Collected samples were filtered through Whatman GF/C filters for further analyses. Parameters such as temperature, pH, and salinity were measured immediately after collection using multistem digital thermometer (accuracy ±0.1), hand refractometer (ATAGO S/Mill-E), and pH pen, respectively. Dissolved oxygen (DO) was estimated by Winkler titration method. Environmental parameters such as nitrite (NO2), nitrate (NO3), ammonia (NH4), inorganic phosphate (PO4), total suspended solids (TSS), and reactive silicate (SiO4) were analyzed by following Strickland and Parsons (1972). Chlorophyll-a concentration was analyzed following pigment extraction method (Strickland & Parson, 1972). Extracted samples were stored in dark condition in a refrigerator for incubation. After incubation, chlorophyll-a concentration was analyzed via UV–VIS spectrophotometer (Shimadzu-UV).
2.3 Phytoplankton analysis
Phytoplankton samples were obtained on a monthly scale from the surface water by towing a plankton net (mesh aperture size: 48 μm) made of bolting silk cloth (1.5 m) for 15 min. Flow meter was fixed on the center of the net to estimate the volume of water passed. The samples were fixed with 4% buffered formalin for qualitative and quantitative analyses. Quantification and identification of phytoplankton were performed using an inverted microscope, and a Sedgwick rafter chamber was used to count the cell density. For taxonomic identification of phytoplankton, standard identification manuals were followed (Al-Kandari et al., 2009; Deboyd et al., 1977; Perumal et al., 1998; Santhanam, 1987; Subrahmanyan, 1946; Taylor, 1976; Venkataraman, 1939). The phytoplankton samples were sorted and grouped into three major groups: diatoms, dinoflagellates, and blue green algae.
2.4 Data preparation and statistical analyses
Physicochemical and phytoplankton data collected from four stations were pooled together to obtain the mean value for all seasons. Analysis of variance (ANOVA) was conducted to estimate the seasonal variation using post hoc (Tukey) method. Correlation coefficients were calculated between physicochemical variables and phytoplankton groups, namely, Coscinodiscophyceae, Fragilariophyceae, Dinophyceae, and Cyanophyceae.
Multivariate analyses were used to determine the distribution pattern of physicochemical characteristics and their interaction with the phytoplankton population, as they arranged the data by decreasing noise (Gauch, 1982). The principal component analysis (PCA) was employed to find out seasonal distribution pattern of physicochemical variables, and the data were log-transformed before conducting PCA using Euclidean distance matrix. Canonical correspondence analysis (CCA) was used to identify the environmental factors that affect the temporal variation in phytoplankton populations. Species diversity indices were performed to identify seasonal diversity.
All these statistical analyses were performed using R program (v 3.4.0 R Core Team, 2021) using r packages. Vegan: community ecology R package was used to perform the CCA and Shannon diversity indices (Oksanen et al.,, 2015). FactoMineR: An R package for multivariate analysis was used to run the PCA (Le, 2008). All plots were drawn using ggplot-2 package (Wickham, 2016).
3 RESULTS
The seasonal variations in physicochemical parameters observed in the study area are presented in Figures 2 and 3. Table 1 represents the mean seasonal values as well as the standard difference of environmental parameters recorded for all the seasons. The results were represented as a single data set (average of four stations) since there was no significant horizontal variation. The analysis of variance (ANOVA) executed for all the environmental variables was statistically significant (p > .05) among seasons except nitrite.
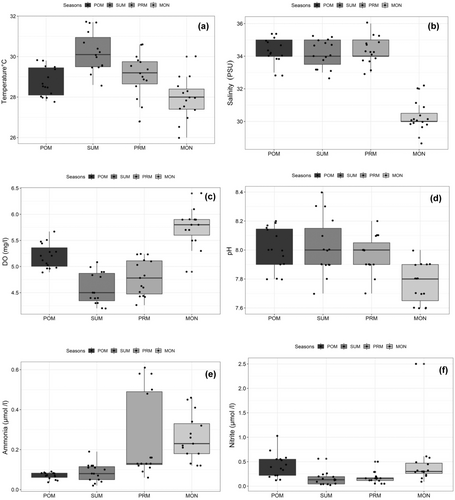
All the environmental variables showed clear seasonal trends, implying the true tropical climate. The seasonal changes in temperature and salinity were observed to be significant (p < .05, F = 15.21; p < .001, F = 90.32) and are shown in Figure 2. Maximum and minimum temperatures were observed during summer and monsoon season and the variations in temperature for four seasons were as follows: POM: 27.80–29.80°C; SUM: 28.60–31.70°C; PRM: 26.80–30.60°C; MON: 26.00–30.00°C. Salinity also showed the highest during summer (35 psu) and minimum in monsoon, and its ranges for the seasons of POM, SUM, PRM, and MON are 33.00–35.00 psu, 33.00–35.00, 33.00–36.00 psu, and 29.00–32.00 psu, respectively Figure 2.
Variations in dissolved oxygen (DO) concentrations among seasons were statistically significant (p < .005, F = 40.73). The DO concentration varied from 4.20 mg L−1 to 6.40 mg L−1, registering the maximum and minimum during monsoon and summer, respectively. The variations in DO content among four seasons observed are as follows: POM: 4.89–5.67 mg L−1; SUM: 4.20–5.08 mg L−1; PRM: 4.26–5.24 mg L−1; MON: 4.90–6.40 mg L−1 (Table 1). pH varied significantly (p < .05) with high values during summer and less in monsoon [7.80–8.20 (POM); 7.70–8.40 (SUM); 7.70–8.20 (PRM), and 6.0–8.00 (MON)].
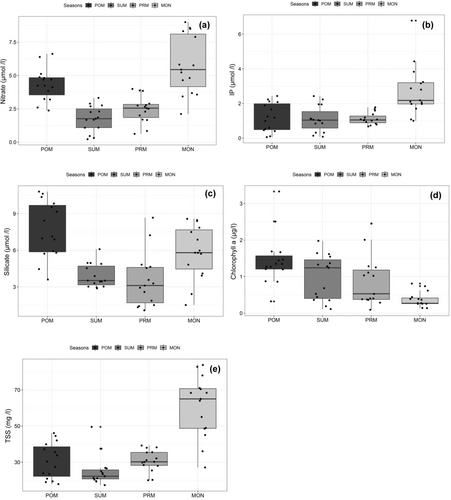
Among inorganic nutrients except for nitrite (p > .05, F = 4.071), remaining nutrients such as ammonia (p < .001, F = 11.36), nitrate (p < .001, F = 24.3), IP (p < .001, F = 11.11), and silicate (p < .001, F = 14.02) showed apparent seasonal trend with higher significance. Ammonia and nitrate ranged from 0.02–0.61 μmol L−1 to 0.22–9.00 μmol L−1, respectively (Figure 3). Maximum ammonia and nitrate values recorded were in premonsoon and monsoon seasons while the minimum was noted during postmonsoon and summer seasons (Table 1). The changes in seasonal IP concentration were as follows 0.06–2.43 μmol L−1 (POM), 0.08–2.43 μmol L−1 (SUM), 0.67–1.78 μmol L−1 (PRM), and 1.00–6.78 μmol L−1 (MON). Among seasons, IP concentration reached peak values during monsoon and declined during postmonsoon season.
Silicate concentrations were considerably higher than other inorganic nutrients and ranged from 1.07 to 10.81 mol L−1. It varied significantly (p < .05; F = 14.02) and exhibited increasing pattern from monsoon to postmonsoon. Total suspended solids (TSS) did show a clear seasonal trend with the highest (83.80 mg L−1) being registered in monsoon, while the minimum (27.08 mg L−1) in summer (Figure 3). TSS exhibited significant variation between season (p < .001, F = 32.55) and differed among seasons [17.85–46.09 mg L−1 (POM), 17.28–49.54 mg L−1 (SUM), 20.00–39.20 mg L−1 (PRM), and 27.07–83.80 mg L−1 (MON)].
A pairwise comparison conducted using the Tukey's post hoc method revealed significant variations in variables such as salinity, ammonia, nitrate, chlorophyll-a, and TSS between the PRM and MON seasons. Additionally, salinity, nitrate, IP, and silicate varied significantly between the SUM and MON seasons.
3.1 Chlorophyll-a
Chlorophyll-a showed a remarkable seasonal pattern with high significance (p < .005, F = 8.536) (Figure 3). The variations in chlorophyll-a concentration among different seasons studied are as follows: POM: 0.32–3.33 μg L−1; SUM: 0.11–1.98 μg L−1; PRM: 0.09–2.45 μg L−1; MON: 0.14–0.81 μg L−1 (Table 1). The highest chlorophyll-a was found in postmonsoon and summer, while the minimum was recorded in monsoon.
3.2 Seasonal relationship of physicochemical parameters
PCA was conducted on normalized data set (log 10), for better interpretation PC components more than 1 was considered. PCA explained 65% of cumulative variance in three components, of which dimensions 1 and 2 exhibited 39.7% and 15.1% variance, respectively. The ordination of the variables against the components is presented in Figure 4. PCA graph plotted with dimensions 1 and 2 loadings showed the relationship between environmental variables and seasons by forming specific cluster group with specific season.
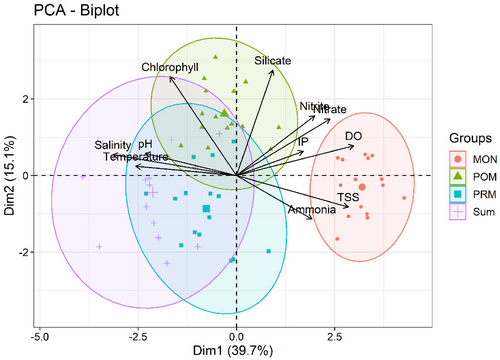
Distinct cluster group formation was observed across different seasons, with temperature (0.48) and salinity (0.7) showing strong positive association with SUM and PRM seasons in dimension 1, while exhibiting negative relationship with MON. Conversely, DO (0.85), ammonia (0.52), and TSS (0.77) formed a cluster group during MON season, implying a significant positive relationship and suggesting the influence of rainfall. Similarly, chlorophyll-a (0.70) and silicate (0.74) had significant positive loadings in dimension 2 and contributed notably to POM season with the values of 29.5 and 33.58, respectively, in PCA. This indicates the favorable environmental condition conducive to increased phytoplankton abundance as they grow in a rich silicate and phosphate environment. Nitrite, nitrate, and IP expressed significant positive relationship in both dimensions 1 and 2, forming near cluster formation with MON season, with high contribution values of 10.82, 9.69, and 4.91, respectively.
3.3 Seasonal variability in phytoplankton species composition and density
Altogether 93 species of phytoplankton were identified from four seasons. Out of 93 species, 63, 4, 7, 15, and 4 belong to diatoms (Coscinodiscophyceae), fragilarians (Fragilariophyceae), Bacillariophyceae, dinoflagellates (Dinophyceae), and cyanobacteria (Cyanophyceae), respectively. The highest number of phytoplankton species were recorded in POM followed by PRM and SUM (Table 2).
| Parameters | POM | SUM | PRM | MON | ||||
|---|---|---|---|---|---|---|---|---|
| Mean | Range | Mean | Range | Mean | Range | Mean | Range | |
| Temperature | 28.75 ± 0.70 | 27.80–29.80 | 30.23 ± 0.99 | 28.60–31.70 | 29.08 ± 1.08 | 26.80–30.60 | 27.91 ± 1.02 | 26–30 |
| Salinity | 34.27 ± 0.70 | 33–35 | 34.20 ± 0.86 | 33–35 | 34.33 ± 0.82 | 33–36 | 30.33 ± 0.82 | 29–32 |
| DO | 5.21 ± 0.24 | 4.89–5.67 | 4.58 ± 0.30 | 4.20–5.08 | 4.79 ± 0.34 | 4.26–5.24 | 5.75 ± 0.35 | 4.90–6.40 |
| Ammonia | 0.07 ± 0.02 | 0.04–0.09 | 0.09 ± 0.04 | 0.02–0.19 | 0.26 ± 0.21 | 0.06–0.61 | 0.26 ± 0.11 | 0.12–0.46 |
| Nitrite | 0.42 ± 0.25 | 0.12–1.03 | 0.15 ± 0.14 | 0.02–0.56 | 0.16 ± 0.11 | 0.05–0.50 | 0.48 ± 0.58 | 0.09–2.50 |
| Nitrate | 4.34 ± 1.21 | 2.37–6.62 | 1.76 ± 0.97 | 0.22–3.32 | 2.46 ± 1.01 | 0.62–3.99 | 5.78 ± 2.19 | 2.11–9.00 |
| IP | 1.20 ± 0.82 | 0.06–2.43 | 1.10 ± 0.75 | 0.08–2.43 | 1.12 ± 0.34 | 0.67–1.78 | 2.75 ± 1.46 | 1.00–6.78 |
| Silicate | 7.69 ± 2.32 | 3.60–10.81 | 3.89 ± 0.96 | 2.88–6.09 | 3.50 ± 2.20 | 1.07–8.67 | 5.85 ± 2.19 | 1.51–8.57 |
| pH | 8.01 ± 0.14 | 7.80–8.20 | 8.02 ± 0.20 | 7.70–8.40 | 7.97 ± 0.13 | 7.70–8.20 | 7.77 ± 0.13 | 7.60–8.00 |
| Chlorophyll | 1.45 ± 0.70 | 0.32–3.33 | 0.98 ± 0.62 | 0.11–1.98 | 0.86 ± 0.68 | 0.09–2.45 | 0.37 ± 0.20 | 0.14–0.81 |
| TSS | 30.73 ± 9.84 | 17.85–46.09 | 25.06 ± 8.26 | 17.28–49.54 | 30.77 ± 5.95 | 20–39.20 | 60.82 ± 16.85 | 27.07–83.80 |
| S. No | Species list | Postmonsoon | Summer | Premonsoon | Monsoon |
|---|---|---|---|---|---|
| Coscinodiscophyceae | |||||
| 1 | Bacteriastrum delicatulum | + | +++ | +++ | ++ |
| 2 | B. hyalinum | +++ | + | ++ | + |
| 3 | B. varians | + | +++ | +++ | + |
| 4 | Bellerochea malleus | + | + | + | − |
| 5 | Biddulphia sp. | ++ | + | ++ | + |
| 6 | Chaetoceros affinis | ++ | ++ | + | ++ |
| 7 | C. atlanticus | +++ | + | +++ | − |
| 8 | C. curvisetum | + | ++ | +++ | ++ |
| 9 | C. decipiens | ++ | ++ | + | ++ |
| 10 | C. diversus | ++ | ++ | ++ | + |
| 11 | C. compressus | +++ | +++ | +++ | ++ |
| 12 | Coscinodiscus asteromphalus | − | ++ | ++ | − |
| 13 | C. centralis | − | ++ | + | − |
| 14 | C. coarctatus | ++ | ++ | ++ | + |
| 15 | C. excentricus | − | − | ++ | ++ |
| 16 | C. gigas | + | + | + | − |
| 17 | C. indicus | − | + | ++ | ++ |
| 18 | C. lineatus | ++ | ++ | + | + |
| 19 | C. marginatus | + | ++ | ++ | − |
| 20 | C. oculus-iridis | − | − | + | + |
| 21 | C. costatus | + | + | + | + |
| 22 | C. radiatus | − | + | ++ | + |
| 23 | C. granii | + | + | + | + |
| 24 | Cylindrotheca sp | + | − | + | − |
| 25 | Ditylum brightwellii | + | + | + | + |
| 26 | Eucampia zodiacus | ++ | ++ | ++ | + |
| 27 | Climacodium sp. | − | + | + | − |
| 28 | Guinardia delicatula | + | + | + | + |
| 29 | G. flaccida | − | ++ | ++ | − |
| 30 | G. striata | + | + | + | + |
| 31 | Hemidiscus hardmanianus | ++ | ++ | ++ | − |
| 32 | Helicotheca thamensis | + | ++ | + | + |
| 33 | Hemiaulus sp. | + | ++ | + | ++ |
| 34 | Hemiaulus sinensis | +++ | ++ | + | ++ |
| 35 | Isthmia sp. | ++ | + | ++ | + |
| 36 | Leptocylindrus danicus | − | − | ++ | − |
| 37 | Licmophora sp. | − | + | + | − |
| 38 | Melosira sp. | − | + | + | − |
| 39 | Odontella aurita | + | + | − | − |
| 41 | O. mobiliensis | + | ++ | ++ | ++ |
| 42 | O. sinensis | − | − | − | + |
| 43 | Palmeria hardmaniana | − | − | + | − |
| 44 | Proboscia alata | − | + | ++ | ++ |
| 45 | Rhizosolenia setigera | + | + | ++ | + |
| 46 | R. styliformis | + | + | + | − |
| 47 | R. imbricata | − | + | ++ | + |
| 48 | R. robusta | + | − | ++ | − |
| 49 | R. shrubsolei | ++ | + | ++ | − |
| 50 | Rhizosolenia sp. | + | + | + | − |
| 51 | Skeletonema costatum | +++ | +++ | +++ | + |
| 52 | Stephanopyxis palmeriana | + | − | ++ | − |
| 53 | Streptotheca sp. | + | + | + | + |
| 54 | Triceratium sp. | + | ++ | − | − |
| 55 | Thalassiosira subtilis | − | − | ++ | − |
| Fragilariophyceae | |||||
| 56 | Asterionellopsis glacialis | − | − | +++ | +++ |
| 57 | A. japonica | +++ | +++ | +++ | +++ |
| 58 | Thalassionema sp. | + | + | + | − |
| 59 | T. nitzschioides | + | + | ++ | ++ |
| Bacillariophyceae | |||||
| 60 | Gyrosigma balticum | + | − | ++ | + |
| 61 | Nitzschia sp. | − | − | ++ | ++ |
| 62 | Pleurosigma elongatum | + | + | − | − |
| 63 | Pleurosigma sp. | + | + | − | |
| Dinophyceae | |||||
| 64 | Ceratium breve | − | + | − | − |
| 65 | C. furca | ++ | ++ | ++ | − |
| 66 | C. fusus | + | ++ | ++ | + |
| 67 | C. trichoceros | ++ | − | + | + |
| 68 | C. tripos | ++ | ++ | ++ | + |
| 69 | C. massiliense | − | − | ++ | + |
| 70 | Dinophysis sp. | ++ | − | ++ | + |
| 71 | D. tripos | ++ | + | ++ | − |
| 72 | D. caudata | +++ | + | ++ | + |
| 73 | Ornithocercus magnificus | + | − | − | + |
| 74 | Protoperidinium. crassipes | + | − | + | + |
| 75 | P. elegans | ++ | − | + | + |
| 76 | Protoperidinium sp. | − | − | + | − |
| Cyanophyceae | |||||
| 77 | Chroococcus indicus | +++ | ++ | + | + |
| 78 | C. lunula | + | − | − | − |
| 79 | Oscillatoria limosa | + | − | − | + |
| 80 | Trichodesmium erythraeum | − | ++ | − | − |
- Note: + Present, − absent, ++ dominant, +++ Predominant.
The phytoplankton population density showed significant variation between groups (p < .005; F = 26.62). However, no seasonal variation in total phytoplankton density (p < .0234; F = 5.562) was observed. The seasonal variation in phytoplankton density was recorded as 8.9 × 10²–16.6 × 10³ cell L−1 for POM, 3065–12.4 × 10³ cells L−1 for SUM, 1120–16.1 × 10³ cells L−1 for PRM, and 3377–4.2 × 10³ cells L−1 for MON, respectively (Figure 5). Among the four seasons, Coscinodiscophyceae and Dinophyceae showed the highest population density during POM followed by PRM and SUM. Cyanophyceae and Fragilariophyceae registered less population density as compared to other groups.
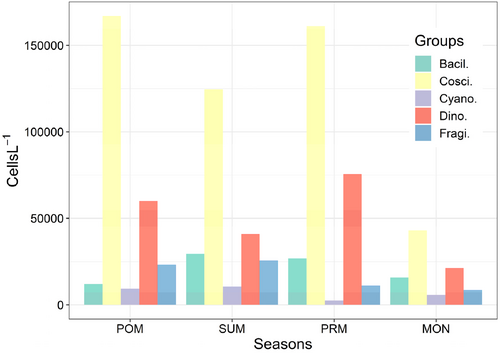
The registered high population density during POM and PRM was due to the high abundance observed from the following individual phytoplankton species. Bacteriastrum delicatulum, B. hyalinum, B. varians, B. obtuse, Chaetoceros affinis, C. atlanticus, C. curvisetum, C. decipiens, C. diversus, C. compressus, C. coarctatus C. lineatus, Eucampia zodiacus, Hemidiscus hardmanianus, Hemiaulus sinensis, Skeletonema costatum, A. japonica, Ceratium furca, C. fususm, C. trichoceros, C. massiliense, C. tripos, and D. caudata. During summer, high abundance was contributed mostly by diatom species (C. centralis C. coarctatus, C. concinnus, C. marginatus, C. thorii, Eucampia zodiacus, Guinardia flaccida, Helicotheca thamensis, Hemiaulus membranaceus, O. mobiliensis, and Triceratium favas).
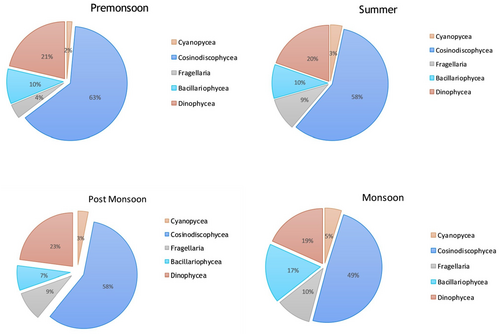
The percentage composition done for all the groups revealed that diatoms were the most dominant group in all the seasons, among diatoms Coscinodiscophyceae contributed 57.8% in POM, 57.8% in SUM, 63.2% in PRM, and 49.2% in MON. The second most dominant group was identified as Dinophyceae, which accounted 22.9%, 19.6%, 21.3%, and 18.3% in POM, SUM, PRM, and MON, respectively (Figure 6).
3.4 Species diversity indices
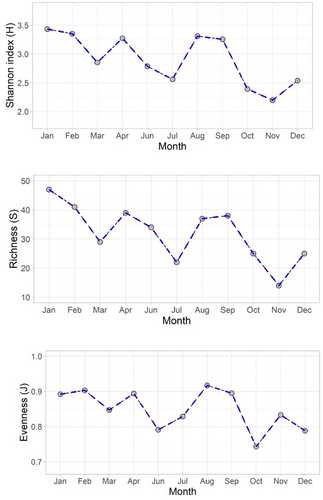
Species diversity index varied from 3.43 to 2.19 with maximum in POM and PRM season (Figure 7), and declined during monsoon. Species richness values ranged between 14 and 47, with the highest species richness in POM and PRM. Species richness values descended at the end of POM and PRM (Figure 7). Similarly, the highest species evenness (0.91) was also observed during the onset of PRM and POM. Similar to species diversity and richness, the evenness values were also reduced during monsoon season.
3.5 Relationships between phytoplankton assemblages and the environmental factors
Canonical correspondence analysis (CCA) is a multivariate method used to explain the relationship and association between species and their environment. In this investigation, the CCA was conducted to elucidate the relationship among phytoplankton abundance and environmental variables. Only species that exhibited above 10% abundance and frequent occurrence in all seasons studied were taken for the CCA (Figure 8). For interpretation purpose, eigenvalue <0.1 was considered, and the total proportion explained by the three principal axes was 64.97%. Of these, canonical axes 1 and 2 explained 25% and 21%, respectively.
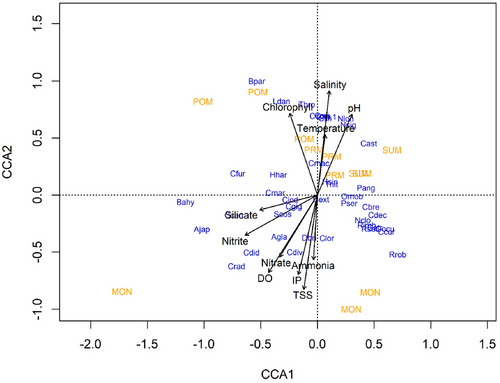
The first canonical axis was characterized by temperature, salinity, pH, and chlorophyll-a exhibiting significant positive association and identified as being key factors influencing phytoplankton abundance in axis 1. Species such as Ccur (0.610), Cdec (0.53), and Rrob (0.70) showed a positive association with temperature, salinity, and pH, while Ajap (−1.01832), Bahy (−1.16282), Cfur (−0.70260), Ccen (−0.73706), and Crad (−0.71241) exhibited negative relationship during POM season. Environmental parameters such as Nitrite, Nitrate, and IP had negative association with axis 2. Nevertheless, genera like Bpar (0.99), Clin (0.673), Ccom (0.694), Cori (0.696), Clin. 1. (0.68), Ldan (0.82) Nlon (0.66), Nsig (0.60), and Tbro (0.79) exhibited strong positive association with these parameters. DO, ammonia, TSS, and nitrate were characterized with species such as Dbri, Clor, Cext, and Pser in MON season.
Species such as Bpar (0.99), Clin (0.67), Ccom (0.69), Cori (0.69), Clin.1 (0.68), Ldan (0.82), Nlon (0.66), Nsig (0.60), and Tbro (0.79) exhibited strong positive relationship with salinity, temperature, chlorophyll a, and pH during PRM, POM, and SUM in dimension 2. Conversely, majority of species displayed negative relationship with silicate, nitrite, nitrate, DO, IP, ammonia, and TSS during MON season.
4 DISCUSSION
The water temperature in the present study exhibited a maximum in SUM and a minimum in MON. Evaporation due to solar radiation and freshwater influx are the influencing parameters of coastal surface water temperature. The observed lower temperature during MON might be associated with the factors such as strong wind and heavy rainfall, and the high temperature in SUM is attributed to the high solar radiation (Govindasamy et al., 2000; Vajravelu et al., 2018). Salinity plays a pivotal role as a limiting factor for the distribution of living organisms. Variations in salinity due to dilution and evaporation affect the distribution of fauna and flora in coastal ecosystems (Prabu et al., 2008). Salinity declined during MON and showed higher in nonmonsoon seasons (Postmonsoon and summer). The increased salinity in nonmonsoon seasons could be attributed to factor such as less rainfall, elevated evaporation, and the dominance of neritic water (Rajasegar, 2003). This seasonal trend between temperature and salinity has been well explained in PCA analysis, where temperature and salinity exhibit closer association with SUM.
Throughout the investigation, pH remained alkaline; however, during the MON season, it declined, attributing to the monsoonal influence. The concentration of ionic alkali metals (Na+, Ka+, Cl-) determines the pH in the marine waters. Since the influence of freshwater is less during nonmonsoon seasons, the alkali metal concentration increases, thus pH also increases (Hinga, 2002); furthermore, this has been evidenced in PCA where pH exhibits strong association during nonmonsoon seasons of POM and SUM.
Dissolved oxygen was in the range of 4.90–6.40 mg L−1 and recorded higher and lower during MON and SUM, respectively. It is well known that dissolution of oxygen is affected during summer due to high SST and elevated temperature, and the increased value in DO might be due to less salinity, high wind speed, increased atmospheric pressure, and rainfall (Saravanakumar et al., 2008; Vijayakumar et al., 2000). In agreement with the above findings, DO concentration exhibited a higher positive association with PCA analysis during the MON season.
Nutrients are the most primary components for the flourishment of marine fauna and flora. The distribution of nutrients is influenced by seasons, tidal conditions, and freshwater flow from the land sources. The inorganic nutrients such as nitrite, nitrate, and ammonia showed maximum during POM, MON, and PRM seasons. In PCA, nitrite and nitrate were in positive association with POM season. However, ammonia had a strong association with PRM and MON seasons, implying the effect of high phytoplankton productivity and factors such as river runoff attributing to elevated ammonia. It is reported that freshwater inflow, terrestrial runoff during monsoon season and conversion of ammonia by oxidation process increases the nitrate level (Hänninen et al., 2000; Rajasegar et al., 2000). The elevated value of ammonia in PRM and MON can be ascribed to the increased phytoplankton productivity, decomposition of phytoplankton, and terrestrial runoff (Segar & Hariharan, 1989; Senthilkumar et al., 2008; Thangaradjou et al., 2014). The observed low values of nitrite and nitrate during nonmonsoon seasons could be due to the utilization of phytoplankton and neritic water dominance. The above statement corroborates well with the present study as high photosynthetic activity has been observed in PRM, SUM, and POM (Govindasamy et al., 2000).
The concentration of phosphate in coastal waters is influenced by factors like freshwater mixing at the land–sea interaction zone, addition by local upwelling, and monsoonal dilution of seawater (Govindasamy et al., 2000). Similarly, in the present study, phosphate concentration was found to be higher (6.78 μmol L−1) during the MON season relating with freshwater influence. It is also documented that phosphate may be released from sediment due to the turbulent action associated with strong winds (Chandran & Ramamoorthi, 1984; Choudhury & Panigrahy, 1991).
In coastal waters, silicate content exhibits significant spatiotemporal variation due to the influence of several factors such as physical mixing of seawater with freshwater (Purushothaman & Venugopalan, 1972), adsorption of reactive silicate from suspended particles (Lal, 1978), chemical interaction with clay minerals (Aston, 1980: Gouda & Panigrahy, 1992), coprecipitation with humic compounds, and most importantly removal by biological agents like phytoplankton especially diatoms and silicoflagellates (Aston, 1980; Liss & Spencer, 1970). In the present investigation, silicate content was higher (8.57 μmol L−1) during POM and varied significantly (p < .001) among four seasons. The registered high value in POM is attributed to heavy discharge from a point source (Vellar Estuary) after monsoon and the lower values observed ascribe to the utilization by phytoplankton (diatoms) (Rousseau et al., 2002). This statement is in agreement with the present finding in PCA, as silicate exhibited a significant positive association with POM season. High total suspended solid (TSS) values observed in monsoon were due to the heavy river inputs and the turbulence caused by strong wind, and it was evidenced in PCA with TSS having strong positive association with the monsoon season.
Totally, 93 species of phytoplankton belonging to different groups (diatoms, dinoflagellates, and cyanobacteria) were identified in this study. All the species identified in the present study have already been reported in Indian waters by various studies (Desikachary, 1987; Ilangovan, 1987; Menon, 1945; Subrahmanyan, 1946). Invariably, diatoms (Coscinodiscophyceae – 63, bacillariophyceae – 15, Fragilariophyceae – 4) were found to be significantly higher in abundance and species diversity as compared to other groups of phytoplankton.
According to earlier reports, the predominance of diatoms during all seasons generally is attributed to the availability of adequate concentrations of silicate and their better capacity to widely varying hydrographical conditions (Gouda & Panigrahy, 1992; Gowda et al., 2001; Madhupratap et al., 2003; Mani, 1992; Rajasegar et al., 2000; Saravanakumar et al., 2008; Zingone et al., 2021). Population density exhibits statistically significant variations (p < .001) among seasons, with peak density during postmonsoon (POM), followed by premonsoon (PRM) and summer (SUM). Seasonal variations in phytoplankton density in coastal waters are generally linked to a wide range of physicochemical parameters such as temperature, salinity, nitrate–nitrite, and phosphate. In this study, the high concentrations of nitrate and silicate observed during monsoon (MON) and POM seasons likely favored the abundant growth of diatoms. Additionally, the positive loading of silicate (POM) and nitrate in PCA underscores the strong dependency of phytoplankton on these factors.
Variation in phytoplankton species composition and density could be attributed to the seasonal changes in the physiochemical parameters. From this investigation, the dominance of diatoms was observed in terms of density and species composition throughout the study. Diatoms registered the highest species composition (63) and density (8.9 × 10²–16.6 × 10³), particularly during POM and PRM season. This increase might be associated with the abundant discharge of nutrients by the Vellar estuary during MON, which must have resulted in proliferation of diatoms and other groups in terms of density and composition, particularly in the POM season (Gowda et al., 2001; Mani, 1992). Further, the dominance of diatoms in POM strongly proves that the availability of silicate concentration favors the enhancement of diatom populations (Madhupratap et al., 2003; Sarker et al., 2021). In addition, the increased density observed during the PRM season was predominantly contributed by diatoms. According to previous reports, diatoms in the Bay of Bengal has the ability to thrive well in PRM (Gowda et al., 2001; Mani, 1992).
When natural processes are controlled by a set of interrelated variables, the need for focused statistical research is substantial to discern the relative importance of different variables in the process (Luoma & Bryan, 1978). Hence, to understand the relation and interaction among the phytoplankton community and physicochemical variables canonical correspondence analysis (CCA) was conducted. The overall percentage explained by three axes was 64.97%, indicating strong variance in the species–environment relationship. The conducted CCA analysis revealed that temperature, salinity, and pH were the most significant parameters at axis 1 influencing the phytoplankton species. Further, temperature, pH, and salinity exhibited significant positive relation with chlorophyll-a and ascertained that they play a significant key role in phytoplankton abundance, diversity, and community structure. Similar to the present results, Srichandan et al. (2015) also observed a significant positive relationship of salinity in CCA and stated that it plays a significant role in spatiotemporal variation in phytoplankton. The second axis in CCA explained that nitrite, nitrate, IP, and silicate were the most significant parameters that negatively influence genera such as Cdiv (Chaetoceros diversus), Cdid (Chaetoceros didymis), Ajap (Asterionellopsis japonica), and Coscinodiscus radiatus (Crad) during monsoon season. Further, salinity remained almost similar range during the nonmonsoon seasons and this clearly implies that it has significantly influenced the phytoplankton growth and abundance positively from POM to PRM.
5 CONCLUSION
The study concludes that phytoplankton growth in Parangipettai coastal waters is most favorable during the premonsoon (PRM) and postmonsoon (POM) seasons, consistent with previous findings. PCA and CCA analyses indicate that salinity, temperature, and pH during PRM, along with silicate during POM, significantly influence phytoplankton abundance. Stratification in the surface layer during summer (SUM) leads to an oligotrophic environment, reducing phytoplankton diversity. In PRM, nutrients are replenished by sporadic rainfall and coastal upwelling, supporting phytoplankton growth. Unlike POM, PRM phytoplankton abundance is dominated by specific species, aligning with observations in the region (Prabu et al., 2008; Thangaradjou et al., 2014; Vajravelu et al., 2018). This study highlights that salinity and temperature, coupled with moderate nutrient concentrations during PRM, favor specific phytoplankton species (Chaetocerotaceae), while POM conditions support the diversity of the entire phytoplankton community. Furthermore, the study emphasizes that it is significantly important to investigate phytoplankton dynamics along coastal waters, particularly in understanding the influence of environmental factors on the phytoplankton community. The findings also highlight the significance of regular monitoring of phytoplankton community structure. Studying long-term trends in phytoplankton abundance and community composition can help detect changes in environmental conditions over time. Thus, continuous monitoring is crucial for assessing coastal ecosystem health and biodiversity.
ACKNOWLEDGMENTS
The authors would like to thank Dean and Director of CAS in Marine Biology and authorities of Annamalai University for providing facilities. We would like to thank the funding agency for the insights and suggestions. The author would like to thank Dr. Rashmi Sharma, Focal Person, SAMUDRA Program, Deputy Director, EPSA and Director, SAC for necessary encouragement. The authors would also like to thank the Centre of Advanced study in Marine Biology, Annamalai University, Parangipettai for providing the laboratory facility to carry out the research work.
FUNDING INFORMATION
This research work was supported by Space Applications Centre (ISRO)'s Technology Demonstration Program (TDP) SAMUDRA and is an applied research work. The research leading to these results received funding from Space Administration Centre (SAC), ISRO under SAC-ISRO [Samudra-TDA] project entitled Identification forecasting and monitoring of potential fishing zone for Tamil Nadu coastal and offshore waters. Grant No. [G6/66588/2017].
CONFLICT OF INTEREST STATEMENT
The authors declare that there is no competing interest.
Open Research
DATA AVAILABILITY STATEMENT
The data that support the findings of this study are available from the corresponding author upon reasonable request.


