Genetic structure of the commercially important Asian monsoon scallop, Amusium pleuronectes (Linnaeus 1758), across the Indonesian Archipelago
Abstract
The Asian monsoon scallop, Amusium pleuronectes, is a key member of the most commercially harvested shellfish community in Asia. Patterns of genetic diversity and natural population structure in the target species were investigated to gain a better understanding of its evolutionary history. Samples were collected from five sites across the Indonesian Archipelago. We characterized sequence variation in an mtDNA control region fragment in 249 individuals. The genetic diversity (h = ranging from 0.83 to 0.92) and nucleotide diversity (π = ranging from 0.24 to 0.32) were low compared to the estimates reported for many other similar shellfish taxa. Nonetheless, analysis of molecular variance revealed significant genetic differentiation, FST = 0.0203 (p < .005 after Bonferroni corrections). Furthermore, both Pairwise fixation index values showed significance among majority population sites, indicating that dispersal potential and gene flow were low in the past. This pattern likely reflects a low dispersal potential, potentially allowing local adaptation to sites that augment any oceanographic and geographic contribution to genetic structure. The results described herein provide a foundation for developing better conservation strategies for the target species in the future.
1 INTRODUCTION
Bivalvia (bivalves) is a class of molluscs that has the second highest species diversity after gastropods (Bieler et al., 2013; Giribet, 2008). Marine bivalves have also expanded their distribution horizontally and bathymetrically into various marine environments since the Paleozoic era (Morton, 1996; Plazzi et al., 2011). Ultimately they succeeded in obtaining morphological and genetic diversity through habitat representation and natural selection across geological time scales (Marko & Moran, 2009; Mikkelsen, 2011; Plazzi et al., 2011). The target species of this study is the Asian monsoon scallop, Amusium pleuronectes. The Asian monsoon scallop is present in much of the Indo-Pacific coastal area. The species has been recorded from central Ryukyu Island, South China Sea to South-East Asia, and Australia (Habe, 1964; Morton, 1980), at a depth of 18–40 m (Minchin, 2003) and has a larval duration divided into five steps, which take 120 days to complete (Cabacaba et al., 2020). This species, though ecologically and economically important, often forms a major component of the catch of fishing vessels. In Indonesia, the species is of significant commercial value, however, catch statistics show that production declined since 2000 (FAO, 2006; Hardianto & Satriyo, 2023). Uncontrolled fishing activities may kill large numbers of species stocks, threatening the population stocks. Assessment of the species' populations in the Indonesian Archipelago revealed a high exploitation ratio due to high demand and overfishing. Continuous fishing pressure may lead these marine species to genetic and population bottlenecks if preventive action is not taken. Thus, there is a need to establish baseline data to understand the current stock status of the Asian monsoon scallop.
Population genetic tools offer an opportunity to elucidate the genetic level, patterns of dispersal (connectivity), and demographics (past and present), to better understand the responses of various species to ecological changes and anthropogenic stressors (Canales-Aguirre et al., 2018). The multi-locus genetic approach is increasingly favoured due to the high success rate in revealing both the contemporary and historical events for targeted species (Borsa, 2003; Gaither et al., 2011; Tan et al., 2016). In marine organisms, the relative dispersal rates of adults and/or larvae, as well as environmental permeability play an important role in influencing the genetic diversity and population structures. Both physical factors (e.g., habitat characteristics and ocean currents) and biological factors (e.g., spawning behavior, predation, eco-physical capacity and larval dispersal) can affect the distribution patterns and consequently shape the genetic structure (Derycke et al., 2013; Hohenlohe, 2004). Dispersal potential and patterns are important for species survival because they affect the ability of organisms to avoid unfavorable environmental conditions, avoid competition and expand the distribution range of individuals (Sahraean et al., 2017). The potential distance and direction of dispersal can have a large impact on the extent of gene flow and genetic differentiation within and between populations (Froukh & Kochzius, 2007). The ocean is a dynamic environment and can generate physical stress, mainly driven by wave forces, and tides. These factors are often important in shaping the genetic structure of a population, its dynamics, and connectivity between sites.
In this study, we analyzed the genetic diversity and population structure of A. pleuronectes in Indonesia, especially between the western and eastern regions of Indonesia which are separated by the Wallace Line (Wallace, 1860). The Wallace Line crosses the Lombok Strait between the Islands of Bali and Lombok and passes through the Makassar Strait between the Islands of Kalimantan and Sulawesi. The Lombok and Makasar Straits are considered deep enough to prevent the natural dispersal of most land animals, even during the Quaternary thinning when the sea levels were much lower than today (>120 m; Hall, 2013; Moss & Wilson, 1998). Whether this also affects marine animals is still a mystery. recent studies on marine taxa across the target location of this study have reported population structures such as crustaceans (Hardianto, Fukuchi, et al., 2022; Hardianto, Wijayanti, et al., 2022; Wainwright et al., 2020a), fish (Ackiss et al., 2013; Hardianto et al., 2023), coral reef (Wainwright et al., 2020b), sea urchin (Wainwright et al., 2019) and shellfish (Kusnadi et al., 2022). The structured populations were attributed to several factors including historical and contemporary interplay among a complex set of ecological, demographic, behavioural, genetic, oceanographic, climatic and/or tectonic processes.
Here, we analyzed the genetic diversity levels, patterns, and wild population structures of A. pleuronectes based on the mitochondrial DNA (mtDNA) control region (CR) sequence, which may warrant independent conservation and management attention. Finally, we discuss the historical biogeography of A. pleuronectes, particularly across the Indonesian Archipelago. Based on our data, we speculate about when and how populations may have diversified in the recent past and assess the patterns observed in light of the impact that the Wallace Line may have had on marine dispersal across the region.
2 MATERIALS AND METHODS
2.1 Sampling and DNA extraction
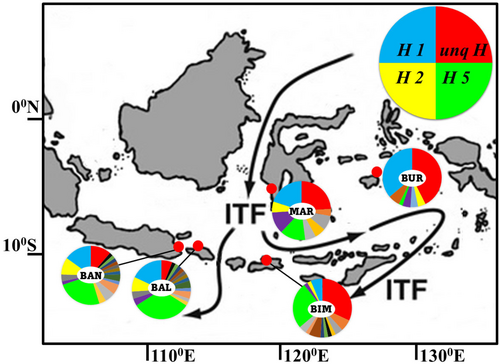
Amusium pleuronectes samples were collected from the ocean at a depth of 10–30 m from a large proportion of the natural distribution of this species across the Indonesian Archipelago, including from sites on either side of the Wallace Line. In total, 249 individuals were collected between 2020 and 2022 from five sampling locations, namely from the Islands of Java (Banyuwangi), Bali Island (South Denpasar), Sumbawa Island (Bima), Sulawesi Island (Maros), and Buru Island. Individual A. pleuronectes samples were fixed in >70% ethanol on site and then transported to the laboratory, where they were transferred into fresh ethanol until used for genetic analysis. Muscle tissue (25 mg) from the samples was excised from near the shell using scissors and forceps. Muscle samples were preserved in 1.5 mL plastic test tubes containing 0.5 mL of TNES-8 M urea buffer (Asahida et al., 1996) until DNA was extracted using the Sambrook phenol-chloroform extraction method with modifications (Imai et al., 2004).
2.2 Amplification and sequencing
The mtDNA CR was amplified via polymerase chain reaction (PCR) using primers designed from the complete mtDNA sequence of Asian monsoon scallops, A. pleuronectes (MT419374; Yao et al., 2020). The new primer sequences were as follows: Amusium dloop-F (5′-TAACAGGGTATCTAATCCTGG-3′) and Amusium tRNA-R (5′-GGTGTAAAGAGCACATAAAGTTTTG-3′). The primer pairs amplify a ~900-bp fragment of the variable region of the mtDNA CR. All reactions were carried out in 25-μL total volumes and the following reagents were added to each PCR microtube: 1 μL of template DNA, 25 pmol of each primer, 12.5 μL of Emerald DNA polymerase master mix (Takara bio, Japan). Each sample was adjusted to 25 μL with distilled H2O. PCR was performed using a GeneAmp 9700 thermal cycler (Applied Biosystems, Waltham, MA, USA) and the following conditions: hot start (94°C, 180 s), followed by 30 cycles of denaturation (94°C, 30 s), annealing (49–52°C, 30 s), and extension (72°C, 90 s), and a final extension period (72°C, 420 s). Successful PCR amplification was verified by electrophoresis on a 1% agarose gel (Wako Pure Chemical Industries, Ltd., Osaka, Japan). Following electrophoresis, gels were stained with ethidium bromide, and each product was checked on a transilluminator (Advanced Scientific Products Pty Ltd., Qld, Australia). PCR products were purified using a PCR product pre-sequencing kit (USB Co., Cleveland, OH, USA). Amplified DNA was then sequenced on an ABI 3730xl DNA analyzer using the BigDye Terminator v3.1 Cycle Sequencing Kit (Applied Biosystems, Waltham, MA, USA) from Macrogen Japan Corporation, Koto City, Tokyo, Japan.
2.3 Data analyses
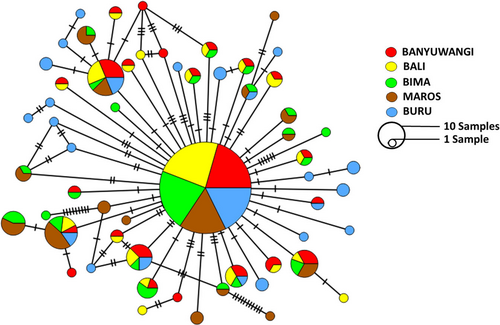
Nucleotide sequence data were aligned using ClustalW alignment software (Thompson et al., 1997), implemented in MEGA X (Kumar et al., 2018) using default alignment parameters, and the sequences were adjusted manually to avoid mismatches. The number of haplotypes (nh), haplotype diversity (h; Nei, 1987), number of unique haplotypes (nh unq), and nucleotide diversity (π; Tajima, 1989) were calculated for each location using Arlequin version 3.5 (Excoffier et al., 2010). Genetic differentiation among sites was estimated via the population pairwise fixation index (FST) based on haplotype pairwise differences (Reynolds et al., 1983), and the significance of estimates was tested using 10,000 random permutations (Arlequin). The distribution of variance within and between samples was determined using analysis of molecular variance (AMOVA) performed in Arlequin, combining populations into two geographical groups: (i) Western Indonesia; Banyuwangi (BAN) and South Denpasar (BAL), (ii) Eastern Indonesia (EI); Bima (BIM), Maros (MAR) and Buru Island (BUR). A haplotype network was developed using the analysis of a minimum spanning network (MSN) performed in PopART (Leigh & Bryant, 2015).
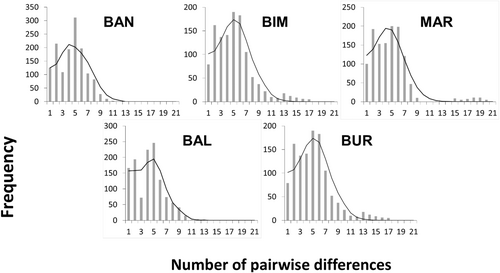
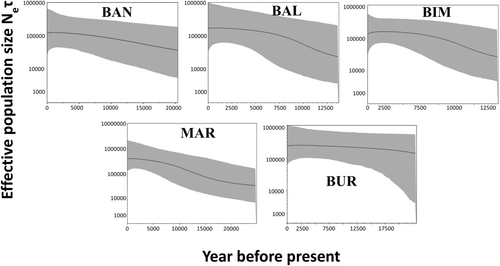
Neutrality tests and mismatch distribution analysis were employed to infer possible population expansion events and to test for deviations from a neutral model of evolution. Tajima's D (Tajima, 1989) and Fu's Fs (Fu, 1997) indices were calculated using Arlequin, with significance tested by random permutation using 10,000 replicates. We estimated the time of expansion of A. pleuronectes populations using Bayesian evolutionary analysis in BEAST version 2.4.2 (Bouckaert et al., 2014). Mismatch distribution analysis was conducted to test a model of exponential population growth (Rogers & Harpending, 1992). The demographic expansion parameter (τ) and population size before (θ0) and after expansion (θ1) were calculated for each sampled population. A goodness-of-fit test was performed to test the validity of a sudden expansion model, using a parametric bootstrap approach based on the sum of squared deviations between observed and expected mismatch distributions (Figure 1).
3 RESULTS
3.1 Haplotype and nucleotide diversities
A 746-bp mtDNA CR sequence nucleotide fragment was obtained after the alignment of 249 specimens of A. pleuronectes from five localities across Indonesia. A total of 108 haplotypes were identified after comparing all the sequences in the sampled individuals (Table 1). Nucleotide sequences of all haplotypes were deposited in the DNA Databank of Japan under the accession numbers LC793879-LC794129. Haplotype diversity was intermediate at all sampled sites (0.82–0.92), and low nucleotide diversity (0.23%–0.35%) was observed in the mtDNA CR sequence. Buru Island population showed the highest diversity estimate (h = 0.9121 and π = 0.3799%), whereas Banyuwangi showed the lowest estimate (h = 0.8345 and π = 0.2540%). The minimum spanning network produced a complex reticulation of 108 haplotypes (Figure 2) with four major haplotypes. The majority of haplotypes were shown to be shared between populations, and the BUR population had the highest independent haplotype.
| Sampling sites | Abb | N | NH | h | π (%) |
|---|---|---|---|---|---|
| Banyuwangi, East Java, Indonesia | BAN | 53 | 23 | 0.8345 | 0.2540 |
| South Denpasar, Bali Island, Indonesia | BAL | 50 | 20 | 0.8665 | 0.2717 |
| Bima, Sumbawa Island, Indonesia | BIM | 49 | 26 | 0.8963 | 0.3660 |
| Maros, South Sulawesi, Indonesia | MAR | 50 | 16 | 0.8612 | 0.3188 |
| Buru Island, South Moluccas, Indonesia | BUR | 49 | 23 | 0.9121 | 0.3799 |
| Total | 252 | 108 |
3.2 Gene flow and population differentiation
The AMOVA results for the mtDNA CR showed significant genetic structure. The mean FST estimates for mtDNA CR were 0.0203 (p < .0001), after Bonferroni correction (p < .0033) (Table 2). Grouping AMOVA results of mtDNA CR showed no significant genetic structure among the groups (FCT = 0.0042, p = .2027), but significant genetic structure among populations within the groups (FSC = 0.0178, p > .0001) and populations (FST = 0.0219, p = .0001) (Table 2). Furthermore, we saw significant genetic structure in the pairwise FST value analysis (p < .05) among all population sites except between BAL and BAN populations (Table 3). Based on pairwise FST value results, we inferred the existence of restricted gene flow that leads to significant genetic population structure among the sampled A. pleuronectes populations from different geographical regions across Indonesia.
| Source of variation | df | Sum of squares | Variance components | Percentage of variation |
|---|---|---|---|---|
| (i) No grouping | ||||
| Among population | 4 | 9.151 | 0.023 | 2.030 |
| Within population | 244 | 274.608 | 1.125 | 97.970 (FST = 0.0203, p < .0001) |
| Total | 248 | 283.759 | 1.148 | |
| (ii) Western Indonesia vs. Eastern Indonesia | ||||
| Among groups | 1 | 2.735 | 0.004 | 0.42 (FCT = 0.0042, p = .2027) |
| Among populations | 3 | 6.416 | 0.021 | 0.94 (FSC = 0.0178, p < .0001) |
| Within populations | 244 | 274.608 | 1.125 | 97.44 (FST = 0.0219, p < .0001) |
| Total | 248 | 283.759 | 1.150 | |
- Note: Significant values are shown in bold after Bonferroni correction p < .0033.
- Abbreviations: df, degree of freedom; FCT, variation among groups (c, groups; t, total); FSC, variation among populations within groups (s, sub population; c, group); FST, variations within population (s, sub population; t, total); p, probability.
| BAN | BAL | BIM | MAR | BUR | |
|---|---|---|---|---|---|
| BAN | 0.2883 | 0.0451 | 0.0361 | 0.0000 | |
| BAL | −0.0154 | 0.0171 | 0.0361 | 0.0000 | |
| BIM | 0.0298 | 0.0369 | 0.0181 | 0.0000 | |
| MAR | 0.0387 | 0.0371 | 0.0254 | 0.0000 | |
| BUR | 0.0406 | 0.0421 | 0.0444 | 0.0379 |
- Note: Values in bold indicate populations that are significantly different. For the location abbreviations, see Table 1.
3.3 Demographic changes
Mismatch distributions were generated by pooling all CR sequences from each population group after recognising significant population differentiation among the geographical regions based on the AMOVA results (Figure 3). Unimodal mismatch distributions were evident at all sample locations, suggesting that all sampled populations experienced recent rapid demographic expansions. The results of Tajima's D and Fu's Fs neutrality tests were negative in all populations and the pooled sample. Negative estimates for Tajima's D and Fu's Fs supported a population expansion scenario for the target species across the Indonesian Archipelago. A Bayesian skyline plot (BSP) analysis was used to estimate the approximate historical time frame in which the sampled populations had expanded across the Indonesian Archipelago. The results suggested that this occurred between 10,000 and 25,000 years BP (Figure 4).
4 DISCUSSION
4.1 Genetic diversities of Asian monsoon scallops
Genetic diversity in A. pleuronectes populations estimated from mtDNA CR sequence data was relatively high in haplotype diversity (ranging from h = 0.83–0.92) and low in nucleotide diversity (ranging π = 0.24%–0.38%), compared to the estimates in other shellfish taxa using the same mtDNA CR (Fernandez et al., 2015; Yamakawa & Imai, 2014) and another mtDNA marker (Mahidol et al., 2007). A pattern of high haplotype with low nucleotide diversity is indicative of rapid population growth from a small ancestral population, assuming sufficient time has elapsed to recover haplotype diversity via mutation, but not enough time has elapsed for large accumulated sequence differences to develop (Grant & Bowen, 1998; Hardianto, Wijayanti, et al., 2022). The pattern includes populations with high h and low π, which is associated with rapid population expansion after a period of low effective population size (Grant & Bowen, 1998; Hardianto, Wijayanti, et al., 2022). In this study, similar patterns were noted in the majority of the sampled populations. Many species that exhibit this pattern of h and π values are believed to have evolved in the early Pliocene or Pleistocene, but their mtDNA lineage merges at a more recent time scale (Grant & Bowen, 1998).
4.2 Genetic structure across the Indonesian Archipelago
Genetic structure analysis revealed significant genetically divergent populations of A. pleuronectes across the Indonesian Archipelago, as defined by a sharp genetic barrier differentiation evident between the Indonesian Archipelago. A similar pattern has been reported in studies of genetic diversity and population structures in a variety of marine taxa, including the crustaceans (Hardianto, Fukuchi, et al., 2022; Hardianto, Wijayanti, et al., 2022; Wainwright et al., 2020a), fish (Ackiss et al., 2013; Hardianto et al., 2023), coral reef (Wainwright et al., 2020b), sea urchin (Wainwright et al., 2018), and bivalve (DeBoer et al., 2014; Fauvelot et al., 2003; Hui et al., 2016; Kusnadi et al., 2022). This regional scale of population divergence between Pacific and Indian Ocean tropical/subtropical populations of marine organisms has often been linked to historical climatic events that produced Pleistocene low-sea stands (DeBoer et al., 2008). The presence of significant genetic structure could also be linked to major ocean currents that occur across and within this region; the Indonesian Throughflow. Surface currents and wind contribute to dispersal by pelagic larvae and, ultimately, this can affect connectivity of a large proportion of the population. In contrast, adults of most bivalve do not disperse over large geographical distances; instead, the spread and flow of their genes is often determined by impacts of dispersal over the shorter time period of their planktonic larval development. Consequently, their relative dispersal potential is closely related to the larval duration in each species (Grantham et al., 2003).
Our result of the genetic structure analysis of A. pleuronectes showed restricted gene flow leading to significant genetic structuring across Indonesia, as evidenced by significant FST and pairwise FST estimates among all populations sampled across the study area except the BAN and BAL populations (Table 3). Importantly, our results revealed significant genetic differentiation within and between islands separated by the Wallace Line. Particularly, pairwise FST estimates between sample sites grouped into WI and EI on either side of this major biogeographical barrier were significantly differentiated, potentially owing to the impact of the Indonesian Throughflow. This major marine current is fast enough to severely restrict larval and adult dispersal in many aquatic taxa (Hardianto, Wijayanti, et al., 2022; Hardianto, Fukuchi, et al., 2022). The significant genetic structure evident in all sampled populations of the target species east and west of the Wallace Line adds weight to the previous recognition of the impact of this barrier on dispersing a wide variety of marine organisms across Wallacea. Meanwhile, no significance of the genetic structure was observed between the BAN and BAL populations (p > .05), which are geographically close and have the same direction of current, allowing the larvae to spread from one another.
Other studies on diverse marine taxa across the same region confirm this view, for example, a study of stomatopod (Haptosquilla glyptocerus) limited gene flow leading to a genetic structure in the coral triangle that includes Indonesia (Barber et al., 2006). Another study on crustaceans (Austruca perplexa and Acetes sibogae sibogae) reported limited gene flow across the Indonesian Archipelago on mtDNA CR data (Hardianto, Fukuchi, et al., 2022; Hardianto, Wijayanti, et al., 2022). A limited gene flow has also been reported in some fish taxa, including high genetic divergence and significant genetic structure in red-bellied fusilier (Caesio cuning) and also in Javanese ricefishes (Oryzias javanicus) across Indonesia (Ackiss et al., 2013; Hardianto et al., 2023). Other study about Bivalvia also confirm this view, for example, a study about the giant clams in Indo-Malay Archipelago (DeBoer et al., 2008; Kochzius & Nuryanto, 2008), Indo-West Pacific (Hui et al., 2016), coral triangle (DeBoer et al., 2014) and in East Indonesia (Kusnadi et al., 2022) showed a very strong genetic population structure and a complex connectivity pattern, characterized by limited gene flow in almost all sample locations. Furthermore, geographical distance isolation patterns, geological history, and oceanographic conditions all contribute to shaping the genetic population structure and limited gene flow.
4.3 Demographic history
Limited gene flow of A. pleuronectes across the Indonesian populations corelated with the low estimated dispersal rate that were supported by the results of Tajima's D and Fu's Fs tests (Table 4), which showed significantly negative estimates at all sampled localities (p < .05), indicating that our populations are likely to have experienced recent population expansion. Mismatch distributions for all populations were unimodal, indicating sudden population expansion, with the average moving farther from the y-axis with time since expansion (Liu et al., 2008; Rogers & Harpending, 1992). We also investigated the historical demographic expansion event of A. pleuronectes in the Indonesian Archipelago using BSPs (Drummond et al., 2005). Our molecular results appear to correlate well with the proposed geological history of the region, showing the genetic structure across the Indonesian Archipelago. Based on the results of the BSP analysis for the Indonesian Archipelago, the population expansion was estimated to have occurred from 10,000 to 25,000 BP (Figure 4). Therefore, extensive dispersal of this species into and out of the Indonesian Archipelago may have been possible until the last glacial period (10,000–70,000 BP) (Hall, 2013; Kusuma et al., 2016; Moss & Wilson, 1998).
| Location | Neutrality test | Demographic parameters | Test of goodness-of-fit | ||||||
|---|---|---|---|---|---|---|---|---|---|
| D | p (D) | F s | p (Fs) | T | θ 0 | θ 1 | Hri | p (Hri) | |
| BAN | −2.167 | .0015 | −12.034 | .0002 | 4.473 | 0.005 | 10.879 | 0.034 | .240 |
| BAL | −2.232 | .0016 | −8.961 | .0006 | 4.461 | 0.005 | 7.393 | 0.038 | .410 |
| BIM | −2.274 | .0011 | −18.725 | .0000 | 4.631 | 0.056 | 10.778 | 0.014 | .860 |
| MAR | −1.978 | .0051 | −4.272 | .0589 | 4.453 | 0 | 9.707 | 0.017 | .800 |
| BUR | −2.219 | .0015 | −19.320 | .0000 | 4.453 | 0 | 19.707 | 0.047 | .045 |
- Note: Significant values (p < .05) are shown in bold.
- Abbreviations: D, Tajima's D; Fs, Fu's Fs; Hri; Harpending's raggedness index; p (D), p-value of Tajima's D; p (Fs), p-value of Fu's Fs; p (Hri); p-value of raggedness index; θ0, the population size before expansion; θ1, the population size after expansion; τ, τ value of mismatch distribution.
Sundaland, which includes the Indonesian Archipelago, has a shallow continental shelf, and eustatic sea-level changes have repeatedly connected the major islands in this region to the Sunda Shelf, with an average depth of approximately 70 m (Voris, 2000). The other region, Wallacea, is a region dominated by deep water. This region contains some of the deepest water on the planet, with water depths exceeding 7000 m (van Aken et al., 2009). Besides physical differences between the water bodies, the Sunda Shelf was dry during glacial maxima, when water levels dropped by as much as 120 m (Voris, 2000). The drying of the Sunda Shelf caused habitat loss and the extirpation of marine creatures. In contrast, the deep waters of Central and Eastern Indonesia, including Wallacea, prevented total drying even during glacial maxima. Consequently, this region acted as a refuge, allowing species to persist during periods of low sea level. This refuge was a source of recruits that colonized the newly available habitats when the glaciers retreated, flooding the Sunda Shelf. The drying of the Sunda and Sahul shelves, along with the consequent flooding when the glaciers retreated, created an opportunity for species that persisted in the deep waters of Wallacea to expand their range into new habitats. Species involved in these expansions benefited from the ecological release, facilitating the genetic structuring seen in the populations of A. pleuronectes on the Sunda Shelf and in Wallacea (Bowen et al., 2013; Crandall et al., 2011; Waters et al., 2013; Yoder et al., 2010).
5 CONCLUSIONS
Populations of A. pleuronectes revealed significant genetic divergence across the Indonesian Archipelago, as defined by a sharp genetic barrier differentiation evident between the Indonesian Archipelago. This, in turn, leads to isolation by distance, potentially allowing local adaptation to specific sites that augment any oceanographic, geographic, or biological barriers on genetic divergence across the region. Importantly, our results revealed significant genetic differentiation within and between islands separated by the Wallace Line. This adds strength to the statement that there are significant genetic differences in the populations of marine organisms in the western and eastern regions of Indonesia which are separated by the Wallace line. To ensure effective conservation, it is important to determine the appropriate management units within a species. If a population has significant ecological and genetic characteristics, it should be managed as a separate unit. Future research and regular monitoring are imperative to accurately determine discrete local population sizes and estimate the geographical range and impact of larval dispersal.
AUTHOR CONTRIBUTIONS
Eko Hardianto: Resources, writing – original draft, data curation, formal analysis, methodology. Hideyuki Imai: Resources, supervision, writing – review & editing. Diah Permata Wijayanti: Resources, writing – review & editing.
ACKNOWLEDGMENTS
We thank the National Research and Innovation Agency (BRIN), Republic of Indonesia, for permitting us to conduct the research in Indonesia. All sampling in Indonesia was undertaken in full accordance with the Indonesian government laws and regulations under research permit number 23/TU.E5.4/SIP/VI/2021. We thank Jaenuri, Ali Saifudin and Siti Khuzaimah for helping us to collect samples in Indonesia.
FUNDING INFORMATION
The authors received no specific funding for this work.
CONFLICT OF INTEREST STATEMENT
The authors declare that there are no conflicts of interest that could be perceived as prejudicing the impartiality of the reported research.
Open Research
DATA AVAILABILITY STATEMENT
All data analyzed in this work are available in the article and in the Supporting Information and will be shared by the corresponding author upon reasonable request.


