Temporal correlation of population composition and environmental variables in the marine invader Ciona robusta
Abstract
The capacity for ascidians to inhabit coastal sea floor worldwide relies on their peculiar tolerance to environmental variables and pollution, which is considered, together with high levels of genetic diversity, among the main drivers of their invasive potential. In spite of the continued interest in the genetics of invasive species, little attention has been paid toward the microevolutionary processes that drive structure and fate of ascidian populations over time under chemically polluted conditions. Understanding the interplay between environmental and population dynamics is critical to predict the biodiversity of marine coastal ecosystems. In the present study, a local population of the ascidian Ciona robusta living in the Fusaro Lagoon has been monitored over a 13-month period of sampling. Physico-chemical parameters (temperature, salinity, turbidity, dissolved oxygen, heavy metals), genetic composition (microsatellites, ITS-2), abundance and biomass (wet and dry weight) were assessed with the aim to infer fine-scale temporal variation of population structure with respect to rapid environmental change. Analysis of biomass showed that C. robusta is highly sensitive to salinity and oxygen concentrations. Further, genetic analysis suggested a highly dynamic population structure, likely due to the strong clustering of temporal samples and distinct responses to environmental conditions, including bioaccumulation of heavy metals. Here, we hypothesize that rapid variation in allele frequencies of neutral markers in C. robusta populations may increase the ability of the species to colonize habitats that are subject to strong variation and are under heavy human pressure.
1 INTRODUCTION
Ascidians are benthic animals that populate coastal marine habitats with strong natural fluctuations of physico-chemical parameters and high levels of pollution (Caputi, Crocetta, Toscano, Sordino, & Cirino, 2015; Carver, Chisholm, & Mallet, 2003; Dybern, 1965; Lambert, 2005; Simkanin, Davidson, Dower, Jamieson, & Therriault, 2012). These invertebrates are non-selective filter feeders that uptake and bioaccumulate metals and other pollutants from the environment (Ignatiades & Becacos-Kontos, 1970; Papadopoulou & Kanias, 1977; Radford, Hutchinson, Burandt, & Raftos, 2000). Due to their tolerance to biotoxic metals (Beiras et al., 2003), ascidian species such as Ciona robusta (Ciona intestinalis type A) are considered potential bioindicators of metals in marine and estuarine habitats (Bellas, Vázquez, & Beiras, 2001; Gallo & Tosti, 2015; Papadopoulou & Kanias, 1977). Mechanisms of resistance to pollutants have not been well elucidated to date, but ascidians likely defend themselves against the effects of metal-based pollutants by using different strategies such as detoxification, antioxidant systems, and reduced metabolism (Ueki, Uwagaki, Yamamoto, & Michibata, 2014). In ascidians, tolerance to rapid environmental change greatly varies at different steps of the life history. For example, during processes such as fertilization, larval development, and settlement, the species Styela plicata and Microcosmus squamiger are more sensitive to stressors such as temperature, salinity, and heavy metal ions than during processes occurring in juvenile and adult stages (Gallo, 2018; Pineda et al., 2012; Zega, Pennati, Candiani, Pestarino, & Bernardi, 2009).
Aquatic pollution enhances the success of invasive species, while representing a disadvantage for the native species pool (Crooks, Chang, & Ruiz, 2010). In recent years, non-indigenous ascidian species have become invasive in many locations around the world, often causing serious ecological and economical disturbances (Aldred & Clare, 2014; Colautti, Grigorovich, & MacIsaac, 2006; Fitridge, Dempster, Guenther, & Nys, 2012; Fletcher, Forrest, & Bell, 2013; Lambert & Lambert, 2003; Lambert, 2007; Mercer, Whitlatch, & Osman, 2009; Rius, Heasman, & McQuaid, 2011). Human vectors contribute to the expanding dispersal of ascidians, which would be limited by a short-lasting swimming larval stage (Bernier, Locke, & Hanson, 2009; Dijkstra, Harris, & Westerman, 2007; Zhan, Briski, Bock, Ghabooli, & MacIsaac, 2015; Zhan et al., 2012). Tolerance to stressors and human-mediated dispersal places these invertebrates among the marine organisms with the highest invasion potential (e.g., Ciona, Styela, Botryllus and Didemnum spp.) (Caputi et al., 2015; Carver et al., 2003; Dybern, 1967; Epelbaum, Herborg, Therriault, & Pearce, 2009; Lambert, 2005,2007; Rius & Darling, 2014; Shenkar & Swalla, 2011; Therriault & Herborg, 2008; Valentine, Carman, Blackwood, & Heffron, 2007; Zhan et al., 2015).
Understanding how populations of invasive species adapt to polluted environments that sharply fluctuate on a seasonal basis is of fundamental importance for assessing their evolutionary and ecological dynamics, and for predicting population resilience to rapid environmental change. However, as far as we are aware, studies that explicitly investigate small-scale temporal stability of genetic variability and structuring of ascidian species are rare. To date, no temporal meta-analysis investigated to what extent the population-level effect of environmental stressors influences the genetic and physiological composition of ascidian populations.
Species with high genetic differentiation (e.g., S. plicata) seem to perform better in polluted waters than species showing low genetic differentiation (e.g., M. squamiger), but it is not yet clear whether this differential adaptive capability has a genetic basis (Lambert & Lambert, 1998; Pineda et al., 2012). Further, response levels to low salinity and high copper concentration were different among S. plicata populations with different genetic composition (Pineda et al., 2012).
The two invasive Ciona species, namely C. intestinalis (C. intestinalis type B) and C. robusta (C. intestinalis type A), show complex global genetic patterns (Bouchemousse, Bishop, & Viard, 2016) and are sympatric in the Western English Channel, where the absence of recent hybridization signature points to the presence of strong reproductive barriers (Bouchemousse, Liautard-Haag, Bierne, & Viard, 2016; Caputi et al., 2007). The first records of C. robusta in the Mediterranean basin date to the second half of the 19th century (reviewed in Hoshino & Nishikawa, 1985). Large-scale genetic patterns in the English Channel and Mediterranean populations show high levels of within-population genetic variability and low levels of genetic differentiation among large geographical distances, in the absence of isolation by distance (Affinito et al., 2015; Hudson, Viard, Roby, & Rius, 2016). A longitudinal pattern of gene flow that follows a predominant eastward migration pattern indicates active recruitment from the Atlantic to the Mediterranean Sea (Affinito et al., 2015; Procaccini, Affinito, Toscano, & Sordino, 2011).
Lagoons are vulnerable ecosystems often exposed to eutrophication due to anthropogenic activities that, in some cases, can lead to dystrophic crisis. Variations in the physico-chemical properties of water may bring about changes in the population genetic structure of marine organisms. Ciona robusta has been present in the Fusaro Lagoon (Naples, Italy) at least since 1984 (Caputi et al., 2015; Sordino, 1986). This lagoon is a shallow coastal salt lake connected to the Tyrrhenian Sea through three narrow channels, and it suffers from long-lasting anthropogenic pollution (Arienzo et al., 2014; De Pippo, Donadio, Grottola, & Pennetta, 2004). With respect to its location, hydrologic regime, and geomorphology, the lagoon is characterized by gradual and sharp variations in abiotic parameters on a daily and seasonal basis. Dystrophic crises (e.g., eutrophication, anoxia) in summer, during which several marine species disappear almost completely, including C. robusta, are counterbalanced by favorable environmental conditions (e.g., decreased levels of water temperature and salinity) in spring, autumn, and winter (Carrada, 1973). Of note, this ascidian species experienced total extinction along the southern Italian coasts during 2010, with recolonization of the Fusaro starting in 2011 (Caputi et al., 2015).
The objective of the present study was to assess key factors, whether human-created disturbances and/or natural environmental conditions, affecting the temporal patterns of genetic diversity and life history traits of C. robusta in the Fusaro Lagoon. To this end, we performed a meta-analysis using new and previously published data (Arienzo et al., 2014). Specifically, we correlated the genetic (microsatellites, ITS-2) and non-genetic (wet weight, dry weight, and Condition Index) biological parameters of a C. robusta population with field trace metals and other environmental variables (temperature, salinity, dissolved oxygen, and turbidity) over 1 year in a natural lagoon system. Given the strong invasive potential of C. robusta, a more complete understanding of how this species may cope with human and natural stressors over time may potentially help to manage this marine invader. Moreover, given the importance of C. robusta as a model organism in evolutionary studies (Passamaneck & Di Gregorio, 2005; Procaccini et al., 2011; Satoh, Rokhsar, & Nishikawa, 2014), a more profound knowledge of the population genetics is a vital ingredient also in this field of study.
2 MATERIAL AND METHODS
2.1 Study site and sampling
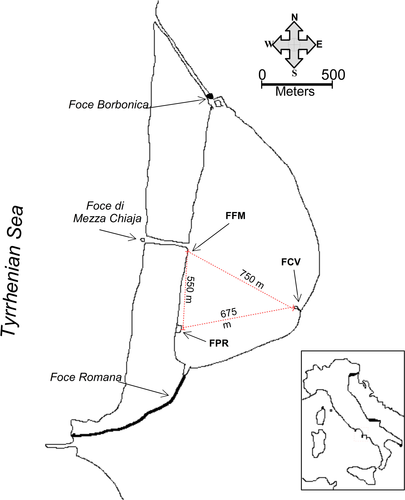
From May 2011 to June 2012, with the exception of January 2012, a total of 1,139 C. robusta specimens were collected on a monthly basis in three different locations of the Fusaro Lagoon, Casina Vanvitelliana (FCV), Foce di Mezza Chiaja (FFM), and Peschiera Romana (FPR) (Figure 1). The three sites differ in terms of substratum and distance from the Foce di Mezza Chiaja canal, the only channel allowing significant water exchange with the open sea (Figure 1). FCV is an 18th-century building connected to the mainland by a wooden bridge and located at ca. 750 m from Foce di Mezza Chiaja. Ciona robusta grows on the pillars of the bridge where it forms multi-generational aggregates at 0.5–3.0 m depth. FPR is an ancient Roman tufaceous ruin placed at ca. 550 m from the Foce di Mezza Chiaja. Here, adults are distributed over a vertical substratum of tuff bricks at 0.5–3.0 m depth. Finally, few 100 m from FPR and close to the Foce di Mezza Chiaja canal, C. robusta grows on vertical concrete rock docks at 0.5–1.5 m depth in the FFM site. Previous data indicate that a single population with high internal genetic diversity inhabits the Fusaro Lagoon (Affinito et al., 2015; Caputi et al., 2015; Sordino et al., 2008). Specimen sampling was carried out manually in randomly selected and unmanipulated 15 × 15 cm (0.44 m2) areas on artificial structures at ca. 0.5 m depth in each site. The collected specimens were promptly transported to the laboratory. There, a minimum of 20 individuals to be used for genetic analyses were immediately stored at −80°C. In addition, at least five individuals to be used for body measurements were fixed in 90% ethanol and, before biomass analysis, rinsed in running seawater to remove epibionts and any foreign body present on the surface of the tunic.
2.2 Ecological and physiological metrics
Environmental parameters (surface water temperature, salinity, dissolved oxygen, percentage of oxygen saturation, and turbidity) were measured monthly at each sampling site by immersing a multi-parametric probe (Multi Water Quality Checker U-50, Horiba) at 0.5 m depth from March 2011 to July 2012, with the exception of August 2011 (high seawater pollution), October 2011, and January 2012 (adverse weather conditions). For anatomical analyses, a total of 290 C. robusta individuals were haphazardly chosen at each collection time. Specimens were preserved in 90% ethanol upon arrival in the laboratory. For each individual, the tunic was manually separated from the body and the two parts were weighted with a Sartorius TE 1502S balance. Tunics and bodies were dehydrated at 105°C for 24 hr, and dry parts were weighed using a Sartorius R160P balance. To evaluate the current body condition (Labocha, Schutz, & Hayes, 2014) of the animals collected for the present study, we used the Condition Index (CI), defined as CI = DWbody/DWtotal where DW stands for dry weight (Petersen, Schou, & Thor, 1995). According to Petersen et al. (1995), the threshold for a growing population has been set to a value of 0.46. Statistical analyses were performed in R (R Development Core Team, 2008).
2.3 Population genetics
2.3.1 ITS-2
A total of 80 individual genomic DNAs were sequenced for the internal transcribed spacer 2 (ITS-2). Primers and PCR conditions follow previously published protocols (Caputi et al., 2007). Haplotype and nucleotide diversity were estimated using the DnaSP 5 software (Librado & Rozas, 2009). Median-joining (MJ) network (Bandelt, Forster, & Röhl, 1999) for the entire dataset was built using the software NETWORK 4.510 with default settings. ITS-2 phylogenetic relationships were inferred using the maximum likelihood method based on the Tamura 3-parameter model in MEGA 7 (Tamura, Stecher, Peterson, Filipski, & Kumar, 2013).
2.3.2 Microsatellites
A total of 769 individuals were genotyped using eight microsatellite loci previously developed for C. intestinalis sp. A (now known as C. robusta) (Cin-1, Cin-2, Cin-5, Cin-7, Cin-9, Cin-4, Cin-49, and Cin-67) (Affinito et al., 2015; Andreakis, Caputi, & Sordino, 2007). All loci were amplified in a single multiplex PCR, using the Qiagen Multiplex PCR Kit with the same condition as in type I PCR in Affinito et al. (2015). The forward primer was always labeled. Microsatellite PCRs were directly analyzed on an Automated Capillary Electrophoresis Sequencer 3730 DNA Analyzer (Applied Biosystems). Electropherograms were analyzed with the platform-associated fragment analysis software Peak Scanner 1 (Applied Biosystems).
Genetic diversity for all loci and populations, total number of alleles, observed heterozygosity (Ho), and expected heterozygosity (He) were calculated using ARLEQUIN (Arlequin 3.5) (Excoffier & Lischer, 2010). Values of the Fixation Index (Fis—inbreeding coefficient) were obtained with the software Genetix 4.05 (Belkhir, Borsa, Chikhi, Raufaste, & Bonhomme, 1996–2004), and their significance was tested with 10,000 bootstrap replicates. The neutrality of the loci was tested using LOSITAN (Antao, Lopes, Lopes, Beja-Pereira, & Luikart, 2008) and BAYESCAN (Foll & Gaggiotti, 2008). In LOSITAN, simulations were run for 100,000 iterations, with a 95% confidence interval and using the option for neutral mean FST. BAYESCAN was used by running 5,000 iterations.
The mean relatedness (r) values for each sample were estimated using the maximum likelihood method implemented in the software ML-Relate (Kalinowski, Wagner, & Taper, 2006). This software calculates the relatedness for each individual pairwise comparison, and the mean of these (excluding self-comparisons) was calculated for sample mean relatedness. Relatedness estimates were adjusted for the presence of null alleles. To provide comparative assessment of population structure, we used the Bayesian clustering analysis implemented in Structure 2.3.4 (Falush, Stephens, & Pritchard, 2003; Pritchard, Stephens, & Donnelly, 2000). The number of clusters (K) was estimated as described in Evanno, Regnaut, and Goudet (2005) using the online software Structure Harvester (Earl & vonHoldt, 2012—http://taylor0.biology.ucla.edu/structureHarvester/), after performing 15 independent runs of K = 1 to 27 at 100,000 MCMC repetitions and a burn-in period of 20,000 iterations. Admixture model and correlated allele frequencies were utilized, together with a uniform prior for α, with an initial value of 1 and maximum of 10.0; λ was set at 1.0. For the selected value of K, we assessed the membership coefficients per individual per cluster (Q), setting the assignment threshold to Q > 0.80. Trace metal concentrations in C. robusta body and tunic were retrieved from a previous study (Arienzo et al., 2014) based on the same sample used for the present report.
| Month | A (n/m2) | mWW (g) | mDW (g) | CI (DWsoma/DWtotal) | T (°C) | S (psu) | O2 (mg/L) | %O2 | Tu (ntu) |
|---|---|---|---|---|---|---|---|---|---|
| March 2011 | 11.030 (0.304) | 34.953 (0.484) | 6.527 (1.045) | 154.797 (15.163) | 1.700 (0.166) | ||||
| April 2011 | 16.750 (0.867) | 34.007 (0.349) | 7.707 (1.195) | 99.080 (11.705) | 1.373 (0.307) | ||||
| May 2011 | 41.667 (4.041) | 59.373 (16.218) | 2.893 (0.889) | 0.538 (0.045) | 24.343 (0.337) | 33.633 (0.379) | 4.990 (2.307) | 72.470 (42.388) | 71.447 (114.798) |
| June 2011 | 39.394 (15.011) | 91.985 (0.092) | 5.930 (3.394) | 0.456 (0.092) | 27.497 (0.457) | 33.500 (0.265) | 9.250 (1.477) | 145.343 (21.525) | 8.547 (3.871) |
| July 2011 | 24.242 (9.238) | 141.715 (94.406) | 5.545 (1.223) | 0.384 (0.06) | 25.593 (0.070) | 31.767 (0.335) | 3.713 (1.020) | 46.827 (3.681) | 10.033 (7.325) |
| August 2011 | 11.364 (8.660) | 36.220 | 2.410 | 0.388 | |||||
| September 2011 | 6.061 (4.619) | 36.630 | 4.600 | 0.427 | 26.840 (0.684) | 31.867 (0.115) | 5.010 (0.044) | 98.447 (32.089) | 2.713 (1.667) |
| October 2011 | 6.061 (4.619) | 42.810 | 4.750 | 0.518 | |||||
| November 2011 | 59.848 (6.429) | 59.850 (36.157) | 2.663 (1.294) | 0.563 (0.078) | 17.270 (0.354) | 28.217 (0.419) | 9.247 (0.631) | 114.373 (18.057) | 2.753 (0.559) |
| December 2011 | 73.485 (23.159) | 40.280 (22.569) | 2.147 (1.745) | 0.488 (0.084) | 10.637 (0.309) | 29.417 (0.465) | 10.693 (0.800) | 110.9 (5.536) | 1.087 (0.118) |
| February 2012 | 49.242 (11.590) | 45.430 (23.319) | 1.603 (0.602) | 0.360 (0.082) | 11.113 (1.187) | 29.857 (0.626) | 11.003 (1.642) | 125.887 (17.793) | 1.327 (1.308) |
| March 2012 | 87.879 (10.116) | 29.480 (9.787) | 1.270 (0.983) | 0.509 (0.067) | 17.117 (0.402) | 30.167 (0.647) | 9.530 (0.779) | 120.087 (8.899) | 1.123 (0.997) |
| April 2012 | 94.697 (24.214) | 93.237 (12.292) | 3.563 (3.433) | 0.481 (0.111) | 20.477 (0.127) | 28.840 (0.229) | 8.077 (0.475) | 105.387 (9.058) | 0.340 (0.111) |
| May 2012 | 68.939 (13.796) | 81.220 (37.839) | 2.810 (1.207) | 0.509 (0.086) | 22.920 (0.416) | 33.700 (0.200) | 7.167 (0.638) | 99.217 (10.169) | 3.903 (2.427) |
| June 2012 | 61.364 (4.583) | 77.417 (50.641) | 2.757 (1.411) | 0.370 (0.081) | 29.180 (0.026) | 34.767 (0.503) | 5.867 (1.075) | 98.630 (4.406) | 8.997 (4.415) |
| July 2012 | 28.577 (0.571) | 32.700 (0.500) | 6.540 (0.882) | 102.353 (15.105) | 15.493 (15.090) |
Notes
- Environmental parameters were calculated as means of measurements performed at each of the three sampling sites in the Fusaro Lagoon. Standard errors are in parentheses.
- %O2: percentage of dissolved oxygen; A: Abundance; CI: Condition Index; mDW: mean dry weight; mWW: mean wet weight; O2: dissolved oxygen; S: salinity; T: temperature; Tu: turbidity.
2.4 Testing for differences among sampling sites
Given the proximity of the three sampling locations within the Fusaro Lagoon, we tested for significant differences among sites in terms of physico-chemical and genetic measures. Student's t test was performed on each of the recorded environmental variables. In addition, the microsatellite-based genetic composition of local C. robusta communities in the three sites was subject to principal coordinates analyses (PCoAs) and the Mantel test. To assess isolation by distance (IBD), we performed the Mantel test (Mantel, 1967) in the R package adegenet (Jombart, 2008), which compares the matrices of pairwise genetic and geographical distances (in kilometers). We tested the hypothesis of a correlation between these two distances in the Fusaro Lagoon. To assess spatial distance among populations, we calculated the shortest linear kilometric distance along the coast. The significance of the IBD pattern was determined with 999 permutations.
2.5 Statistical analyses
Statistical analyses on genetic data—principal coordinates analysis (PCoA) and canonical correspondence analysis (CCA)—were performed in R (R Development Core Team, 2008) using the package vegan (Oksanen et al., 2015). When performing CCAs, we tested for residual autocorrelation using the command mso in the R vegan package, which performs a permutation test for the spatial independence of residuals. A total of 1,000 permutations were performed for each dataset (environment, physiology, and trace metals). No indication of significant autocorrelation influencing the total variance was detected (data not shown). The partitioning of contingency coefficient for each of the three CCAs was analyzed in the R vegan package.
3 RESULTS
3.1 Pooling data from the three sampling sites
Specimen abundance varies across the lagoon in space and time (Supporting Information Table S1). For instance, C. robusta living at FCV and FFM sites is more prone to total depletion during seasonal die-offs than at FPR. We attribute the differences in temporal demographic structure to small-scale variation in anthropic pressure or to substratum type-specific responses. Environmental variables in the three sampling sites were not statistically different and were therefore ruled out as possible explanation (Supporting Information Tables S2 and S3). Similarly, no sign of statistically significant spatial separation was detected when analyzing the microsatellite dataset by means of principal coordinates analyses (PCoAs), a view further supported by the absence of isolation by distance as shown by using the Mantel test (Supporting Information Figure S1a,b). According to these findings, a single population of C. robusta inhabits the lagoon and, consequently, data from the three sampling locations were pooled together and used as monthly replicates (Tables 1 and 2).
3.2 Variation and correlation between population non-genetic characters and seawater conditions
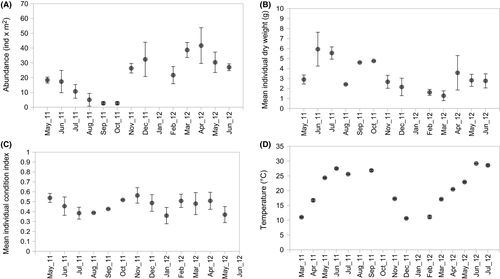
The total abundance of C. robusta in the Fusaro Lagoon fluctuated considerably during the sampling time (Figure 2a). From spring to early autumn (May–October 2011), species abundance underwent a gradual and slow decline, until the population dropped to the minimum observed values from August to October 2011. Species abundance decreased between May and June in the two sampling years (2011 and 2012), suggesting a specific trend occurring in this season of the year. Rapid peak abundance was recorded in October–November 2011, promptly followed by a second major peak from February to May 2012 (Figure 2a). At the beginning of the observation period, the mean individual dry weight (mDW) showed two three-month periods of increment (May–July 2011 and August–October 2011), indicative of settlement and growth of consecutive generations (Figure 2b). The value of mDW decreased constantly from November 2011 to March 2012, followed by a further increase between April and June 2012, but lower than in the same months of 2011. The mean individual Condition Index (mCI) displayed a sinusoidal curve across the 0.46 cutoff value (Figure 2c) during the sampling period, with maximum values in May and November 2011 (0.538 and 0.563, respectively) and minimum values in February and June 2012 (0.360 and 0.370, respectively). Sea surface temperature (T) followed a typical seasonal curve (Figure 2d). On average, considering the period of March–July, year 2012 (mean T°C = 23.65, SD = 4.8) was warmer than 2011 (mean T°C = 21.04, SD = 6.4).
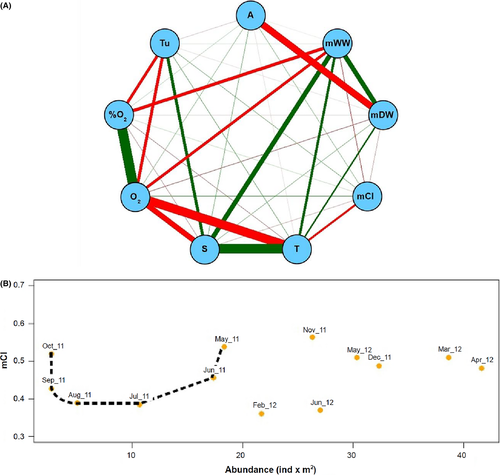
To evaluate the statistical inter-dependency between the variables herein measured, a cross-correlation matrix of the observed data was built by means of Pearson's r (Figure 3a). Population abundance significantly (p < 0.05) anticorrelated with mDW, suggesting reduced individual biomass in high-density aggregates; in turn, positive correlation (p < 0.05) was depicted between mDW and mWW. The only significant (p < 0.05) positive correlation between biological and environmental parameters was detected between mWW and salinity. Temperature showed a weak negative correlation with mCI (r = 0.40890214) (Figure 3a). The correlation between mCI and population abundance in the Fusaro Lagoon was maximum in November 2011 and April 2012 (Figure 3b). Additionally, values of mCI followed a U-shaped trend between May and October 2011, in concomitance with the progressive decline of species abundance (Figures 2a and 3b). This trend was not evident in 2012, maybe due to lack of summer samples. In February and June 2012, mCI correlation was peculiarly low in concomitance with a period of relatively high population abundance, whereas mCI was constantly around a 0.5 value in other months of the year 2012. However, it is of note that abundance estimates in February and June 2012 are the lowest in 2012, although higher than during most months of 2011 (Figures 2a and 3b).
3.3 Temporal changes in genetic composition
The sequencing of 80 ITS-2 fragments resulted in 16 distinct haplotypes, with an overall haplotype diversity of 0.827 and an overall nucleotide diversity of 0.05078 (Table 2). The expected heterozygosity value (He) decreased during the observed abundance decline period detected from May to October 2011, and remained relatively low until November 2011. The inbreeding coefficient Fis peaked in April and May in both sampling years, and decreased in winter months, with the exception of December 2011 (Table 2).
| Sample | Microsatellites | ITS-2 | ||||||
|---|---|---|---|---|---|---|---|---|
| N | Na | PrA | H e | H o | F is | N ITS-2 | G ITS-2 | |
| May 2011 | 70 | 63 | 12 | 0.874 | 0.640 | 0.590 | 1 | 1 |
| June 2011 | 43 | 38 | 5 | 0.387 | 0.697 | 0.487 | 9 | 8 |
| July 2011 | 34 | 22 | 1.5 | 0.423 | 0.835 | 0.435 | 4 | 4 |
| August 2011 | 47 | 45 | 6 | 0.31 | 0.831 | 0.511 | 2 | 2 |
| September 2011 | 23 | 19 | 2 | 0.3 | 0.736 | 0.415 | 2 | 2 |
| October 2011 | 23 | 22 | 3 | 0.295 | 0.716 | 0.413 | 3 | 3 |
| November 2011 | 104 | 93 | 21 | 0.374 | 0.812 | 0.356 | 9 | 6 |
| December 2011 | 48 | 43 | 14 | 0.355 | 0.822 | 0.596 | 8 | 5 |
| February 2012 | 87 | 80 | 9 | 0.336 | 0.772 | 0.305 | 7 | 5 |
| March 2012 | 112 | 100 | 12 | 0.383 | 0.816 | 0.336 | 9 | 5 |
| April 2012 | 25 | 21 | 7 | 0.404 | 0.835 | 0.586 | 10 | 6 |
| May 2012 | 54 | 51 | 13 | 0.446 | 0.850 | 0.581 | 8 | 5 |
| June 2012 | 99 | 88 | 20 | 0.354 | 0.788 | 0.472 | 8 | 6 |
Note
- Number of individuals analyzed (N), number of alleles (Na), number of private alleles (PrA), values of expected and observed heterozygosity (He and Ho), inbreeding coefficient (Fis), number of ITS-2 sequenced individuals (NITS-2), and number of ITS-2 genotypes (GITS-2) are reported.
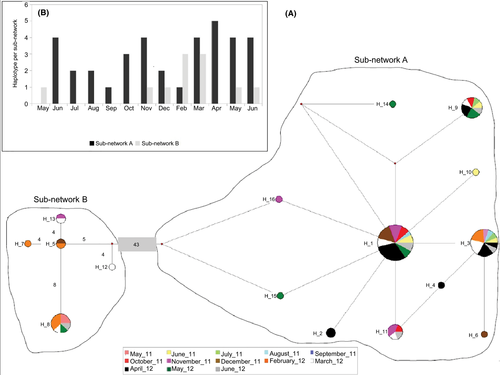
The ITS-2 median-joining network resulted in two sub-networks, named sub-network A and sub-network B, separated by 43 mutated positions and by two median vectors that indicate unsampled or extinct samples (Figure 4a). Sub-network A includes 11 strictly connected haplotypes (Figure 4a, right) sampled during the entire period under investigation, except May 2011 (Figure 4b). Sub-network B includes five loosely related haplotypes (Figure 4a, left); no haplotype belonging to the sub-network B was sampled from June to October 2011 and in April 2012 (Figure 4b, right).
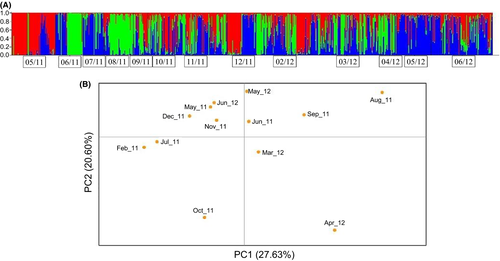
To further estimate the small-scale temporal structure of C. robusta in the Fusaro Lagoon along the 13 months period, eight neutral microsatellite independent loci (Table 2) were employed. Neutrality of loci was tested using both the LOSITAN and the BAYESCAN approaches. LOSITAN putatively indicated Cin-5 and Cin-67 under balancing and positive selection, respectively. The BAYESCAN approach confirmed only Cin-67 being under moderate positive selection. The principal coordinates analysis (PCoA) performed using Cin-67 alone did not generate any clear difference compared with the analysis performed with all loci (data not shown). Evanno's method (Evanno et al., 2005) identified three distinct genetic clusters (red, blue, and green in Figure 5a). The temporal genetic structure described by the three clusters was highly variable in terms of individual assignment to each distinct cluster. A 0.8 was used to assert the assignation of each individual to any of the clusters (Table 3). Specimens in May 2011 were preferentially assigned to clusters 1 and 3. From June to August 2011, the majority of individuals in the analysis were assigned to cluster 2 and cluster 3, with few individuals assigned to cluster 1. No specimens were assigned to cluster 1 from June to October 2011 and in March 2012. Clusters 2 and 3 were represented by at least one specimen during the whole period of observation. The majority of individuals in May 2012 were assigned to cluster 3. Except for February 2012, when the three clusters were almost equally represented, dominance or co-dominance of one or two clusters was detected in all months. Unassigned individuals exceeded the amount of cluster-assigned ones during September–October 2011.
| Month | Cluster 1 | Cluster 2 | Cluster 3 | Unassigned |
|---|---|---|---|---|
| May 2011 | 26 (48.15%) | 1 (1.85%) | 27 (50.0%) | 0 |
| June 2011 | 0 | 23 (53.49%) | 17 (39.53%) | 3 (6.98%) |
| July 2011 | 0 | 14 (41.17%) | 5 (14.71%) | 15 (44.12%) |
| August 2011 | 0 | 34 (72.34%) | 3 (6.38%) | 10 (21.28%) |
| September 2011 | 0 | 8 (34.78%) | 1 (4.35%) | 14 (60.87%) |
| October 2011 | 0 | 7 (22.58%) | 1 (3.23%) | 23 (74.19%) |
| November 2011 | 5 (4.81%) | 16 (15.38%) | 37 (35.58%) | 46 (44.23%) |
| December 2011 | 20 (43.48%) | 2 (4.35%) | 20 (43.48%) | 4 (8.69%) |
| February 2012 | 16 (18.39%) | 24 (27.58%) | 20 (23.00%) | 27 (31.03%) |
| March 2012 | 0 | 28 (22.76%) | 43 (34.96%) | 52 (42.28%) |
| April 2012 | 26 (37.14%) | 1 (1.43%) | 27 (38.57%) | 16 (22.86%) |
| May 2012 | 1 (1.27%) | 11 (13.92%) | 58 (73.42%) | 9 (11.39%) |
| June 2012 | 2 (2.02%) | 3 (3.03%) | 63 (63.64%) | 31 (31.31%) |
Note
- Data are based on the Structure assignation probability. A probability threshold of 0.8 was set to assign individuals to clusters. Individuals having an assignation probability below 0.8 were ascribed to the “Unassigned” category.
PCoA was applied to the samples in order to detect signatures of temporal differentiation between populations (Figure 5b). The two first axes of the PCoA account for 27.63% and 20.60% of the total variability, respectively. Nonetheless, no specific temporal grouping was shown by the PCoA except for monthly replicates (May and June) that grouped at the center of the plot. AMOVA of monthly samples indicated low differentiation among temporal populations and high differentiation within populations (Table 4).
| Source of variation | df | Sum of squares | Variance components | Percentage of variation |
|---|---|---|---|---|
| Among monthly samples | 8 | 12.126 | 0.00782 Va | 1.94 |
| Among individuals within monthly samples | 595 | 294.625 | 0.09982 Vb | 24.76 |
| Within individuals | 604 | 178.500 | 0.29553 Vc | 73.30 |
| Total | 1,207 | 485.251 | 0.40317 |
Note
- df: degrees of freedom. The total variance has been partitioned into three components: Va is the among-samples component of variance, Vb is the among-individuals (within samples) component of variance, and Vc is the within-individuals component of variance.
3.4 Correlation of genetic lineages with physiological, physico-chemical, and toxicological data
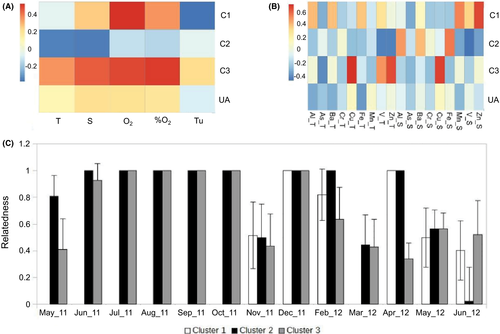
Using data on accumulation of heavy metals in tunica and soma of C. robusta from our previous study (Arienzo et al., 2014), we correlated the frequency of individuals assigned to clusters 1–3 (or unassigned) with physico-chemical factors and concentration of heavy metals in tissues. Cluster 1 showed significant positive correlation with oxygen and anticorrelation with turbidity (Figure 6a, Supporting Information Table S4). Cluster 2 did not correlate positively with any environmental variables, but it anticorrelated with salinity (Figure 6a, Supporting Information Table S4). Cluster 3 showed a positive correlation with salinity and oxygen (Figure 6a, Supporting Information Table S4). Cluster 1 correlated with zinc concentration (soma), and cluster 3 with copper (tunic and soma) and zinc (tunic) (Figure 6b, Supporting Information Table S5). Cluster 2 showed no positive correlation, but it strongly anticorrelated with vanadium (soma and tunic) and zinc (tunic) (Figure 6b, Supporting Information Table S5). The within-cluster kinship was analyzed by means of the parameter relatedness (R) (Figure 6c). The three clusters behave in a significantly different way along the studied time span. With the exception of May 2011 (cluster 3), both clusters 2 and 3 showed high R (Figure 6c) from June to October 2011. The within-cluster R remained high until the end of 2011 for both clusters. Concerning cluster 1, R was high from December 2011 to April 2012 (despite no individuals assigned to cluster 1 were found in March 2012) and dropped during May–June 2012.
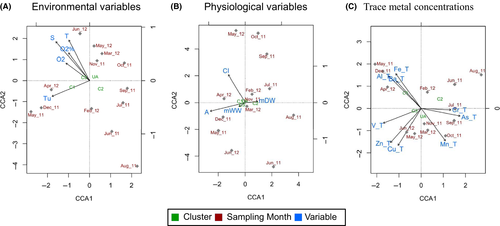
We interrogated the dataset for cluster–environment preferences by performing a canonical correspondence analysis (CCA) of the genetic, physiological, and environmental data herein collected, plus those from Arienzo et al. (2014). Although no clear results were found using environmental (Figure 7a) and non-genetic biological values (Figure 7b), three Evanno's identified clusters (Figure 5) behave differently with reference to accumulation of heavy metals, as expected from the R results (Figure 7c). In particular, cluster 1 showed a strong positive correlation with the presence of iron, barium, and aluminum metals in the tunic in May and December 2011 and in April 2012 (Figure 7c). Of note, cluster 1 reached its maximum abundance during the same months (Table 4). Cluster 2 shows strong correlation with aluminum in soma during summer 2011 (June and August) (Figure 7c). Additionally, Cluster 3 and unassigned samples show weak correlations with heavy metal concentration (Figure 7c). Finally, the partitioning of contingency coefficient for each of the three CCAs was analyzed. Results showed low (<40%) constrained values for the biological and environmental CCAs, and very high (87.75%) constrained value in the case of the trace metal CCA (Supporting Information Table S6).
4 DISCUSSION
The most salient finding of this study was the rapid temporal variation in the patterns and degree of population structure, indicating recruitment from unsampled sources or sweepstakes reproductive success. The occurrence of multiple genetic lineages with specific tolerance to environmental stressors may provide advantage to the species in marine habitats with strong temporal fluctuations and human-mediated alteration. Although seasonality was not statistically tested due to lack of replicates, preliminary evidence of temporal patterns of genetic composition appears important for understanding the presence and abundance of C. robusta as well as from the point of view of biodiversity conservation and biological invasion management.
4.1 Demography of C. robusta in the Fusaro Lagoon
No evidence of genetic differentiation was observed between sampling sites. This finding suggests that the distance between the sampling locations in the lagoon system falls within the range of passive dispersal of C. robusta eggs and larvae (Johannesson et al., 2018). Seasonal differences in abundance and biomass may be explained by varying habitat type, with slight differences in the influence of substratum and pollution on the survival of local settlements (Chase, Dijkstra, & Harris, 2016). The Peschiera Romana (FPR) collection site, where the species is always present, is relatively less disturbed by anthropic activities than FFM and FCV.
The annual trend is typical of warm waters, in which summer months limit the abundance of the species, maybe because of the species susceptibility to intense direct light (Jofré Madariaga, Rivadeneira, Tala, & Thiel, 2014). Using combined analysis of biometrics traits and environmental variables, wet weight resulted to be particularly vulnerable to changes in salinity, which may cause die-off of larger individuals and survival of smaller ones. Ciona robusta, whose optimal salinity in the Mediterranean Sea is 35‰, is known to reduce oxygen consumption rate to zero when salinity reaches 19‰ (Marin, Bressan, Beghi, & Brunetti, 1987; Shumway, 1978). In contrast, variation in dry weight (mDW) was not related to changes in the environmental parameters analyzed in this study, suggesting that other factors that operate in energy transfer and growth rate, such as food resources and competition for space, may influence this parameter in C. robusta. The decrease in mDW observed between October 2011 and March 2012 appears to be related to the increase in species abundance occurring in the same period, following in turn a typical yearly pattern picking up in late spring. As indicated by the Condition Index (CI), warm seawater conditions strongly limit population demography. Previously used in C. intestinalis (sensu Millar, 1953) as a suitable proxy for the energetic status of the analyzed population (Petersen et al., 1995), the CI was herein a reliable indicator of population health. Taking the various parameters together, the energetic variation from October to November 2011 (mCI = 0.563, abundance = 59.848, mDW = 2.663) is indicative of the birth of a new generation during months featuring favorable eco-physiological conditions (Toscano, 2014).
4.2 Population genetics
Although no temporal differentiation among samples was detected using either ITS-2 or microsatellites, both markers were able to identify the presence of multiple genetic pools: sub-networks A and B (ITS-2) and clusters 1–3 (microsatellites). Considering the temporal occurrence of these genetic pools, it is likely that sub-network B corresponds to cluster 1, whereas sub-network A corresponds to both clusters 2 and 3. However, as the individuals used for ITS-2 and microsatellite analyses were not the same, we are unable to clarify the issue at this stage. Mean relatedness of clusters 2 and 3 was constantly high from May 2011 to October of the same year, while becoming much more variable and relatively lower from November 2011 to June 2012. A likely explanation for the population persistence of C. robusta in the Fusaro Lagoon may be the sporadic chance recruitment from external populations or the presence of one or more unsampled pools of specimens internal to the lagoon. Of note, the number of individuals unassigned to any of the clusters suddenly doubled in November (from 23 to 46) (Table 4), evoking recruitment from unsampled internal or external sources. No C. robusta population inhabits close-by surroundings of the Fusaro Lagoon, and the closest known population (Castel Volturno) is located ca. 20 km north along the Tyrrhenian Sea coast (Caputi et al., 2015). However, the lagoon is used for mussel cultivation, making services for mussel growing, transport, and harvesting possible recruiting sources.
Recruits primarily belong to cluster 1 although not exclusively, and multiple recruitments may have occurred from November 2011 to June 2012. Being our sampling limited to a short time period (13-month), we are unable to decipher whether the abovementioned events persist over time and represent a recurring pattern of the C. robusta population in the Fusaro Lagoon. In a different scheme, the observed temporal change in genetic composition of C. robusta might reflect a process of sweepstakes reproductive success, in which a subset of the population contributes the majority of offspring to subsequent generations (Hedgecock & Pudovkin, 2011), as already suggested by the existence of site-specific haplotypes (Zhan et al., 2012). In broadcast-spawning marine invertebrates with large effective population size (Berná & Alvarez-Valin, 2014; Tsagkogeorga, Cahais, & Galtier, 2012) and low level of dispersal potential, this hypothesis deserves further investigation.
4.3 Tolerance to trace metals is increased in specific genotypes
Our results indicate that the three genetic clusters identified in the composition of the population of C. robusta respond differently to environmental variables. Interestingly, cluster 1 showed a positive and negative correlation with oxygen and turbidity, respectively. In contrast, the other two clusters correlated negatively with salinity and temperature (cluster 2) or positively with all environmental variables (cluster 3). These findings denote the coexistence of genetic lineages with different ecological profiles, likely representing genotypes with varying degrees of vulnerability to environmental factors. However, by CCAs, only trace metals may be defined as constrained explicatory variables of cluster behavior along time. Indeed, cluster 1, and to less extent cluster 2, strongly correlated with specific heavy metals accumulated in tunic and body. Of note, cluster 3 showed no correspondence with metal ions. Thus, the three clusters seem to possess distinct abilities to cope with environmental stressors in a way that maximizes fitness by ensuring species survival.
Few experimental works focused on the relationships between the genetic composition of tunicate populations and their response to stressors, and none of them analyzed the fine temporal scale of this subject. By studying the response of introduced versus native marine invertebrates to abiotic stressors at global scale, Lenz et al. (2011) reported that introduced organisms are usually more resistant to ecosystem disturbance than native ones. In ascidians, clear differences in susceptibility to stressors are observed during the life cycle, with immature stages being less tolerant than adults (Pineda et al., 2012). Herein, we provide evidence of distinct genetic pools within a confined population of the ascidian, C. robusta, and present correlative data suggesting that these lineages show differential responses to stressors.
Tolerance to trace metals may increase Ciona robusta survival in a polluted environment like the Fusaro Lagoon (Arienzo et al., 2014). It is also possible that bioaccumulation of trace metals is instrumental to a defense mechanism against natural predators. For example, high vanadium concentration in body and tunic could contribute in making ascidians unpalatable or toxic (Stoecker, 1980). It has been proved also that vanadium contents in C. robusta tissues are independent of the contents of the other metals (Arienzo et al., 2014), suggesting specific uptake and incorporation of vanadium. Our data suggest that specific genotypes may show different ability toward vanadium accumulation; in particular, cluster 2 strongly anticorrelated with vanadium concentration, whereas cluster 3 show positive correlation with vanadium in the tunic.
5 CONCLUSIONS
In ascidians, several mechanisms may have a substantial effect on the adaptation to small-scale temporal variation. A strong adaptive response to stressors has been reported in adult specimens of the ascidians, S. plicata and M. squamiger (Pineda et al., 2012). Signatures of directional selection were recently found both at genomic and at population levels (Lin et al., 2017). Moreover, environmental epigenetic control of gene expression has been recently proposed to have a pivotal role in rapid adaptation during biological invasions (Pu & Zhan, 2017). Genetic pools that are differentially adapted to environmental perturbations may contribute to the recruitment and abundance of C. robusta and to its invasive potential (Reem, Douek, Katzir, & Rinkevich, 2013; Rius & Darling, 2014). Temporal patterns of genetic structure herein described are similar to those recently described in an introduced population of the invasive ascidian species, S. plicata, in North Carolina (Pineda, Lorente, López-Legentil, Palacín, & Turon, 2016; Pineda, Turon, Pérez-Portela, & López-Legentil, 2016). Traditionally, salinity and temperature are considered the main environmental factors driving C. robusta distribution (Dybern, 1965; Jofré Madariaga et al., 2014), a theoretical association that is reinforced by the significant correlation between physico-chemical and biological parameters reported in this work. However, heavy metals and agricultural pesticide may represent a primary source of stress for this species, at least in areas affected by anthropogenic pollution (Gallo, Silvestre, Cuomo, Papoff, & Tosti, 2011; Zega et al., 2009). In aquatic invertebrates, the role of heavy metal stress in shaping the genetic structure of populations has been demonstrated in various phyla (Forbes, Moller, & Depledge, 1995; Lopes, Baird, & Ribeiro, 2006; Maltby, Calow, Cosgrove, & Pindar, 1987; Maltby & Crane, 1994; Reinikainen, Hietala, & Walls, 1998). Herein, cyclic variation in the genetic composition of C. robusta populations could reflect either a response or an adaptation mechanism to polluted habitats subject to strong temporal variation.
ACKNOWLEDGMENTS
Financial support for this work was partly provided by EC-FP7 Network of Excellence “Assemble” (JRA3 “Improving the provision of genetic and genomic resources”) and by institutional funds. We are grateful to Roberta Piredda, Valeria Ruggiero, Ivana Zucchetti, and Lazaro Marin Guirao for their valuable comments and suggestions. We also thank Fabio Crocetta for help in collecting animals.


