Spatial and Single-Cell Transcriptomics Reveals the Regional Division of the Spatial Structure of MASH Fibrosis
Handling Editor: Dr. Luca Valenti
Funding: This study was supported by the Youth Program of the National Nature Science Foundation of China (grant number 82000556).
Jin-zhong Li, Liu Yang and Min-xi Xiao have contributed equally to this work.
ABSTRACT
Objective
To elucidate the regional distribution of metabolic dysfunction-associated steatohepatitis (MASH) fibrosis within the liver and to identify potential therapeutic targets for MASH fibrosis.
Methods
Liver sections from healthy controls, patients with simple steatosis and MASH patients were analysed using spatial transcriptomics integrated with single-cell RNA-seq.
Results
Spatial transcriptomics analysis of liver tissues revealed that the fibrotic region (Cluster 9) was primarily distributed in lobules, with some fibrosis also found in the surrounding area. Integration of the single-cell-sequencing data set (GSE189175) showed a greater proportion of inflammatory cells (Kupffer cells and T cells) and myofibroblasts in MASH. Six genes, showing high- or low-specific expression in Cluster 9, namely, ADAMTSL2, PTGDS, S100A6, PPP1R1A, ASS1 and G6PC, were identified in combination with pathology. The average expression levels of ADAMTSL2, PTGDS and S100A6 on the pathological HE staining map were positively correlated with the increase in the degree of fibrosis and aligned strongly with the distribution of fibrosis. ADAMTSL2+ myofibroblasts play a role in TNF signalling pathways and in the production of ECM structural components. Pseudotime analysis indicated that in the early stages of MASH, infiltration by T cells and Kupffer cells triggers a significant inflammatory response. Subsequently, this inflammation leads to the activation of hepatic stellate cells (HSCs), transforming them into myofibroblasts and promoting the development of liver fibrosis.
Conclusion
This study is the first to characterise lineage-specific changes in gene expression, subpopulation composition, and pseudotime analysis in MASH fibrosis and reveals potential therapeutic targets for this condition.
Abbreviations
-
- ADAMTSL2
-
- a disintegrin and metalloproteinase with thrombospondin motifs like 2
-
- BP
-
- biological processes
-
- CC
-
- cell composition
-
- ECM
-
- extracellular matrix
-
- GO
-
- Gene Ontology
-
- HCC
-
- hepatocellular carcinoma
-
- HSCs
-
- hepatic stellate cells
-
- KEGG
-
- Kyoto Encyclopedia of Genes and Genomes
-
- LAMs
-
- lipid-associated macrophages
-
- MASH
-
- metabolic dysfunction-associated steatohepatitis
-
- MASLD
-
- metabolic dysfunction-associated steatotic liver disease
-
- MF
-
- molecular function
-
- PCA
-
- principal component analysis
-
- TFs
-
- transcription factors
-
- t-SNE
-
- t-distributed stochastic neighbour embedding
-
- UMAP
-
- uniform manifold approximation and projection
-
- UMIs
-
- unique molecular identifiers
Summary
- This study describes the delineation of fibrotic areas and specific biomarkers in the progression of MASH, revealing the trajectories of cellular differentiation and development, as well as the roles of these cells in the development of MASLD fibrosis.
1 Introduction
Metabolic dysfunction-associated steatotic liver disease (MASLD) has become the most common chronic liver disease worldwide; the pooled global prevalence of MASLD is 29.8% [1]. Compared with simple steatosis, metabolic dysfunction-associated steatohepatitis (MASH) presents with inflammation, balloon-like hepatocytes and necrosis and gradually develops into fibrosis with excessive accumulation of extracellular matrix (ECM) proteins dominated by hepatic stellate cells (HSCs) [2]. Research shows that the survival period of MASH patients with fibrosis is significantly shorter than that of patients without fibrosis, suggesting that liver fibrosis is the only liver pathological change that accurately predicts adverse outcomes in MASLD [3, 4].
In recent years, the combination of single-cell RNA-seq with spatial measurements of external landmark genes has yielded particularly accurate information [5-7]. The techniques were used to reconstruct a zonation map of human hepatocytes with high spatial resolution and determine the zonated features of proteins, metabolites and other cellular properties [8]. Single-cell and spatial transcriptomic studies of MASLD mouse and human liver samples have revealed that hepatocytes and non-parenchymal cells (HSCs, macrophages and endothelial cells) display heterogeneous responses in individuals with MASLD [9]. Lipid-associated macrophages are induced in the steatotic region of murine and human livers, while Kupffer cell development depends crucially on crosstalk of these cells with HSCs via the evolutionarily conserved ALK1-BMP9/10 axis [10]. In addition, TREM2+CD9+ scar-associated macrophages are derived from the recruitment and differentiation of circulating monocytes, display a profibrotic phenotype and expand early during the course of liver disease progression [11]. Furthermore, histological studies have revealed that a subset of hepatocytes in a specific region is more prone to fat accumulation, fibrosis progression and hepatocarcinogenesis [12]. However, it is still unclear whether the fibrotic spatial arrangement of the changes found in MASLD has a clear regional division, whether single-cell differentiation and development trajectory correlate with spatial location, and whether cells in different regions communicate with each other.
In this work, we performed spatial transcriptome sequencing and compared the results with pathological findings obtained from liver specimens among healthy controls, patients with simple steatosis, and patients with MASH. Analyses were then conducted in conjunction with single-cell RNA sequencing. Our work reveals that lineage-specific changes in gene expression, subpopulation composition and intercellular communication occur in MASH fibrosis.
2 Materials and Methods
2.1 Patient Selection
Patients whose liver biopsies were obtained between January 2019 and June 2022 were screened by two researchers specialising in liver disease. The inclusion criterion was liver biopsy histology indicating fatty liver. The exclusion criteria were as follows: (1) the presence of other viral liver disease (hepatitis A, hepatitis C and hepatitis E) or HIV; (2) MASLD with increased alcohol intake (alcohol intake exceeding 30–60 g/day in males and 20–50 g/day in females every week); (3) autoimmune hepatitis, drug-induced liver injury, Wilson's disease, total parenteral nutrition or toxic liver disease; (4) malignant tumour and (5) other autoimmune diseases. Healthy control liver tissue was obtained from patients with unconjugated hyperbilirubinemia whose liver biopsy histology indicated Gilbert syndrome with normal liver tissue. The biopsy samples were fixed in formalin, embedded in paraffin and stained with haematoxylin–eosin, Oil Red O, Mesh and Masson. All liver tissue sections were assigned the steatosis, activity and fibrosis (SAF) scoring system by two liver pathologists [13]. Disagreements on the pathology scores were discussed or resolved with the assistance of a third pathologist in the group. Samples from healthy controls, patients with simple steatosis and MASH were used for space transcriptome sequencing.
2.2 Spatial Transcriptomic Assay
Each formalin-fixed paraffin-embedded (FFPE) tissue sample was embedded, sectioned and placed on a capture area of a gene expression slide. Standard fixation and staining techniques were used to visualise tissue sections on slides under brightfield microscopy according to the recommended protocol CG000409. FFPE tissues were permeabilised to release ligated probe pairs that bind to the spatially barcoded oligonucleotides present on the spots. Spatial barcodes were added via an extension reaction. The barcoded molecules were then pooled and subjected to downstream processing to generate a sequencing-ready library according to the recommended protocol CG000407. The resulting 10× barcoded library was compatible with standard NGS short-read sequencing on Illumina sequencers for massive transcriptional profiling of entire tissue sections.
2.3 Visium Data Processing
In this study, Space Ranger (version 1.3.1) was used for data preprocessing, gene expression quantification and point identification, after which the corresponding gene expression of the effective cells was revealed. The Seurat package (version 4.1.1) was used to analyse and cluster the spots. The gene expression matrix was pre-processed using the Seurat SCTransform function [14]. The top 2000 highly variable genes (top 2000) were extracted for principal component analysis (PCA) to reduce the dimensionality of the data, and the top 15 significant principal components were subjected to cluster analysis at 0.5 resolution. Uniform manifold approximation and projection (UMAP) and t-distributed stochastic neighbour embedding (t-SNE) were then used to visualise the clusters. Marker genes for each cluster and subgroup were identified by comparing the expression of genes in spots from specific clusters or subgroups to that of others using the Seurat FindMarkers function and filtered using p < 0.05 and log-scale fold change ≥ 0.25 as the threshold.
2.4 Enrichment Analysis
ClusterProfiler software was used to enrich cluster markers by gene ontology (GO) [15] and Kyoto Encyclopedia of Genes and Genomes (KEGG) [16]. The marker genes identified using the Seurat software were adjusted using the Benjamini–Hochberg multiple test according to the Wilcoxon test and log-scale folding change (logFC. threshold ≥ 0.25). The results were visualised using the R package.
2.5 Cell Clustering and Deconvolution Analysis
The R package Seurat (v4.03) was used to cluster the cells in the merged matrix. Cells with < 300 genes, or more than 25% of mitochondrial expression were first filtered out as low-quality cells (Figure S1). Normalised data with default parameters were used to normalise the expression level for each cell [17]. The FindIntegrationAnchors and IntegrateData functions were used to integrate the samples prepared using different 10× Chromium chemistries. The ScaleData function was used to scale and centre the counts in the data set. PCA was performed on the genes that showed variable expression, and the first 30 PCs were used for cell clustering and UMAP dimensional reduction. The cluster marker genes were identified using the FindAllMarkers function. The cell types were annotated by overlapping the cluster markers with the canonical cell type signature genes. An anchor-based integration method was implemented for the integration of spatial RNA-seq data with matched scRNA-seq data using the FindIntegrationAnchors command, and the cell type labels were then transferred to the spatial data using the TransferData command [18]. Cell-type prediction values for spatial RNA-seq spots were saved as an assay and used in further analysis.
2.6 Cell–Cell Interactions
CellPhoneDB, a curated database of ligands, receptors and their subunit interactions, was used to identify ligand–receptor interactions that occur among the gene products expressed in the samples [19]. Following the identification of different cell types in the spatial transcriptomic data, we used the ‘statistical_analysis’ function in CellPhoneDB v2.0 to calculate the likelihood of interaction between each pair of signalling cells. Intercellular communication was modelled using the law of mass action to bind gene expression to receptor ligands and their cofactors of known signals. The number of ligand–receptor pairs was deduced from the average gene expression between cell groups.
2.7 Pseudotime Analysis
We performed pseudotime analysis using Monocle v3 software with the default parameters. First, the UMAP algorithm was used to reduce the dimensionality of the data. We then inferred developmental trajectories and subset cells based on their branches in the trajectory.
2.8 Transcription Factor Regulon Analysis
Analysis of the regulatory network and regulon activity was performed by pySCENIC [20]. The regulon activity (measured in AUC) was analysed using the AUCell module of pySCENIC, and the active regulons were determined based on the AUCell default threshold. The differentially expressed regulon was identified by the Wilcoxon rank-sum test in the ‘FindAllMarkers’ function in the R package Seurat with the following parameters: min.pct = 0.1, logfc.threshold = 0.25, pseudocount.use = F and only.pos = T. A heatmap showing the scaled expression of regulon activity was generated.
3 Results
3.1 The Spatial Transcriptome Reveals the Spatial Distribution Characteristics of MASH Fibrosis
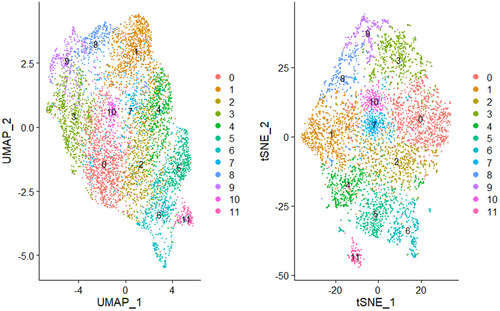
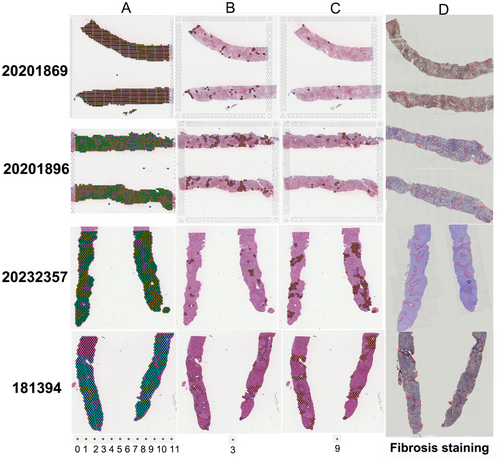
Twelve samples—four from healthy controls, four from patients with simple steatosis and four from patients with MASH—were subjected to spatial transcriptome sequencing. Following quality inspection, five of the samples were ultimately selected for use in the analysis: one from a healthy control (pathology number: 191518), one from a simple steatosis patient (pathology number: 20201869, SAF score: S2A0F1) and three from MASH patients (pathology numbers: 20201896, SAF score: S2A4F2; 20 232 357, SAF score: S2A4F3; 181 394, SAF score: S1A4F4). The unique molecular identifiers (UMIs) corresponding to each spot of every chip were detected as depicted in Figure S2. PCA linear dimension reduction was conducted on the spatial transcriptomic data using Seurat_4.1.1, and the elbowplot function was used to select the best resolution parameters for cluster analysis (Figure S3). The clustering results were visualised using t-SNE and UMAP, as demonstrated in Figure 1. After the first 30 principal components, which showed stable standard deviations, were selected for downstream data analysis, the samples were divided into 12 clusters via dimensionality reduction and clustering, as illustrated in Figure 2A. The regions of Clusters 3 and 9 were found to highly overlap with the inflammatory and fibrotic regions, respectively, identified by hepatology (Figure 2B–D). The classification of identical RNA capture spots as fibrotic by conventional histology and spatial transcriptomics exhibited remarkable consistency (fibrosis: 80% mean congruency (Figure S4)), indicating the potential of spatial transcriptomics for delineating fibrotic tissue regions in patients with MASLD and aiding in the characterisation of tissue types when combined with conventional histological assessment. Fibrosis in MASH was primarily distributed in the lobules, and a small amount was also observed in the portal area.
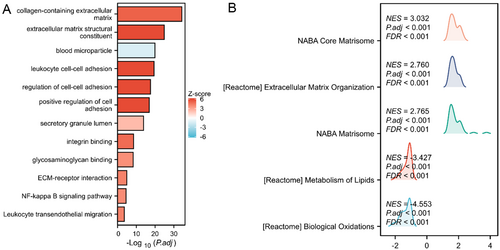
Subsequently, a functional analysis of Cluster 9 was conducted. GO analysis revealed that biological processes (BPs), which included ECM receptor interaction, were mainly concentrated in the ECM and in structural tissues. Molecular functions (MFs) included functions related to glycosaminoglycans and integrins and were mainly enriched in ECM structural components and signal molecule transmission. The cell composition (CC) terms were mainly related to the positive regulation of cell adhesion, as shown in Figure 3A. According to the KEGG analysis, the differentially expressed genes were predominantly enriched in the NF-κ B signalling pathway and ECM-receptor interaction, as illustrated in Figure 3A. GSEA enrichment analysis focused on ECM-related pathways (Figure 3B) such as NABA Core Matrisome, Extracellular Matrix Organisation, lipid metabolism and biological oxidation. NABA Core Matrisome and Extracellular Matrix Organisation represent collections of genes that encode proteins associated with the core ECM, ECM glycoproteins and related structural elements. Through differential analysis of subgroups, 303 differentially expressed genes were obtained from Cluster 9. In summary, the functional clustering results preliminarily confirmed Cluster 9 as the fibrosis region.
3.2 Single-Cell and Spatial Transcriptomics Reveal the Key Role of HSCs in MASH Fibrosis
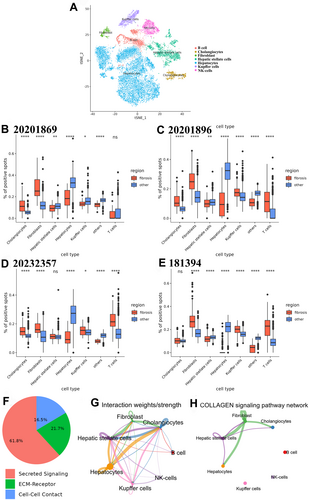
Through integration of spatial transcriptome data with the single cell-sequencing data set GSE189175, a total of seven cell types were identified from GSE189175 (Figure 4A). Compared to those in the healthy control and simple steatosis groups, the proportions of inflammatory cells, such as Kupffer cells and T cells, increased in the MASH group, whereas the proportion of HSCs decreased, and the proportion of myofibroblasts significantly increased (Figure 4B–E). Cell communication analysis revealed that the main type of cell-to-cell communication, including endocrine, paracrine and autocrine communication, was secretion, followed by ECM-receptor cell communication (Figure 4F). In MASH fibrosis, hepatocytes, HSCs, myofibroblasts and bile duct cells exhibited strong communication with each other (Figure 4G), and hepatocytes, HSCs and myofibroblasts were the primary cell types communicating via collagen signalling pathways (Figure 4H). Additional communication pathways included the FN1, LAMININ, PTPRM, THBS and VISFATIN signalling pathway networks (Figure S5).
3.3 Key Genes Specifically Overexpressed in the MASH Fibrosis Region
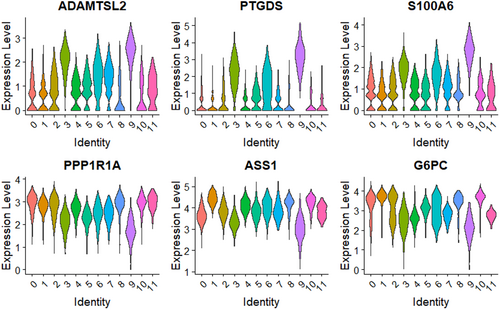
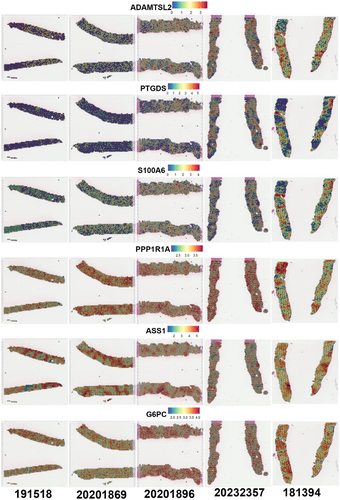
Six genes with high- and low-specific expression in Cluster 9, namely, ADAMTSL2, PTGDS, S100A6, PPP1R1A, ASS1 and G6PC, were screened in combination with pathology (Figure 5). Notably, in addition to being highly expressed in Cluster 9, ADAMTSL2, PTGDS and S100A6 also exhibited relatively high expression in Cluster 3, while PPP1R1A, ASS1 and G6PC showed the opposite pattern. The average expression levels of ADAMTSL2, PTGDS and S100A6 indicated by the pathological HE staining map correlated positively with the increase in the degree of fibrosis and aligned strongly with the distribution of fibrosis. Conversely, the expression levels of PPP1R1A, ASS1 or G6PC within the fibrotic region decreased as the degree of fibrosis increased (Figure 6). Overall, these findings indicate that these six genes serve as specific markers of MASLD fibrosis.
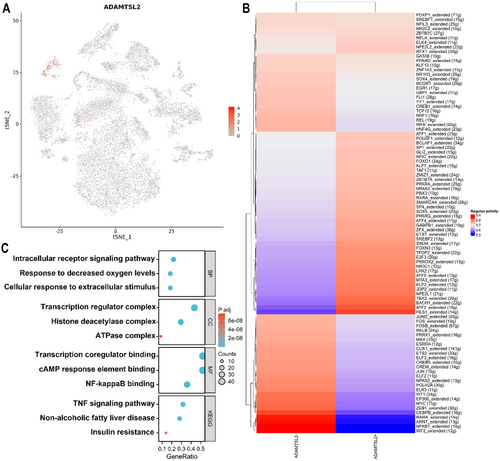
Through the analysis, it was found that the expression of six key genes varied in different cell types; ADAMTSL2 showed high specificity in myofibroblasts (Figure 7A). To investigate the potential involvement of ADAMTSL2+ myofibroblasts in liver fibrosis, SCENIC analysis was used to categorise myofibroblasts into two groups, ADAMTSL2+ and ADAMTSL2− based on the expression of ADAMTSL2. The specific transcription factors (TFs) of ADAMTSL2+/ADAMTSL2− myofibroblasts were predicted using SCENIC, and TFs with high relative activity scores were identified (Figure 7B). The numbers of ADAMTSL2+ and ADAMTSL2− myofibroblasts were positively regulated by five TFs: IRF8, FLI1, SOX4, GATA6 and TBX2. These five TFs were found to be highly expressed in Cluster 9, suggesting their potential significance as TFs for ADAMTSL2+ myofibroblasts. Subsequent analysis of the disparities in cellular signalling pathways between the two groups (Figure 7C) revealed the involvement of ADAMTSL2+ myofibroblasts in fibrosis development. Notably, ADAMTSL2+ myofibroblasts were implicated in the TNF signalling pathway and in the regulation of the production of structural constituents of the ECM.
To investigate the evolutionary relationships among MASLD cells, we used Monocle v3 to analyse the developmental trajectory of these cells. Trajectory analysis was performed to allow us to infer the pathways involved in cell-state transitions within the MASLD clusters. Pseudotemporal ordering was performed (Figure 8A) with the cell state at time 0 set as ‘hepatocyte’ on the basis of the results of the RNA velocity analysis. At the outset of the pseudotime, the majority of the cells were typical hepatocytes. As the pseudotime progressed, an increase in the number of T cells and Kupffer cells was observed. Subsequently, under the influence of T cells and Kupffer cells, the proportion of HSCs and myofibroblasts gradually increased, and the cells were clustered densely at the end of the pseudotime (Figure 8B). These findings indicate that hepatic cells experience diverse evolutionary trajectories during the progression of MASLD fibrosis. Specifically, the main contributing factor to the events that occur in the early stage of MASH is the inflammation caused by infiltration by T cells and Kupffer cells. This inflammation subsequently triggers the conversion of HSCs into myofibroblasts, leading to the initiation of liver fibrosis.
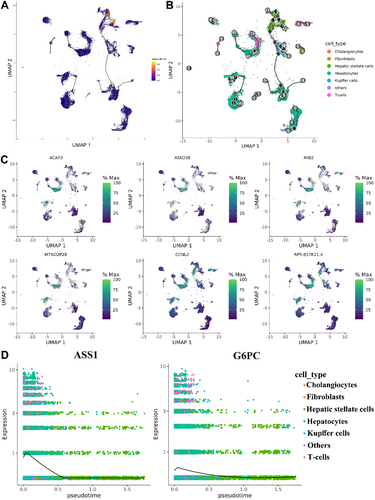
In a further search for genes that are differentially expressed across the pseudotime trajectory, we used plot cells to identify the first six genes whose expression is clearly branch-dependent. These are ACAP3, ATAD3B, MIB2, MTND2P28, CCNL2 and RP5-857K21.4 (Figure 8C). ACAP3 and RP5-857K21.4 showed obvious branch-dependence in the hepatocellular-T lymphocyte-HSCs branch, while ATAD3B, MIB2, MTND2P28 and CCNL2 showed obvious branch-dependence in the T lymphocyte/Kuffer cell-HSCs branch. By observing the regulatory roles of key genes in the trajectory of cellular development, we found that G6PC and ASS1 were highly expressed in the early stages of development of MASLD disease and expressed at low levels in the middle and late stages (Figure 8D). This finding suggests that these two genes may have antifibrotic functions, as their reduced expression may promote the progression of fibrosis.
4 Discussion
Liver fibrosis is an important turning point in the progression of MASLD. Clarification of the pathological mechanism of this disease and finding ways to provide targeted treatment for it are particularly important. This project is the first to use spatial and single-cell transcriptome data to explore the mechanism through which MASH fibrosis occurs. After dimensionality reduction and clustering, the samples used in this study were divided into 12 clusters. The fibrotic region (Cluster 9) is mainly distributed in the lobules, and a small amount can also be seen in the portal area. A previous study showed that mild fibrosis in the perisinusoidal region of the lobular acinus 3 or portal area was occasionally observed in the context of hepatocyte steatosis with or without inflammation in adults with MASLD [21]. In non-sclerotic steatohepatitis, whether alcoholic or non-alcoholic, collagen deposition often begins in the perisinusoidal area of acinar 3, and its distribution differs from that of collagen deposition in fibrosis originating from other causes that precede the development of the portal area [22]. This is consistent with our conclusion.
Based on the information provided by the spatial and single-cell-sequencing transcriptomes, we found that the proportions of HSCs and myofibroblasts in MASH patients increased significantly compared with those in healthy controls and simple steatosis patients; these cells were mainly distributed in the lobules, and infiltration of the region around the area of fibrosis by Kupffer cells also increased. In normal liver, HSCs in the perihepatic sinusoidal space are in a resting state, and their main characteristics are low proliferative activity and low collagen synthesis ability. When the liver is stimulated by inflammatory factors as a response to hepatocyte injury, Kupffer cells are activated and express cytokines and signalling molecules, primarily the inflammatory factors TNF-α, IL-1β and IL-6 and the chemokine CCL2 and its receptor CCR2, all of which participate in the recruitment of neutrophils and circulating monocytes [23, 24]. Monocytes differentiate into proinflammatory macrophages, further amplifying the liver's inflammatory response and activating surrounding HSCs through TGF-β1; this increases the collagen synthesis ability of HSCs and leads to liver fibrosis [25]. Human lipid-associated macrophages (LAMs) are found in the portal vein area of nonfatty livers. However, in steatotic human livers, LAMs are primarily located pericentrally in zones with steatosis, suggesting that monocytes are recruited to distinct locations in healthy and obese livers, where they then differentiate into LAMs [26]. In addition, our analysis of cell-to-cell communication revealed that hepatocytes, HSCs, myofibroblasts and bile duct cells strongly communicate with each other in MASH fibrosis. Single-cell RNA-sequencing in mouse MASH samples also revealed that immune cells, hepatocytes, cholangiocarcinomas and endothelial cells communicate through secreted ligands in the fibrotic state. These ligands can potentially bind to the cell surface receptors of specific HSCs, thus triggering downstream signalling pathways and stimulating the expression of liver fibrosis-related genes [27]. The results suggest that the activation of HSCs into myofibroblasts and their chemotaxis into fibrotic regions play key roles in the occurrence and development of MASH syndrome.
Pseudotime analysis revealed liver inflammation caused by infiltration by T cells and Kupffer cells in the early stages of MASH. This inflammation subsequently stimulates the transformation of HSCs into fibroblasts. The first six distinct branch-dependent genes involved in the progression of fibrosis were identified as ACAP3, ATAD3B, MIB2, MTND2P28, CCNL2 and RP5-857K21.4. ATAD3B, a mitophagy receptor that mediates the clearance of oxidative stress-induced damaged mitochondrial DNA [28] may serve as a prognostic biomarker for patients with hepatocellular carcinoma (HCC) [29]. MIB2 encodes an E3 ligase that has recently been shown to ubiquitinate RIPK1, thereby inhibiting the pro-apoptotic activity of RIPK1 and inhibiting cell death that is otherwise induced by various stimuli, including TNF-α [30]. MIB2 has also been shown to increase TNF-α-induced NF-κB signalling by mediating ubiquitination of the deubiquitinating enzyme CYLD, leading to its degradation in proteasomes [31]. Blocking MIB2-mediated polyubiquitination and degradation of CARD6 has a protective effect against lipid accumulation in the liver induced by high fructose [32].
Currently, no drugs are approved specifically for treating MASH-related fibrosis. Initial attempts to directly target HSC activation through inhibition of tyrosine kinase receptors or TGF-β receptors were abandoned because of the potential for adverse reactions due to the pleiotropic expression of these receptors [33]. By differential expression and deconvolution analysis, we identified the key genes involved in HSC activation as ADAMTSL2, PTGDS, S100A6, PPP1R1A, ASS1 and G6PC. ADAMTSL2 was previously identified as a plasma marker of MASH fibrosis in a preclinical model [34]. Corey et al. provided evidence that strongly supports the idea that ADAMTSL2 encodes a novel circulating marker of MASH fibrosis [35]. The PTGDS gene encodes a bifunctional protein that catalyses the production of prostaglandin D2 and transports lipophilic substances [36]. As fibrosis stage and NAS increase, there is a consistent increase in PTGDS; this has been validated in mice fed both HFDs and HFHC diets [37]. As the liver fibrosis stage increases, the expression of S100A6 gradually increases [38]. Introducing recombinant human S100A6 (rhS100A6) into CCl4-induced mice can enhance liver fibrosis by promoting the proliferation of activated HSCs [39]. Studies have also shown that rhS100A6 can induce cell cycle progression from the S phase to the G2 phase and that it significantly increases the phosphorylation of ERK in the MARK pathway [39]. PPP1R1A-encoded protein phosphatase 1 regulatory subunit 1A is an effective inhibitor of protein phosphatase 1 [40]. Research has shown that PPP1R1A may be a key gene related to the pathogenesis and prognosis of HCC [41]. Argininosuccinate synthase 1 (ASS1) is a key enzyme in the arginine biosynthesis pathway [42]. Fibroblasts with ASS1 deficiency exhibit increased invasiveness, motility and proliferation and decreased matrix deposition. Studies utilising animal models have shown that regulating the expression of ASS1 can control these phenotypic characteristics and influence the progression and development of pulmonary fibrosis [43]. The G6PC gene encodes glucose-6-phosphatase, a key enzyme in gluconeogenesis that catalyses the conversion of glucose-6-phosphate to glucose. Reduced expression of G6PC can lead to decreased gluconeogenesis and lower glucose levels, potentially affecting cell proliferation [44]. Low expression of G6PC is also associated with poor prognosis in HCC patients. G6PC may serve as a new potential prognostic marker and molecular target for targeted therapy in HCC [45].
Members of the ADAMTSL (a disintegrin-like and metalloproteinase domain with thrombospondin type 1 motif-like) family of secreted glycoproteins structurally resemble ADAMTS proteases [46]. Our results showed that ADAMTSL2 is highly expressed specifically in fibrotic areas and in fibroblast populations. Corey et al. also reported that the ADAMTSL2 protein is strongly associated with the risk of MASH and significant fibrosis [35]. Furthermore, the ADAMTSL2 protein interacts with various key proteins, such as LOXL1 and FBN1, and functional enrichment analysis revealed that ADAMTSL2+ myofibroblasts are involved in the TNF signalling pathway. ADAMTSL2 has also been found to interact with lysyl oxidase (LOX), which plays a role in microfibril formation, ECM-associated signalling and hepatic fibrosis progression [47]. The available data suggest that ADAMTS proteases can bind to and regulate fibrillin microfibrils, major components of the ECM that interact with latent TGF-β-binding protein-1 [48], which is involved in the tissue-specific sequestration of TGF-β in the ECM, as well as with FBN1 and FBN-2 [49]. LOXL-1 functions in the activation of stellate cells and promotes fibrosis progression by facilitating elastin cross-linking, making fibrosis difficult to reverse [50]. The potential interplay between LOXL-1 and ADAMTSL2 is intriguing, particularly given the known role of LOXL-1 in liver fibrosis and its potential as a pharmacological therapeutic target for MASH. Thus, the identification and validation of ADAMTSL2 may provide insight into the pathophysiology of MASH fibrosis.
In summary, our study is the first to reveal lineage-specific changes in gene expression, subpopulation composition, cell communication and pseudotime analysis in MASH fibrosis through integrated single-cell and spatial transcriptomics. It thereby provides new directions for research aimed at identifying potential therapeutic targets for MASH fibrosis.
Author Contributions
Jin-zhong Li, Liu Yang and Min-xi Xiao searched the literature and conceived of the study, Min-ran Li and Er-hei Dai designed the study, and Min-ran Li and Jin-zhong Li interpreted the results and drafted the report. Li-hong Ye, Hai-cong Zhang and Zhi-quan Liu made pathological diagnoses of needle-biopsied liver tissue. Ni Li, Xin Huang, Jun-qing Li, Yun-yan Liu, Xu-jing Liang, Tao-yuan Li, Jie-ying Li, Yang Cao, Yun Pan, Xun-ge Lin and Hai-mei Dai collected the data. Min-ran Li, Jin-zhong Li, Liu Yang and Min-xi Xiao analysed the data.
Ethics Statement
This study was approved by the Medical Ethics Committee of The Fifth Hospital of Shijiazhuang (approval number: LL2016003). The study was conducted in accordance with the 1964 Helsinki Declaration and its later amendments or comparable ethical standards.
Consent
Written informed consent was obtained from all patients prior to liver biopsy in the study.
Conflicts of Interest
The authors declare no conflicts of interest.
Open Research
Data Availability Statement
The data that support the findings of this study are available from the corresponding author upon reasonable request.


