Anti-TNFα treatment in Crohn’s disease: Impact on hepatic steatosis, gut-derived hormones and metabolic status
Funding information
PM is supported by the German Research Foundation/Deutsche Foschungsgemeinschaft-(MA-6864/1-1) and the European Association for the Study of the Liver (EASL). SS received funding from the EASL and the German Liver Foundation (Deutsche Leberstiftung). AL is supported by the funds of the European Commission through the ‘European funds for regional development’ (EFRE) as well as by the regional Ministry of Economy, Science, and Digitalization as part of the Autonomie im Alter research group. FJC received funding from MINECO Retos (SAF2016-78711), EXOHEP-CM (S2017/BMD-3727), NanoLiver (CM Y2018/NMT-4949), ERAB (Ref. EA 18/14), AMMF (2018/117), UCM (25-2019), COST Action (CA17112), RYC (2014-15242) and Gilead Liver Research 2018. AC is supported by the Wilhelm-Laupitz-Foundation. LPB is supported by the German Research Foundation/Deutsche Foschungsgemeinschaft (BE-3967/3-1) and the Dr Werner Jackstaedt-Foundation.
Editor: Utpal Pajvani
Abstract
Background and Aims
An association between Crohn's disease (CD) and hepatic steatosis has been reported. However, the underlying mechanisms of steatosis progression in CD are not clear. Among the most effective CD treatments are agents that inhibit Tumor-Necrosis-Factor (TNF) activity, yet it is unclear why anti-TNFα agents would affect steatosis in CD. Recent studies suggest that microbiome can affect both, CD and steatosis pathogenesis. Therefore, we here analysed a potential relationship between anti-TNF treatment and hepatic steatosis in CD, focusing on the gut-liver axis.
Methods
This cross-sectional study evaluated patients with established CD, with and without anti-TNFα treatment, analysing serum markers of liver injury, measurement of transient elastography, controlled attenuation parameter (CAP) and MRI for fat detection. Changes in lipid and metabolic profiles were assessed by serum and stool lipidomics and metabolimics. Additionally, we analysed gut microbiota composition and mediators of bile acid (BA) signalling via stool and serum analysis.
Results
Patients on anti-TNFα treatment had less hepatic steatosis as assessed by CAP and MRI. Serum FGF19 levels were significantly higher in patients on anti-TNFα therapy and associate with reduced steatosis and increased bowel motility. Neutral lipids including triglycerides were reduced in the serum of patients on anti-TNF treatment. Bacteria involved in BA metabolism and FGF19 regulation, including Firmicutes, showed group-specific alterations with low levels in patients without anti-TNFα treatment. Low abundance of Firmicutes was associated with higher triglyceride levels.
Conclusions
Anti-TNFα treatment is associated with reduced steatosis, lower triglyceride levels, alterations in FXR-signalling (eg FGF19) and microbiota composition in CD.
Abbreviations
-
- ALT
-
- Alanine Aminotransferase
-
- AST
-
- Aspartate Aminotransferase
-
- BA
-
- Bile acids,
-
- CA
-
- Cholic acid
-
- CAP
-
- Controlled Attenuation Parameter
-
- CD
-
- Chrohn's diseases
-
- CDAI
-
- Crohn's Diseases Activity Index
-
- FA
-
- Fatty acids
-
- FGF19
-
- Fibroblast growth factor 19
-
- FXR
-
- Farnesoid-X-Receptor
-
- GLP1
-
- Glucagone like peptide 1
-
- GUDCA
-
- Gluco-Urso-Deoxycholic Acid
-
- HC
-
- Healthy Control
-
- IBD
-
- Inflammatory bowel disease
-
- IOP
-
- In and opposed phase
-
- LBP
-
- Lipopolysaccharide binding protein
-
- LSM
-
- Liver stiffness measurement
-
- MGR
-
- Microbial gene richness
-
- MRI
-
- Magnetic resonance imaging
-
- NAFLD
-
- Nonalcoholic fatty liver diseases
-
- NASH
-
- Nonalcoholic steatohepatitis
-
- PLS-DA
-
- Partial least squares discrimination analysis
-
- ROI
-
- Region of interest
-
- TG
-
- Triglycerides
-
- TNF
-
- Tumor necrosis factor
Key points
- Patients suffering from Crohn's disease also show increased hepatic steatosis while the underlying mechanisms of steatosis progression in Crohn’s disease are not clear.
- Based on our results, we show that anti-TNF treatment is associated with reduced steatosis, lower triglyceride levels, activation of FGF19/FXR signaling and changes of the microbiota composition.
- In our study, anti-TNF therapy showed a potential anti-steatotic effect with influence on metabolic mechanisms and changes in the intestinal microbiome and may represent a therapeutic option for steatosis of other geneses.
1 INTRODUCTION
Patients with Crohn's disease (CD) frequently have hepatic steatosis. The overall prevalence of hepatic steatosis appears higher in inflammatory bowel diseases (IBD), including CD, compared to the general population and ranges from 27% to 40%.1, 2 Intriguingly, patients with CD and nonalcoholic fatty liver disease (NAFLD) have higher mortality rates than the general population.3
Anti-TNFα (anti-TNF) agents represents the first-line therapy to treat moderate-to-severe CD.4 Whether anti-TNF treatment has an impact on steatosis in CD is unclear, with conflicting data. A recent study identified a high prevalence of steatosis and NAFLD among patients with IBD receiving anti-TNF therapy.5 However, a meta-analysis has not described any association between medication used in treating CD and the risk of developing steatosis/NAFLD.6
The pathophysiological processes that are involved in the development of steatosis in CD are not entirely understood. It remains unclear whether drivers of steatosis are comparable between patients with and without CD. Steatosis pathogenesis is multifactorial, with strong environmental and genetic impacts. Other features including insulin resistance, lipotoxicity, immune cell response and inflammation contribute to the progression from steatosis to nonalcoholic steatohepatitis (NASH) and liver fibrosis.7 In the last decade, alterations in bile acid (BA) metabolism and gut microbiota dysbiosis have also been associated with steatosis development and progression.8, 9 On the other hand, we know that gut microbiome community structure is associated with Crohn's disease (CD) development and response to therapy.10
Findings in animal models indicate a beneficial effect of TNF antagonism in features of NASH. Specifically, these agents attenuate steatosis and inflammation in 2 different rat models.11, 12 In a genetic model of NASH, Ob/Ob-/- mice, anti-TNF treatment and probiotics improve histology and liver function tests.13
We believe that IBD-specific risk factors, including intestinal inflammation, malnutrition, drug toxicity and gut microbiota alterations, may contribute to steatosis, but no studies have explicitly explored this question. Therefore, in this study, we have explored whether there is a relationship between anti-TNF treatment and hepatic steatosis in CD, focusing on the gut-liver axis features that may be determinants of this link.
2 MATERIAL AND METHODS
2.1 Sample collection
Patients were prospectively recruited in the Department of Gastroenterology and Hepatology at Essen University Hospital from May 2015 until November 2017. All subjects provided informed written consent, and this study was approved by the Essen University Hospital Ethics committee (Institutional Review Board; 14-6044-BO). This study protocol follows the ethical guidelines of the Declaration of Helsinki.
Subjects were divided into 3 groups (Crohn's disease without anti-TNFα treatment: CD; Crohn's disease with anti-TNFα treatment: CD-TNF and healthy controls: control). Treatment with anti-TNFα-agents included medication with Infliximab (n = 6) or Adalimumab (n = 12). We performed liver stiffness measurement (LSM) to quantify potential liver fibrosis, steatosis was diagnosed by ultrasound and controlled attenuation parameter (CAP) or MRI spectroscopy, if available. Serum samples were collected in a fasted state and stored in aliquots at −80℃ until use for analysis. Standard laboratory parameters were evaluated via the central laboratory of the Essen University Hospital.
2.2 Faecal samples and microbiome analysis
Faecal samples were collected from every patient in sterile tubes and stored at −80℃ until DNA isolation. Individuals were excluded if they received antibiotic treatment during the past 4 weeks. DNA was isolated using the QIamp-DNA isolation kit following manufacturer's instructions (Qiagen, Hilden, Germany), including a mechanical lysis step using dry bead tubes (MoBio Laboratories Inc, Carlsbad, CA, USA) and the Fast Prep™-24 instrument (MP Biomedicals, Solon, OH, USA) at 6.0 m/s for 45 seconds (2 times). Amplicon libraries were generated as previously described14 and sequenced on a MiSeq (2 × 250 bp, Illumina, Hayward, CA, USA). All FastaQ files were analysed using the dada2 package in R (www.r-project.org), and as a result, a unique table containing all samples with the sequence reads and abundances was generated. All samples were resampled to equal the smallest library size of 10 366 reads using the phyloseq package and returning 4611 phylotypes. Sequence reads were assigned to a taxonomic affiliation based on the naïve Bayesian classification with a pseudo-bootstrap threshold of 80%. Relative abundances in percentage of Phylotypes, Genus, Family, Order, Class and Phylum were used for downstream analyses. The vegan package (http://CRAN.R-project.org/package=vegan) was used to generate rarefaction curves, the EcoIndR for calculating the richness, relative rarity, Shannon, Simpson and taxonomy diversity indices. For microbiome analysis, both packages from R were used (version 3.4.2. 2017). Multivariate analyses were performed with Past3 (https://folk.uio.no/ohammer/past/), and univariate analyses were performed with GraphPad Prism 7 (GraphPad Software Inc, San Diego, CA, USA). The data comprising the 6 taxonomy ranks were used to construct sample-similarity matrices using the Bray-Curtis algorithm, where samples were clustered with 1000 bootstraps. Significant differences between a priori predefined groups of specimens were evaluated using analysis of similarity (ANOSIM with 9.999 permutations) and permutational multivariate analysis of variance (PERMANOVA with 9.999 permutations), and groups were considered significantly different if the P-value was ≤.05. The abundances of the 6 taxonomy ranks of those phylotypes with a mean >1% were compared by the Mann-Whitney test using the package exactRankTests (CIs at 95%) from R.
Bacterial diversity in faeces was compared between groups to identify individual bacteria as well as disease-associated bacterial signatures. Detected phylotypes were taxonomically assigned to 11 phyla, 22 classes, 35 orders, 67 families, and 168 genera. The global bacterial profiles at all phylogeny ranks (Phylotypes, Genus, Family, Order, Class, and Phylum) were compared using group-average agglomerative hierarchical clustering following sample-pairwise comparisons.
2.3 Serum and faecal sample metabolomics profiling
Faecal samples were extracted by sonification in 1:3 diluted extraction buffer (ethanol and phosphate buffer; Sigma-Aldrich, Steinheim, Germany) from approximately 300 mg of faeces; supernatants were used for quantification. Quantification of metabolomics analysis in serum or faecal sample extracts was performed by liquid chromatography coupled to Electrospray Ionization Tandem Mass Spectrometry (LC-ESI-MS/MS) using the Biocrates® MxP Quant 500 Kit (BIOCRATES Life Sciences AG, Innsbruck, Austria), which covers up to 630 metabolites and lipids from 26 analyte classes. Data analysis was completed using the Biocrates MetIDQ software. Based on the ANOVA, significantly changed metabolites in each sample (either stool or serum) were used to perform metabolite enrichment analysis using Metaboanalyst (https://www.metaboanalyst.ca/). Lipid enrichment analysis was performed separately using http://lipidontology.com tool.15
2.3.1 ELISA
Serum levels of the overall cell death marker M65, apoptosis marker M30 and Adiponectin were measured using commercially available kits from TecoMedical (Sissach, Switzerland). Serum levels of fibroblast growth factor 19 (FGF19) were quantified using the Quantikine ELISA-kit from R&D Systems (Minneapolis, MN, USA), levels of glucagon-like peptide 1 (GLP1) by using the GLP1 ELISA kit from Abcam (Cambridge, United Kingdom). Lipopolysaccharide binding protein (LBP) was quantified with the human LBP ELISA Kit from Hycult Biotech (Uden, the Netherlands). All ELISA Kits were performed according to the manufacturer's instructions. The concentrations of faecal calprotectin were measured using the BÜHLMANN fCal ELISA Kit (Bühlmann Laboratories AG, Schönenbuch, Switzerland).
2.4 Bioinformatics and statistical analysis
Statistical significance was determined using an unpaired, two-tailed t test or one-way ANOVA and nonparametric test (Kruskal-Wallis and Dunn's multiple comparison test correction for individual experimental conditions). Correlation analysis was performed using linear regression analysis; all analyses were performed with GraphPad Prism 9. If not stated otherwise, all data are presented as mean ± SEM. Significance was assumed at P ≤ .05.
2.5 Magnetic resonance imaging (MRI) for liver fat detection and bowel movement analysis
MRI of the bowel and liver was performed on a 3 Tesla magnet (Magnetom Avanto, Siemens Health Care, Erlangen, Germany). Conventional axial in and opposed phase (IOP) imaging of the liver was performed and average values for fat and water images were measured using regions of interest (ROI). Thereafter, fat signal fractions can be calculated as shown by Reeder et al16. Coronal real time true-Fisp sequences of the bowel were acquired for automatic generation of parametric maps facilitating quantification of bowel motility as previously reported.17
3 RESULTS
3.1 Characteristics of the study cohort
Forty-nine subjects, including healthy controls (n = 10), CD without anti-TNFα treatment (CD; n = 21) and CD patients receiving anti-TNFα agents (CD-TNF; n = 18), were recruited. Anti-TNF medication was based on intravenous medication with Infliximab (n = 6) or subcutaneous medication with Adalimumab (n = 12). Controls were younger, and CD patients without anti-TNF treatment were older. All CD patients were in clinical remission or had moderate symptoms. No patient had severe symptoms, according to standardized clinical documentation. While Crohn's Disease Activity Index (CDAI) was only available in a subset of patients, there was no significant difference between groups (data not shown). Faecal calprotectin levels were not significantly different between CD and CD-TNF. Table 1 provides an overview of the demographic data of the individual groups.
| CD (n = 21) | CD-TNF (n = 18) | Control (n = 10) | X²/Kruskall-Wallis | |
|---|---|---|---|---|
| Age [years] | 59.5 (±2.33) | 38.6 (±3.57) | 29.6 (±3.01) | P < .001 |
| Gender [female] | 66.7% | 61.1% | 70.0% | n.s. |
| Ileocecal resection (number of subjects/% positive cases) | 10 (48%) | 2 (11%) | 0/0% | P < .05 |
| Steroid-Therapy (number of subjects/% positive cases) | 3 (14%) | 1 (5.6%) | 0/0% | n.s. |
| Dyslipidaemia | 9.5% | 11.0% | 0% | n.s. |
| Hba1c% | 5.6 (±0.5) | 5.3 (±0.5) | 5.4 (±0.4) | n.s. |
| Arterial hypertension | 19% | 16.7% | 0% | n.s. |
| BMI [kg/m²] | 23.6 (±8.6) | 23.1 (±5.2) | 22.0 (±1.7) | n.s. |
| AST [U/L] | 20.0 (±13) | 18.0 (±10) | 18.5 (±10) | n.s. |
| ALT [U/L] | 21.0 (±14) | 19.0 (±11) | 16.0 (±6) | n.s. |
| AP [U/L] | 63.5 (±17) | 68.0 (±32) | 50.0 (±15) | n.s. |
| γGT [U/L] | 15.5 (±13) | 13.0 (±15) | 12.5 (±7) | n.s. |
| Calprotectin [µg/L] | 182.5 (±622.0) | 306.9 (±1006) | 31.32 (±13.08) |
P < .01 CD vs CD-TNF: P = .31 |
| CRP [mg/dL] | 0.5 (±0.5) | 0.5 (±1.6) | 0.5 (±0.00) | n.s. |
| CAP >270 db/m (=S2/S3) [%] | 15 (71%) | 4 (33%) | 0 (0%) |
P < .01 |
- All data presented as median and interquartile-range (IQR). n.s. stands for not significant.
3.2 Attenuation of hepatic steatosis in CD is associated with anti-TNF treatment
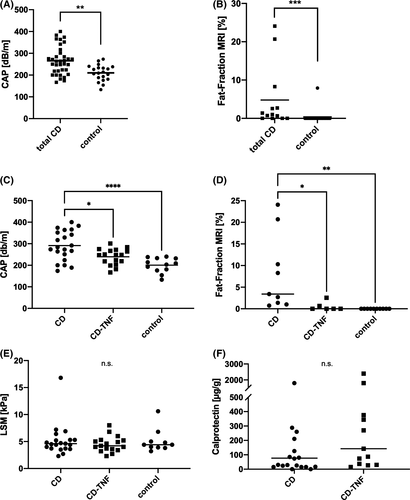
We performed LSM to quantify potential liver fibrosis as well as CAP and fat-fraction measurement by MRI spectroscopy to assess hepatic fat accumulation. CAP values and MRI-fat fraction were higher in all patients with CD (with and without anti-TNF treatment) than in controls (Figure 1A-B). Interestingly, CAP values and MRI-fat fractions were higher in CD patients without anti-TNF therapy than those receiving anti-TNFα agents or controls (Figure 1C-D). In contrast, there was no difference in LSM between any of the groups (Figure 1E). LFTs seem to be lower in the control group; however, those changes failed to show significance (Table 1). The inflammatory status of CD was controlled by the assessment of calprotectin in stool samples and serum-CRP. Here, we did not find any pronounced differences between the 2 CD groups (Table 1). To investigate whether additional medication or conditions impact steatosis, we compared 2 groups (no or mild steatosis: S0/S1; CAP <270 db/m vs severe steatosis S2/S3; CAP>270 db/m). Patients with severe steatosis were less likely to be on anti-TNF treatment but more likely to receive Mesalazine (Table S1). However, there was no difference in CAP and fat fraction between Mesalazine users and nonusers (data are not shown). It should also be noted that neither the use of steroids (n = 6 patients) nor the type of anti-TNF therapy (whether adalimumab or infliximab) had any influence on the CAP value in CD-TNF patients (Tables S2 and S3). Information, if patients received various medications including immune modulatory drugs and CD-specific drugs (including Mesalazine) are summarized in Table S4. Of note, in our cohort, the rate of ileocecal (valve) resection was higher in patients without anti-TNFα treatment (Table 1). Those patients with resection did also present with higher CAP value (Table S1) and lower FGF19 levels (Figure S1A).
3.3 Alterations in gut-liver hormone levels are associated with hepatic steatosis in CD patients
Fibroblast growth factor 19 (FGF19) acts as a gut-derived hormone, suppressing hepatic de novo BA synthesis and regulating lipid and glucose metabolism.7 The Farnesoid X receptor (FXR) regulates intestinal FGF19 expression and its release into the bloodstream.18 CD patients without anti-TNF treatment had increased serum FGF19 compared to control. Serum FGF19 levels were even higher in CD-TNF compared to CD patients (Figure 2A). However, it should be noted that the whole CD group also included a larger number of patients with ileocecal resection (Table 1). In the resected CD patients group, FGF19 levels were lower than in the group without resection (Figure S1A). Also, in CD patients, FGF19 levels correlated inversely with steatosis grade assessed by CAP (Figure 2B) and MRI (Figure S1B). Intriguingly, there was no association between CAP and FGF19 for the total cohort, including healthy controls (Figure S1C). There was also no evidence that differences in FGF19 levels were related to the age of the cohort (Figures S1D).
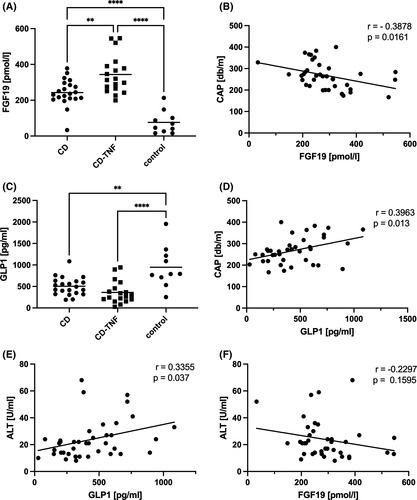
Glucagon-like peptide 1 (GLP1) is another gut-derived hormone that is released from enteroendocrine cells. FXR activation inhibits GLP1 synthesis and release.19 In our cohort, CD patients had lower serum levels of GLP1 compared to controls (Figure 2C). There was a direct relationship between GLP1 and CAP (Figure 2D) and GLP1 and MRI (Figure S1E). Again, the association between GLP1 and CAP was present in the CD cohort only (Figure S1F). There was also a positive correlation between GLP1 and liver injury marker ALT (Figure 2E). ALT trended towards a negative correlation with FGF19 but was not significant (Figure 2F).
3.4 Alterations in metabolite and lipid profiles are associated with anti-TNF treatment
We performed metabolomic and lipidomic profiling of serum and stool samples using mass spectrometry. We performed partial least squares discrimination analysis (PLS-DA) in order to highlight group differences which were rather found between the stool's metabolite profile than the serum samples (Figure 3A).
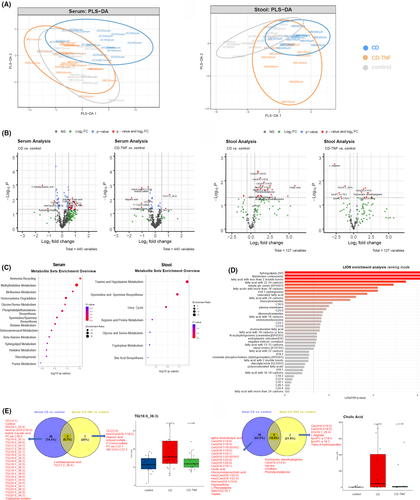
One-way ANOVA was performed on each of the datasets (serum and stool) to identify metabolite concentration and identity changes. Figure 3B shows volcano plots with dysregulated metabolites in each comparison. In serum, we detected an increase in CD patients’ triglycerides compared to controls, which was not observed in serum from CD-TNF patients. Stool samples had increased ceramide levels and cholic acid (CA) in CD samples compared to controls. An increase in ceramides was less pronounced in stool from CD patients with anti-TNF treatment.
Based on the ANOVA, significantly changed metabolites in each sample (either stool or serum) were used to perform metabolite enrichment analysis. Based on this analysis, there was enrichment in serum of ammonia recycling, methylhistidine metabolism, methionine metabolism and other pathways (Figure 3C).
Serum contained substantial enrichment in sphingolipids, saturated fatty acids, hexosylceramides, dihexosylceramides and other lipid categories. An overview of the Lipid Ontology enrichment analysis of serum samples is provided in (Figure 3D).
Levels of neutral lipids such as triglycerides were reduced in the serum of patients on anti-TNF treatment while there are only 2 metabolites common in both CD and CD-TNF patients (Figure 3E). Similar interesting observations were seen in the stool samples. Two BA (CA and glycol-ursodeoxycholic acid; GUDCA) and several ceramides and glycosylceramides were increased in the stool of CD samples while their level was reduced anti-TNF treated cohort (Figure 3E).
3.5 The abundance of individual phylae in CD is associated with anti-TNF treatment
Although there were no differences in phylotype richness and Shannon index between groups (Figure S2A-B), we observed obvious differences between HC and CD in evenness phylotypes represented by Pielous's Evenness index and Simpson index (Figure S2C-D). The results demonstrate that a few bacterial groups comprise the central part of the entire community in CD patients, whereas, in HC, a higher community complexity was found.
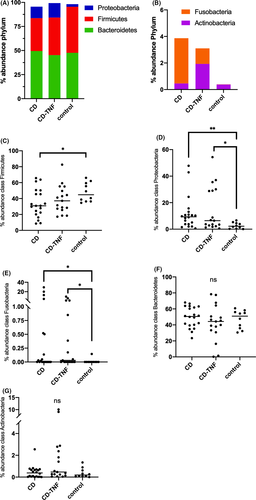
The most abundant phylotypes belonged to the phyla Bacteroidetes, Actinobacteria, Firmicutes, Proteobacteria and Fusobacteria, which comprised approximately 99% of the total bacterial community (Figure 4A, B). At the bacterial phylum level in NAFLD, Bacteroidetes and Firmicutes are reported to be decreased, while proteobacteria levels are increased.20 In our cohort, Firmicutes were gradually reduced in abundance from control to CD-TNF to CD (Figure 4C). In comparison, Proteobacteria were increased in control and CD-TNF compared to CD (Figure 4D). Fusobacteria, Bacteriodetes and Actinobacteria's abundances did not show relevant alterations (Figure 4E-G).
3.6 The abundance of specific families in CD
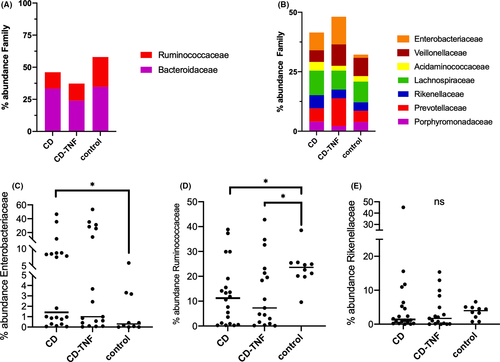
The most abundant families were Ruminococcaceae, Bacteroidaceae, Enterobacteriaceae, Veillonellaceae, Acidaminococcaceae, Lachnospiraceae, Rickenellacea, and Prevotellaceae, Porphyromonadaceae (Figure 5A, B). At the family level in NAFLD, Rikenellaceae and Ruminococcaceae were decreased, and Enterobacteriaceae increased.20 In our cohort, Enterobacteriaceae were gradually increased in abundance from control to CD-TNF to CD (Figure 5C). Contrary Ruminococcaceae were decreased when comparing control to CD-TNF and CD (Figure 5D) while the abundance of between groups Rikenellaceae was not significantly changed (E).
3.7 Association of serum and stool metabolites with the abundance of Firmicutes and Ruminococcaceae
We sought to correlate metabolites and lipids in the metabolomic analysis. We linked those with the abundance of individual phylae and families, which differed between groups in the previous analysis. Analyses show a negative correlation of 83 different triglycerides (TG) in serum with the abundance of Firmicutes (Figure 6A) and Ruminococcaceae (Figure 6B) respectively. As fatty acids (FA) play a crucial role in steatosis pathogenesis, we also correlated serum FA from the metabolomic analysis with the bacterial abundance. In contrast to TG, we failed to show any association in this case (data not shown).
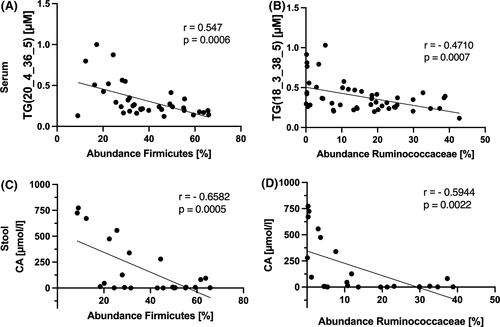
Further correlations with Proteobacteria and Enterobacteriaceae did not provide any differences. Correlation analysis in stool shows a negative association of CA with Firmicutes (Figure 6C) and Ruminococcaceae (Figure 6D). Despite showing differences in metabolomic stool analysis, no correlation was found between ceramides and the abundance of any of the bacteria tested (data not shown).
3.8 Bowel-movement frequency correlates with therapy-induced changes in gut hormones
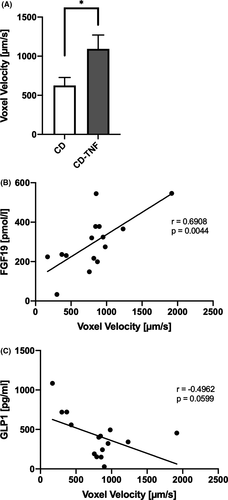
We used MRI of the bowel in 15 patients to determine if metabolomic and lipid changes correlated with activity (CD n=9; CD-TNF n=6). We assessed voxel velocity as a surrogate marker for bowel activity as previously described.17 CD patients on anti-TNF treatment showed enhanced bowel-movement activity compared to individuals without anti-TNF treatment (Figure 7A). Interestingly, bowel-movement activity is positively associated with serum FGF19 levels and negatively correlated with GLP1 levels (Figure 7B, C). There was no difference in bowel-movement frequency between patients who received ileocecal resection and those who did not (data not shown).
4 DISCUSSION
In Crohn's disease, several comorbidities, especially liver disease, are associated with a higher mortality rate.3 The prevalence of steatosis in our CD cohort was 46% (assessed by CAP), which is higher than described previously.1, 2 However, steatosis in anti-TNFα treated CD patients was not different to control. CD patients had upregulation of FXR signalling reflected in increased FGF19 levels, which were even higher in anti-TNF-treated patients. Additionally, GLP1 levels were lower in CD vs controls. The hormone signalling changes were associated with increased triglyceride levels which again were attenuated in the anti-TNF-treated group. Changes in microbiota composition and similarities to compositions found in steatotic patients in our CD cohort underline these patients' pro-steatotic environment. Furthermore, these changes seem to be partially attenuated by anti-TNF therapy.
TNFα has been implicated in steatosis pathogenesis and associated features, including insulin resistance.21-24 In animal experiments, anti-TNFα therapy reverses steatosis and improves insulin signal transduction in the liver of rats on a high-fat diet.11 Similar findings have also been found in a genetic NAFLD mouse model.13 In humans, steatosis levels were positively correlated with serum levels of TNFα in obese patients.25
FGF19 is a gut-derived hormone that regulates de novo BA synthesis and plays a pivotal role in hepatic lipid metabolism. Multiple groups have reported decreased circulating FGF19 levels in patients with steatosis.26-28 In our cohort of CD patients, FGF19 was increased compared to controls, an indication for activation of FXR signalling.30 FXR itself represents a regulator of lipogenesis and fatty acid oxidation, 2 primary steatosis development mechanisms.29 Intriguingly, anti-TNFα-treated patients show higher CA levels in stool, which comes with an elevation of FGF19, but less steatosis and lower TG levels. Previously, it has been described that intestinal FXR activity is reduced in inflamed bowel in CD. As anti-TNFα reduces intestinal inflammation, this could enhance intestinal FXR signalling and FGF19 expression due to restoration of bowel integrity. However, we did not find any lower disease activity in CD-TNF compared to CD.
Low levels of triglyceride can be explained by FGF19 regulating lipid metabolism through different FGFR receptors. Activation of FGFR1c, for example, leads to reduced triglycerides and cholesterol levels. This hypothesis is in line with experimental findings of reduced triglycerides and cholesterol in FGF19 transgenic mice and mice chronically treated with recombinant FGF19.30 Additionally, FGF19 variants increase prokinetic activity and bowel transit, associated with decreased lipid absorption.31
GLP1 is another gut-derived hormone. GLP1 agonists have been shown to reduce blood glycaemia and hepatic steatosis in patients with type 2 diabetes mellitus.32, 33 Several studies showed that GLP1 agonism leads to decreased absorption of lipids due to inhibition of chylomicron secretion and synthesis and reduced gut motility.34 However, the situation in the inflamed colon remains inconclusive. One study showed downregulation of GLP1-R mRNA in samples of inflamed specimens from the colon in IBD.35 Another study showed an increase of GLP1 in CD patients’ serum compared to healthy controls.36, 37 In our cohort, we found lower serum levels of GLP1 in CD patients. This could be assigned because our cohort patients had a controlled disease. In contrast, the cohort of Keller et al consisted of hospitalized patients due to an acute exacerbation of their IBD.37 In our CD cohort, GLP1 serum levels correlated positively with CAP values and levels of ALT.
Our findings link FGF19 levels to increased gut motility as previously described.31 At the same time, GLP1 levels were low in patients with increased gut motility, further reinforcing a potential interaction between GLP1 and FXR signalling. This is in line with the previously described suppression of bowel motility by GLP1.38
Changes in the gut microbiota are implicated in steatosis development, possibly in part through the activity of incretins.39 Obesity, for example, is associated with a decreased microbial gene richness (MGR).40, 41 In our cohort, the phylotype parameters of diversity differed between groups were found, especially Firmicutes and Proteobacteria changes. Intriguingly the microbiota compositions in CD patients are similar to those previously described in NAFLD samples. We observed a decrease in Ruminococcaceae and an increase in Enterobacteriaceae in CD patients at the family level compared to controls. At present, no universal NAFLD-specific microbiota composition has been described. However, there are some consistent abnormalities found in patients with steatosis.42 In brief, NAFLD is frequently associated with increased Proteobacteria and decreased Firmicutes at the phylum level.43-47 At the family level, Rikenellaceae 41, 45 and Ruminococcaceae 44-47 are reduced, and Enterobacteriaceae increased.44, 46 To summarize, patients with CD present a microbiota composition comparable to that found in NAFLD patients, along with specific changes in lipid profiles like the negative correlation between the abundance of Firmicutes and triglycerides found in our cohort (53).
There are several limitations to our study based on the cross-sectional design. Because metabolic syndrome tends to occur in elder people and there were differences in age within our cohorts, we examined this influence. We performed a correlation analysis between CAP and age and found a significant relationship for the total cohort (Figure 2E). However, correlation analysis within the treatment groups did not show a weaker relationship between age and CAP (Figure 2F-G). Nevertheless, we cannot exclude age as a confounder for steatosis as our TNFα-treated patients appear to be younger, and matched controls are missing due to low sample size. Although we observed striking alterations in FGF19 signalling and GLP1 associated with CD and related microbiota compositional changes, it remains unclear whether these mechanisms occur independently or interconnect with each other. Further, our study leaves the question of whether there is a direct relationship between TNFα inhibition and FXR activation and vice versa. Besides, we cannot exclude a synergistic effect of ileocecal resection, as this differs between groups. More trials, including prospective and longitudinal studies as in vivo and in vitro experiments, are necessary to solve this question. Another limiting factor is the low number of patients, especially in microbiota studies, as several trials failed to reproduce results even with a sufficient number of patients.42 The low number of patients also counteracted the feasibility of multivariate analysis due to an expected low power. Another striking point is that we could not identify any associations with fibrosis, which leaves the question about steatosis’ clinical relevance in CD unanswered.
Therefore, based on our findings, we postulate that anti-TNFα treatment leads to an activation of FGF19/FXR signalling in CD patients. This provokes specific antisteatotic metabolic changes (like low triglyceride levels) related to changes in gut microbiota composition. Further analysis of this interaction is required in future trials, including data from multicentre studies and the generation of longitudinal data to uncover the potential mechanism behind anti-TNFα treatment in CD steatosis development and its clinical impact.
ACKNOWLEDGEMENTS
The authors thank Martin Schlattjan, Ursula Stolz, Ilka Kramer and Simone Philipsen for excellent technical assistance. Furthermore, they thank Robert Geffers and Michael Jarek from the Helmholtz Centre for Infection Research in Braunschweig (Germany), who performed Illumina sequencing for the microbiome analysis. They thank Sven Schuchardt (Head of the Department of Bio- and Environmental Analytics at the Fraunhofer ITEM, Hannover), who performed the measurement of the Quant500 kit and provided the data for further analysis.
CONFLICT OF INTERESTS
All authors declare that they do not have a conflict of interests.
AUTHOR CONTRIBUTION
PM (acquisition, analysis and interpretation of the data, study design, statistical analysis, drafting of the manuscript, study supervision), SS (acquisition, analysis and interpretation of the data, technical support, statistical analysis, drafting of the manuscript), NW (data analysis statistical analysis-metabolomic and lipidomic analysis), JB (acquisition, analysis and interpretation of data), MB (acquisition, analysis and interpretation of data), AH (acquisition, analysis and interpretation of data), JS (acquisition, analysis and interpretation of data), RVV (analysis, interpretation and statistical analysis of the data-microbiota analysis), AL (interpretation of the data and critical revision of the manuscript for important intellectual content), AF (critical revision of the manuscript for important intellectual content), AJ (critical revision of the manuscript for important intellectual content), UvA (critical revision of the manuscript for important intellectual content), JDC (analysis and interpretation of data, critical revision of the manuscript for important intellectual content), FJC (critical revision of the manuscript for important intellectual content), AK (treatment of patients, data acquisition), MSK (analysis and interpretation for the MRI-data), JK (data acquisition), SK (acquisition, analysis and interpretation for the MRI-data), KNF (interpretation of the data and critical revision of the manuscript for important intellectual content), HM (critical revision of the manuscript for important intellectual content), GG (obtained funding, critical revision of the manuscript for important intellectual content), WKS (critical revision of the manuscript for important intellectual content), SLF (interpretation of the data and critical revision of the manuscript for important intellectual content), AC (obtained funding, critical revision of the manuscript for important intellectual content), LPB (study concept and design, obtained funding, acquisition, analysis and interpretation of the data, statistical analysis, drafting of the manuscript, study supervision).


