Track analysis of the Nearctic region: Identifying complex areas with mammals
Abstract
The Nearctic region is located on the North American plate. However, its tectonic history is related to convergence with other plates, which has promoted a complex topography. This complexity should be reflected by the distributional patterns of the biota. We used track analysis with 574 species of mammals to identify generalized tracks and panbiogeographic nodes in the Nearctic region and to propose an updated point of view of complex areas and their boundaries in North America. Seven generalized tracks with nested patterns (California, Columbia Plateau, Mesoamerican, Mexican Plateau, Neotropic, Southern Rocky Mountains, and Western Coast of USA) were identified using a parsimony analysis of endemicity with progressive character elimination. Nine panbiogeographic nodes were identified at the intersections of the generalized tracks, all of which were located in the Sierra of Chiapas and Central America physical features. A total of 192 nodes were identified for the nested patterns, located in only eight physical features. Our analysis revealed evolutionary patterns in generalized tracks, and the panbiogeographic nodes predicted areas with high evolutionary–geologic complexity, shared by other taxonomic groups.
1 INTRODUCTION
The Nearctic region extends from North America to northern Mexico, bounded by the Mexican transition zone. This region has been hypothesized as a natural unit based on geographical distribution of mammals (Escalante, 2017; Escalante, Morrone, & Rodríguez-Tapia, 2013; Escalante, Rodríguez-Tapia, Linaje, Morrone, & Noguera-Urbano, 2014; Escalante, Rodríguez-Tapia, Szumik, Morrone, & Rivas, 2010), although its monophyly has not been proven. However, some patterns within this region are still poorly understood. In particular, biological, evolutionary, and geological complex areas in the Nearctic region have not yet been identified.
The first true mammals in the fossil record occurred in the Late Triassic era, with low diversity during the rest of the Mesozoic; later, in the Cretaceous, they diverged into marsupials and placentals (Monroe & Wicander, 2015). Large mammals were not present until the Late Paleocene, and giant terrestrial mammals appeared in the Eocene; in the Oligocene, all the basic groups of existing mammals were present (Monroe & Wicander, 2015). Mammals of the Miocene and Pliocene are very similar to current species (Monroe & Wicander, 2015). The endemicity and diversity patterns of modern mammals suggest that the Nearctic region is composed of at least three patterns of endemism: west, east, and north (Escalante et al., 2010, 2013, 2014). Several factors have been proposed to explain the distributional patterns of mammals in the Nearctic region, for example, geography, configuration of land masses, climatic fluctuations, and climatic zones of North America (Hawkins & Porter, 2003; Pfrender, Bradshaw, & Kleckner, 1998). However, few interpretations of the geological and tectonic history of North America have been developed regarding the evolutionary biogeography of mammals.
Almost all of the Nearctic region belongs to a large tectonic plate, named the North American Plate, and to the North American craton (Laurentia), derived from the ancient Laurasia (see Monroe & Wicander, 2015). Cratons are the ancient cores of the continents and the longest-lived tectonic features (since the Precambrian) that have remained coherent and relatively rigid (Boyce et al., 2016; Hoffman, 1988). However, the tectonics of North America also includes mobile belts where mountain building occurred (Monroe & Wicander, 2015). Southward, the Cocos and Caribbean plates are in contact with the North American Plate, and their subduction has caused active volcanism (Molnar & Sykes, 1969). The Mexican transition zone forms the southern boundary of the Nearctic region, being a complex and varied area of overlapping of Neotropical and Nearctic biotas (Halffter & Morrone, 2017; Morrone, 2015a). The Mexican transition zone includes the five main mountainous systems of Mexico, with ages since the Cretaceous and Paleogene (e.g., Sierra Madre Oriental) until the more recent in Neogene–Quaternary (e.g., Transmexican Volcanic Belt; Lugo-Hub, 1990).
Many tectonic-geological events may have shaped the biotic complexity of North America. In the Mesozoic and Cenozoic, major changes in plate-tectonics include (Bally, Scotese, & Ross, 1989): (i) the beginning of the opening of the Atlantic Ocean, the Gulf of Mexico and the Proto-Caribbean; (ii) inception of the Rocky Mountain foredeep and beginning of the Cordilleran foreland folded belt deformation; (iii) beginning of the Colville foredeep on the North Slope of Alaska; (iv) formation of the widespread mid-Cretaceous unconformity of the Gulf Coast and the Central Atlantic; (v) inception of Laramide deformation, deformation of the Southern Rocky Mountains, and final phases of deformation of the Cordilleran foreland folded belts; and (vi) end of the compression of the Cordilleran foreland folded belt, inception of extensional tectonics in the Basin and Range Province, strike-slip tectonics in California, and establishment of new drainage patterns.
Track analysis (TA) is a general methodology (but also a theoretical paradigm; Morrone, 2015b) founded in the context of panbiogeography, developed by Croizat (1958, 1964). TA is primarily based on the vicariance process as a shaper of the distributional patterns of biota. Recently, TA's usefulness in evolutionary biology has been the subject of controversy (Heads, 2014a, 2014b; Morrone, 2015b; Waters et al., 2013). Currently, TA is considered different from classic panbiogeography regarding the mobilism phase (Escalante, Noguera-Urbano, Pimentel, & Aguado-Bautista, 2017). However, TA retains a biogeographically unique concept: the panbiogeographical node (PN; Miguel-Talonia & Escalante, 2013). Panbiogeographical nodes (also called gates by Croizat) are the main result of a track analysis; they are evolutionarily relevant because they represent complex/composite areas, implying a suturing of different biogeographical and ecological histories (Craw, Grehan, & Heads, 1999; Morrone, 2015b).
A track analysis consists of three basic steps (Morrone, 2015b): (i) constructing individual tracks (IT) for more than two different taxa, through a minimal spanning tree (Escalante et al., 2017); (ii) obtaining generalized tracks (GT) based on the superposition of more than two different individual tracks; and (iii) identifying panbiogeographical nodes (PN) at the intersections of two or more generalized tracks. Moreover, it has been proposed that there are node-diverse geographical areas which contain many PN and that represent complex areas (Miguel-Talonia and Escalante, 2013).
There are several quantitative methods proposed to perform a track analysis. The most widely used (Morrone, 2015b) is parsimony analysis of endemicity or PAE (see Echeverry & Morrone, 2010). It is based on a parsimony algorithm which finds the patterns that represent the generalized tracks in an area's cladogram. Methods based on Geographic Information Systems (Liria, 2008) and others developed to identify areas of endemism (Analysis of Endemicity or AE; Fernández-Badillo, Goyenechea, & Escalante, 2014) have also been proposed to find generalized tracks. In addition, there are software packages explicitly developed for panbiogeography, such as Trazos2004 (Rojas-Parra, 2007), Croizat (Cavalcanti, 2009) and MartiTracks (Echeverría-Londoño & Miranda-Esquivel, 2011). Trazos2004 draws an influence area to identify generalized tracks, while Croizat applies an algorithm of compatibility to find cliques, and MartiTracks compares the spatial congruence of segments of tracks (Escalante et al., 2017). Despite the multiplicity of methods, Morrone (2014b, 2015b) cautioned that most methodologies consider any overlap between parts of two or more of the individual tracks as a generalized track, without considering how significant that overlap is.
There are few evaluations of methods for identifying GT. Ferrari, Barao, and Simoes (2013) compared the performance of MartiTracks with PAE and track compatibility, finding that MartiTracks does not provide reliable results because it lacks clear congruence criteria—the parameter definition is subjective and has unclear analytical procedures. Montiel-Canales, Goyenechea, Fernández-Badillo, and Castillo-Cerón (2016) compared PAE and AE and concluded that these two methods can be complementary. Escalante et al. (2017) proposed the construction of connectivity matrices, but this requires high concordance in localities of taxa. At this time, PAE seems to be the most reliable option for finding generalized tracks.
Our aims are twofold: (i) to identify generalized tracks and panbiogeographic nodes in the Nearctic region and (ii) to propose an updated point of view of complex areas and their boundaries in North America, based on the geographic distributions of terrestrial mammals.
2 MATERIAL AND METHODS
2.1 Data
We used data from the Biogeographic Atlas of the North American terrestrial mammals (Escalante, 2013a, 2013b). This atlas is an effort to synthesize the distributional patterns of the mammal species distributed from Alaska and Canada to Panama before 2011. Since then, several nomenclatural and geographical changes have occurred; therefore, we updated the Atlas database to incorporate recent references. The final database contains 226,942 records of 697 species of mammals. The species with the most records was Peromyscus maniculatus with 11,711, followed by Tamiasciurus hudsonicus (4,622) and Thomomys bottae (3,982). There are two species with only one record (Glyphonycteris sylvestris and Habromys simulatus), and one species with two records (Cratogeomys planiceps) in the database.
Individual tracks were constructed for the 574 species distributed exclusively in North America (not in South America) with more than one record, using the Prim algorithm and geographic distances (Escalante et al., 2017) with the fossil package (Vavrek, 2011) in R-Cran (R Core Team, 2015). Maps were developed in QGIS Desktop v. 2.18.7 (QGIS Development Team, 2016).
2.2 Parsimony analysis of endemicity
We follow the Echeverry and Morrone (2010) steps for PAE. Individual tracks for 574 species were superimposed on a 4° latitude–longitude grid of North America to build a binary matrix showing the presence (1) or absence (0). A total of 323 quadrats were occupied by at least one species; therefore, the matrix had 574 species and 323 quadrats (including the outgroup coded with “0”). A PAE of the data matrix was undertaken to identify the generalized tracks (GT). PAE was performed in TNT v. 1.5 (Goloboff & Catalano, 2016; Goloboff, Farris, & Nixon, 2008; http://www.lillo.org.ar/phylogeny/tnt/), applying the New Technology algorithm, finding the minimum length five times and saving 999 trees, and using sectorial search, ratchet, and drift with default options. Implied weighting was used with k = 3.0 and random seed = 1. Implied weighting allows to maximize the synapomorphies, restricting homoplasy due by widespread taxa (Luna-Vega, Alcántara-Ayala, Morrone, & Espinosa-Organista, 2000). Generalized tracks (GT) were identified in the main clades supported by two or more individual tracks with ci (consistency index) = 1.0. Moreover, we considered also species with ci = 0.5 and ci = 0.3 with reversions as possible taxa supporting GT (Escalante, 2015; Escalante, Espinosa, & Morrone, 2003).
All species supporting clades were used to build the GT in Trazos2004 (Rojas-Parra, 2007).
2.3 PAE with progressive character elimination (PAE–PCE)
A PAE–PCE was performed in TNT v. 1.5 (Goloboff & Catalano, 2016; Goloboff et al., 2008; http://www.lillo.org.ar/phylogeny/tnt/). The PCE includes the remotion of the individual tracks supporting the clades obtained previously (synapomorphies are deleted from the original matrix).
2.4 Characterization and panbiogeographic nodes
Generalized tracks were named using the main physical features (which include elevation, environment and relief) and provinces (Escalante et al., 2013; Morrone, 2014a, 2017; Natural Earth, 2017; Patterson, 2008). All GTs, with and without nested patterns, were superimposed to obtain panbiogeographic nodes (PN), using Trazos2004 (Rojas-Parra, 2007). PN were characterized in their location, ecoregions (Olson et al., 2001), and physical features (Natural Earth, 2017).
3 RESULTS
The most diverse quadrat had 137 species, and there were 60 quadrats with only one species. Moreover, there were ten species that occupied more than 100 quadrats, and 63 species that were found in only one quadrat.
3.1 Parsimony analysis of endemicity
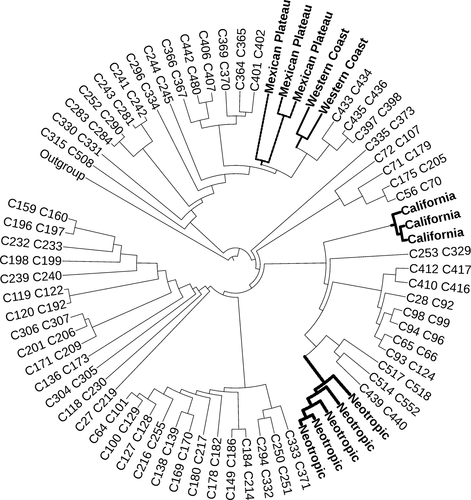
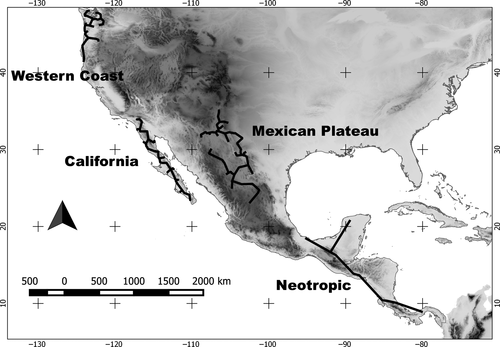
The parsimony analysis resulted in a cladogram with L (longitude) = 3,490, CI (Consistency index) = 0.16 and RI (Retention index) = 0.63 (Figure 1). The cladogram was fully resolved, including groups of quadrats of frozen land (Ice, Alaska, and Northern Canada) without two or more synapomorphies. Four clades were identified as generalized tracks, supported by at least two species with ci ≤ 1.0 (Tables 1–4): California, Mexican Plateau, Neotropic, and Western Coast of USA (Figure 2). All GTs showed successively nested pattern, meaning that each GT had at least one smaller GT inside it.
| Generalized track | Nested track | Nested track | Nested track |
|---|---|---|---|
| California [Chaetodipus arenarius (0.50), Dipodomys simulans (0.33), Neotoma bryanti (1.0)] | 1.1 [Chaetodipus fallax (0.50), Microtus californicus (0.33), Peromyscus eva (0.50), Peromyscus fraterculus (0.33), Tamias obscurus (0.33)] | 1.1.1 [Chaetodipus californicus (1.0), Sorex ornatus (1.0)] | 1.1.1.1 [Ammospermophilus nelsoni (1.0), Dipodomys nitratoides (1.0), Tamias merriami (1.0)] |
| Generalized track | Nested track | Nested track |
|---|---|---|
| Mexican Plateau [Ammospermophilus interpres (0.25), Chaetodipus eremicus (0.33), Onychomys arenicola (0.33), Sylvilagus robustus (0.33)] | 2.1 [Myotis ciliolabrum (0.50), Myotis occultus (0.50), Neotoma stephensi (1.0), Tamias canipes (0.50)] | 2.1.1 [Neotoma angustapalata (1.0), Peromyscus ochraventer (1.0)] |
| 2.1.2 [Nelsonia neotomodon (0.5), Tamias durangae (1.0)] |
| Generalized track | Nested track | Nested track | Nested track | Nested track | Nested track |
|---|---|---|---|---|---|
| Neotropic [Eumops bonariensis nanus (0.33), Pteronotus gymnonotus (0.25), Sphiggurus mexicanus (0.25)] | 3.1 [Ectophylla alba (0.33), Melanomys caliginosus (0.33), Micronycteris hirsuta (0.50)] | 3.1.1 [Bassaricyon gabbii (1.0), Micronycteris minuta (0.33), Myotis riparius (0.50), Transandinomys bolivaris (0.50), Tylomys watsoni (0.333), Vampyressa nymphaea (0.50)] | 3.1.1.1 [Cryptotis gracilis (1.0), Orthogeomys cherriei (1.0), Reithrodontomys creper (1.0), Reithrodontomys rodriguezi (0.50), Scotinomys xerampelinus (0.50)] | 3.1.1.1.1 [Cryptotis orophila (1.0), Oligoryzomys vegetus (1.0), Orthogeomys heterodus (1.0), Rheomys underwoodi (1.0), Sturnira mordax (1.0), Sylvilagus dicei (1.0)] | 3.1.1.1.1.1 [Heteromys oresterus (1.0), Marmosa robinsoni (1.0), Orthogeomys cavator (1.0)] |
| 3.2 [Alouatta pigra (0.33), Bassariscus sumichrasti (1.0)] | 3.2.1 [Molossus aztecus (0.33), Orthogeomys grandis (0.50), Sorex veraepacis (0.33)] | 3.2.1.1 [Musonycteris harrisoni (0.50), Osgoodomys banderanus (1.0)] |
3.2.1.1.1 [Cryptotis tropicalis (1.0), Heteromys nelsoni (1.0), Microtus guatemalensis (1.0), Oryzomys rhabdops (1.0), Peromyscus guatemalensis (1.0)] Peromyscus zarhynchus (1.0), Reithrodontomys tenuirostris (1.0), Tylomys tumbalensis (1.0)] |
||
| 3.2.1.2.1 [Baeodon alleni (1.0), Baeodon gracilis (1.0), Cryptotis alticola (1.0), Notocitellus adocetus (0.50), Peromyscus hylocetes (0.50), Peromyscus perfulvus (1.0), Sorex mediopua (0.50) | 3.2.1.2.1.1 [Megadontomys cryophilus (1.0), Peromyscus melanocarpus (1.0)] | ||||
| 3.2.1.2.1.2 [Notocitellus annulatus (1.0), Pappogeomys bulleri (1.0), Reithrodontomys hirsutus (1.0), Xenomys nelsoni (1.0)] |
| Generalized track | Nested track | Nested track | Nested track |
|---|---|---|---|
| Western Coast [Scapanus townsendii (1.0), Sorex bairdi (0.33), Sorex bendirii (0.50)] | 4.1 [Arborimus albipes (1.0), Myodes californicus (0.50), Sorex pacificus (0.50), Thomomys mazama (0.50)] | 4.1.1 [Arborimus longicaudus (1.0), Sorex sonomae (1.0), Tamias siskiyou (1.0)] | 4.1.1.1 [Microtus canicaudus (1.0), Thomomys bulbivorus (1.0)] |
3.2 California
This track corresponds to the Nearctic region. It was identified by three species distributed in the Baja California Peninsula (Table 1). California includes a GT with five species (nested track 1.1); one GT is nested with two species (nested track 1.1.1) and the last nested GT had three species (nested track 1.1.1.1). In total, thirteen species formed this pattern, some of them with ci = 1.0. Although the GT involves the Baja California peninsula, there are two patterns within: one corresponds to species in the northern (nested track 1.1.1) and the other to the southern part of the peninsula except El Cabo (nested track 1.1).
3.3 Mexican Plateau
Four species diagnosed this Nearctic track, although none of them had a ci = 1.0. There are twelve species in this pattern at three levels of nesting, several with ci = 1.0 (Table 2). Inside the track, there are three nested differentiated patterns: 2.1 to the north; 2.1.1, which is located in the southwest, and 2.1.2 in the southeast of the Mexican Plateau.
3.4 Neotropic
This GT belongs to the Neotropical region. It is supported by a large number of species, and it has a complex nested arrangement (Table 3). Forty-seven species occupy this pattern, but some are widely distributed while others have restricted distributions, with narrowly distributed species belonging to the more inclusive levels of nesting (v. gr. tracks 3.1.1.1.1, 3.1.1.1.1.1 and similar). Those species are distributed at the boundaries between the Neotropic and Nearctic regions, that is, the Mexican transition zone; while others continue their distribution beyond Panama.
3.5 Western Coast
A track identified on the northwestern coast of the USA is representative of the Nearctic region (Table 4). There are three species supporting this pattern, which has two nested tracks with four and five species.
3.6 PAE with progressive character elimination
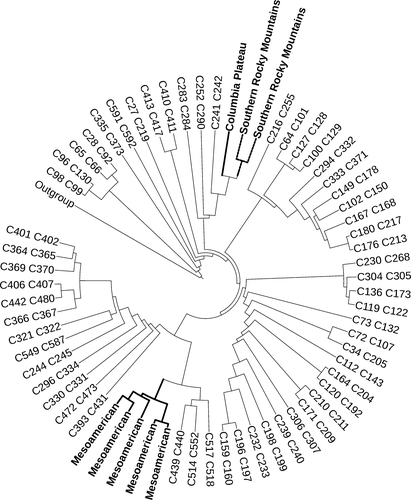
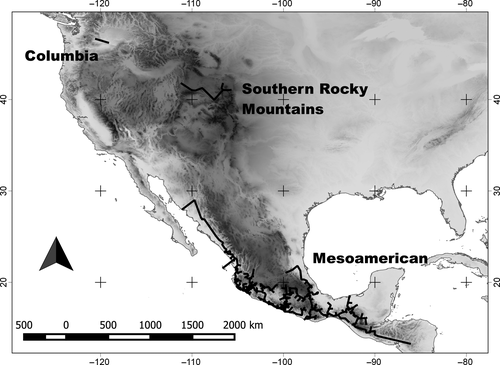
After the elimination of 84 synapomorphies, the cladogram resulting from the PAE-PCE had 3,268 steps, CI = 0.15 and RI = 0.64. The cladogram was fully resolved (Figure 3). We found three additional GT, supported at least by two species with ci ≤ 1.0 (Tables 5–7): Columbia Plateau, Mesoamerican, and Southern Rocky Mountains (Figure 4). Only the Columbian Plateau did not have a successively nested pattern.
| Generalized track |
|---|
| Columbia Plateau [Urocitellus townsendii (1.0), Urocitellus washingtoni (0.50)] |
| Generalized track | Nested track | Nested track |
|---|---|---|
| Mesoamerican [Baiomys musculus (0.25), Hodomys alleni (0.50), Macrotus waterhousii (0.25), Molossus sinaloae (0.25), Myotis fortidens (0.25), Oryzomys melanotis (0.33), Reithrodontomys sumichrasti (0.33), Rhogeessa parvula (0.33), Sciurus aureogaster (0.25), Sigmodon alleni (0.33), Sigmodon mascotensis (0.50), Spilogale pygmaea (0.33), Sylvilagus cunicularius (0.50)] | 6.1 [Artibeus hirsutus (0.50), Megasorex gigas (0.50), Peromyscus melanotis (0.25)] | 6.1.1 [Cryptotis mexicana (0.50), Heteromys desmarestianus (0.33), Liomys salvini (0.25), Oryzomys chapmani (0.33), Oryzomys rostratus (0.25), Peromyscus beatae (0.50), Peromyscus furvus (0.50), Sciurus deppei (0.25), Sorex saussurei (0.50), Sorex veraecrucis (0.50), Tylomys nudicaudus (0.25)] |
|
6.2 [Dipodomys nelsoni (0.25), Notiosorex evotis (0.50), Sciurus colliaei (0.33), Sciurus nayaritensis (0.25)] |
| Generalized track | Nested track | Nested track |
|---|---|---|
| Southern Rocky Mountains [Aplodontia rufa (0.33), Tamias senex (0.50), Thomomys monticola (0.33)] | 7.1 [Dipodomys panamintinus (0.50), Sorex tenellus (0.33), Tamias quadrimaculatus (1.0), Tamias speciosus (0.50)] | 7.1.1 [Tamias alpinus (1.0), Tamias panamintinus (0.50)] |
3.7 Columbia Plateau
This Nearctic track is located in the Columbia Plateau. It is composed of two species of the genus Urocitellus, although one species had a ci = 0.5 (Table 5).
3.8 Mesoamerican
Thirteen species diagnosed this GT. It is similar to the Neotropic GT but reaches farther north and ends in northern Nicaragua. This track had two nested generalized tracks (Table 6): one in Sierra Madre del Sur, Sierra Madre Oriental, Sierra de Chiapas and Central America (nested tracks 6.1 and 6.1.1 with three and eleven species respectively), and the other in Sierra Madre Occidental and central Mexico (nested track 6.2 with four species). For this GT alone, we also considered species with ci = 0.25, as this pattern is very complex.
3.9 Southern Rocky Mountains
This GT is located in the western USA (Table 7) and is identified by three species. All of them have ci < 1.0 and are distributed mainly near the coast. A nested track involves four species covering more mountainous areas, and two species of the genus Tamias.
A second PAE-PCE was run after the elimination of 42 synapomorphies, obtaining two cladograms. Their strict consensus had L = 3,530, CI = 0.16 and RI = 0.63. The consensus cladogram showed some polytomies and few informative synapomorphies for our aim and scale. The new clades represented few quadrats (very small generalized tracks in two or three quadrats); therefore, we considered they should be analyzed with a finer scale (may be quadrats of 1° or 2° latitude–longitude).
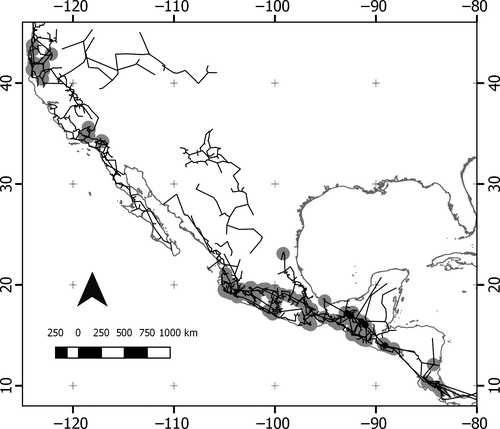
Nine panbiogeographic nodes (PNs) were identified resulting from the overlap of the seven GTs (without nested patterns). Eight of these were located in the Sierra of Chiapas physical feature, belonging to the Chiapas Highlands and Chiapas and Petén-Veracruz mountain forest ecoregions. The remaining PN was located in the Central America physical feature, in the Central America pine-oak forests ecoregion.
When we superimposed all GTs including their nested patterns, 192 nodes were identified (Figure 5; Table S1). All of them are included in only eight physical features and 27 ecoregions (Table 8).
| Number of nodes | Overlapped tracks | Physical featuresa | Ecoregionsb |
|---|---|---|---|
| 1 | Southern Rocky Mountains and Western Coast | Cascade range | Central and Southern Cascades forests |
| 10 | Southern Rocky Mountains and Western Coast | Coast ranges | Central Pacific coastal forests, Klamath-Siskiyou forests, Northern California coastal forests |
| 7 | Southern Rocky Mountains and California | Sierra Nevada | California montane chaparral and woodlands, Mojave desert |
| 1 | Mexican Plateau and Mesoamerican | Sierra Madre Oriental | Sierra Madre Oriental pine-oak forests |
| 69 | Mesoamerican and Neotropic | Sierra de Chiapas | Central American montane forests, Central American pine-oak forests, Chiapas montane forests, Chimalapas montane forests, Petén-Veracruz moist forests, Sierra Madre de Chiapas moist forests, Southern Pacific dry forests |
| 94 | Mesoamerican and Neotropic | Sierra Madre del Sur | Balsas dry forests, Jalisco dry forests, Oaxacan montane forests, Sierra de los Tuxtlas, Sierra Madre de Oaxaca pine-oak forests, Sierra Madre del Sur pine-oak forests, Southern Pacific dry forests, Tehuacán Valley matorral, Trans-Mexican Volcanic Belt pine-oak forests |
| 1 | Mesoamerican and Neotropic | Sierra Madre Occidental | Sinaloan dry forests |
| 9 | Mesoamerican and Neotropic | Central America | Costa Rican seasonal moist forests, Isthmian-Atlantic moist forests, Talamancan montane forests |
4 DISCUSSION
The geological history of North America is complex, which is reflected in the patterns found in this study. Some of the GTs are located mainly in lowlands and plains, such as California, Columbia Plateau, Mexican Plateau, and Neotropic, while others include mainly mountainous areas (e.g., Mesoamerican and Southern Rocky Mountains). There are few published panbiogeographic analyses including North America with which to compare our results (Campos-Soldini, García, & Safenraiter, 2015; Contreras-Medina, Luna, & Morrone, 1999; Mercado-Salas, Pozo, Morrone, & Suárez-Morales, 2012; Palma-Ramírez, Goyenechea, & Castillo-Cerón, 2014) as well as some South American studies (Echeverry & Morrone, 2013; Quijano-Abril, Callejas-Posada, & Miranda-Esquivel, 2006). In general, all published analyses coincided with western and central differentiated patterns in the Nearctic region and the Mesoamerican and Neotropical patterns.
The Western Coast GT is confirmed for plants (Contreras-Medina et al., 1999; Palma-Ramírez et al., 2014), beetles (Campos-Soldini et al., 2015), and mammals (this work). Our Columbia Plateau GT probably also belongs to this western pattern. There are many allochthonous terranes (accreted lithospheric blocks) that form the western margin of the North American craton where the California and Western Coast GT are located (Ben-Avraham, 1981; Monroe & Wicander, 2015). Moreover, some orogenies formed the structural features of these zones (Monroe & Wicander, 2015), and they could be isolated by the North American Cordillera. On the other hand, the geological history of eastern North America is different in that it was influenced by depositions and the geology of the Appalachian mountains (Monroe & Wicander, 2015). These events have not formed identifiable mammalian patterns.
The California GT has been reported for taxa other than mammals, including birds, beetles, and plants (e.g., Álvarez-Mondragón & Morrone, 2004; Morrone & Márquez, 2003). The California Peninsula was joined to the continent during the Mesozoic and almost all Cenozoic; later, it suffered displacement 4 Ma ago, causing isolation of biota, which includes many endemic taxa.
The nested generalized tracks of the western pattern and California GT produced nodes predicting highly complex areas on the west coast of North America. These nodes coincide with high tectonic activity mountain chains and rugged topography, due to an active continental margin between North American, Pacific, and Juan de Fuca lithospheric plates, near Cape Mendocino (Crowell, 1986).
In central North America, a pattern is represented by our Southern Rocky Mountains GT. It is possible that the Mexican Plateau GT is related to those mountains, since various taxa formed a unique GT (Palma-Ramírez et al., 2014), even extending to Mesoamerica (Campos-Soldini et al., 2015; Mercado-Salas et al., 2012). The Mexican Plateau is flanked by the main mountain chains in Mexico: Sierra Madre Oriental and Occidental and Transmexican Volcanic Belt, which are geologically more recent and have different origin and lithology (Viniegra, 1992). Those mountainous chains have acted as barriers stopping the dispersion of the Nearctic biota to the south.
For Echeverry and Morrone (2013), the Mesoamerican GT ends at the Motagua–Polochic Fault Zone, the boundary between the North American and Caribbean plates, and they suggest that this GT is a major barrier, emphasizing the plate boundary area, a transformal fault zone and possibly an alternative boundary between the Nearctic and Neotropical biotas. The Mesoamerican pattern was also proposed by Morrone and Márquez (2003). Although the Mesoamerican and Neotropic TG are similar, some authors also accept an area called Mesoamerica or a Mesoamerican dominion belonging to the Caribbean subregion, which harbors high species richness and endemism, and includes both mountainous and lowland areas (Ríos-Muñoz, 2013; Sánchez-González, Navarro-Sigüenza, Ornelas, & Morrone, 2013).
The Neotropic GT is strongly defined by several taxa, which begins in the tropical lowlands of Mexico and continues to Argentina (Morrone, Escalante, & Rodríguez-Tapia, 2017). This pattern is located on three tectonic plates—the North American, Caribbean, and South American plates—which differ greatly from each other in their geological histories (Antonelli & Sanmartín, 2011). With respect to the northern pattern, the Panama Isthmus has been influenced by many tectonic events, from the late Cretaceous to its formation ca. 2.8 Ma (O'Dea et al., 2016). This land bridge has been postulated as responsible for the biotic interchange of previously isolated terrestrial species (named Great American Biotic Interchange, GABI; Stehli & Webb, 1985; see O'Dea et al., 2016). For mammals, the Neotropic GT held the highest species richness and nesting.
The main nine nodes are located in the Chiapas Highlands province (Morrone et al., 2017) and one in Central America, both being node-diverse geographical areas. Other plant and animal taxa coincide in the location of their nodes in southern Chiapas (Echeverry & Morrone, 2013; see also their Appendix 3). On the other hand, most of the nodes resulting from the intersection of the nested Mesoamerican and Neotropic GTs are located in highlands, mainly in the Transmexican Volcanic Belt and Sierra Madre del Sur provinces (Morrone et al., 2017) in the Mexican transition zone, although there are nodes in Pacific lowlands as well. This has been found in other panbiogeographic analyses with birds (Álvarez-Mondragón & Morrone, 2004), beetles (Corona, Toledo, & Morrone, 2009; Márquez & Morrone, 2003), nematodes (Escalante, Martínez, Falcón-Ordaz, Linaje, & Guerrero, 2011), and reinforced by Mexican mammals (Escalante, Rodríguez, & Morrone, 2004; García-Marmolejo, Escalante, & Morrone, 2008).
The Transmexican Volcanic Belt is a Neogene volcanic arc, located on the southern edge of the North America plate, which overrides the Rivera microplate and the northern part of the Cocos plate (Ferrari, Orozco-Esquivel, Manea, & Manea, 2012). This belt has different age and lithology along its length, with events that occurred in four stages, from the upper Miocene to the late Pliocene–Quaternary (Ferrari, 2000; Ferrari et al., 2012). Despite its differentiated geologic history in its western and eastern sections, the Transmexican Volcanic Belt has been suggested as a barrier between Nearctic and Neotropical biota under other methodologies (Marshall & Liebherr, 2000). Also, it has been postulated that the geologic history of this belt had an important influence in the diversification of some taxa (Mastretta-Yanes, Moreno-Letelier, Piñero, Jorgensen, & Emerson, 2015; Ruiz-Sanchez & Specht, 2013).
Biogeographic patterns of mammals in North America are closely linked to the geologic history of the American Continent. At least five generalized tracks with nesting represent the geographic patterns of mammals in the Nearctic region: California, Columbia Plateau, Mexican Plateau, Southern Rocky Mountains, and Western Coast of USA. Moreover, one generalized track is in the Mexican transition zone (Mesoamerican) and one belonging to the Neotropical region. The areas of highest biotic complexity (panbiogeographic nodes) are located mainly in areas with a high degree of geologic activity, resulting from the movement of the tectonic plates and volcanism. These nodes are on the west coast of the USA, California, the highlands of central Mexico (Transmexican Volcanic Belt) and Chiapas–Guatemala.
Nodes are related with geomorphological features of North America and Central America, mainly on mountain belts uplifted due to geologic processes. For example, 11 nodes were identified in the Southern Rocky Mountains and Western Coast (cascade range and coast ranges). These results are consistent with the biogeographic complexity of the two areas; both integrate a gradient of geologic and climatic conditions (Ohmann & Spies, 1998). The cascade range (Central and Southern Cascades forests) is related to dense canopies or riparian vegetation, high summer rainfall and seasonal precipitation; while in Coast Ranges (Oregon Coast), the moisture is more limiting and temperatures are colder and variable (Ohmann & Spies, 1998).
On the other hand, 69 nodes were identified in the physical feature named Sierra de Chiapas, which includes a central depression, two mountain chains (Chiapas massif and the Modern volcanic arc), and the Maya mountains of Belize. The Chiapas massif was originated during the Late Permian, and the Modern volcanic arc was formed during the last 3 Ma by intensive volcanic activity (Manea & Manea, 2006). The Central depression of Chiapas is located between the Chiapas massif and the Modern volcanic arc, developed by Quaternary deposits and marine sediments from different geologic periods (Gutiérrez-García & Vázquez-Domínguez, 2013). The Maya mountains of Belize are an uplifted block of Paleozoic meta sediments and Triassic intrusives with three ancient granitic intrusive complexes (230 Ma) (Gutiérrez-García & Vázquez-Domínguez, 2013). As a whole, this area is considered as complex zone due to the high rate of genetic differentiation in populations distributed near to a geologic or geographic barrier (see Gutiérrez-García & Vázquez-Domínguez, 2013).
We identified 94 nodes in the Sierra Madre del Sur and the Trans-Mexican Volcanic Belt. These areas have undergone stronger geological and climatic changes. For example, the Sierra Madre del Sur was more humid at the end of the Pleistocene, but currently is composed by pine-oak and dry forests (Ferrusquía-Villafranca et al., 2017). The Transmexican Volcanic Belt is quite different from northern and southern Mexico, but at the terminal Pleistocene seems to have been very dry in many areas, with wetter conditions being established in the early Holocene (Metcalfe, 2006). Those changes in the Sierra Madre del Sur and the Trans-Mexican Volcanic Belt have led the Neotropical and the Nearctic biota to integrate themselves into the Mexican transition zone (Morrone, 2015a).
Molecular panbiogeography may be the next step in the research of general biogeographic patterns in North America. The inclusion of phylogenetic information, lineage dating, and time-slicing could help to improve the understanding of the influence of tectonic changes in the geographic distribution of biota (Corral-Rosas & Morrone, 2017; Heads, 2009). For example, it is possible to analyze the distribution of Romerolagus and other species in panbiogeographical nodes belonging to the Guerrero terrane (Transmexican Volcanic Belt), which could be important because this species is basal in the clade of rabbits and hares (Heads, 2009). Finally, glaciations had many effects on the distribution of biota (Monroe & Wicander, 2015); therefore, it is necessary to incorporate many processes in explanations, as ecological and geological processes act synergistically to shape the biogeographic patterns of the biota.
ACKNOWLEDGEMENTS
Martín Yair Cabrera Garrido and Oscar Aguado-Bautista performed the nomenclatural and geographic revision of the database. Bruno Pimentel Reyes and Linda M. Guevara Juárez help us with the building of individual tracks. EAN-U thanks to the Posgrado en Ciencias Biológicas, UNAM and The National Council for Science and Technology (CONACYT), Mexico for providing funding and facilities to carry out his Doctoral studies (scholarship 290840).


