Biological variation of urinary protein: Creatinine ratio and urine specific gravity in cats
Abstract
Background
Laboratory results are influenced by presence and severity of disease, as well as preanalytical factors, analytical variation, and biological variation. Biological variation data for urinary protein: creatinine ratio (UPC) and urine specific gravity (USG) in cats are lacking.
Objectives
Determine the biological variation of UPC and USG in cats.
Animals
Eighty healthy client-owned cats.
Methods
Prospective study. Urine was collected on days 0, 14, and 56 from all 80 cats to investigate the persistence of borderline or overt proteinuria or suboptimal urine concentration. In 15 of these cats, urine was collected weekly from day 0 to 42 to calculate the index of individuality (II) and reference change value (RCV), and on days 56 and 57 to evaluate day-to-day variability of UPC and USG.
Results
Borderline or overt proteinuria (UPC ≥0.2) was present in 18/80 (23%) cats at baseline and persisted on 3 occasions in 2 months in 8/18 (44%) cats. Urine concentration was suboptimal at inclusion (USG <1.035) in 8/80 (10%) cats and at all 3 time points during 2 months in 3/8 (38%) cats. The II of UPC and USG indicated intermediate individuality. The 1-sided RCV was 82% for UPC and 36% for USG. Proteinuria substage was identical on 2 consecutive days in 13/15 (87%) cats, and urine concentrating ability remained the same in all 15 cats.
Conclusions and Clinical Importance
A >82% increase in UPC in a healthy cat is not solely attributable to physiological and analytical variation. For USG, a decrease of >36% is considered clinically relevant.
Abbreviations
-
- CKD
-
- chronic kidney disease
-
- CV
-
- coefficient of variation
-
- CVA
-
- analytical variation
-
- CVG
-
- between-subject variation
-
- CVI
-
- within-subject variation
-
- FeLV
-
- feline leukemia virus
-
- FIV
-
- feline immunodeficiency virus
-
- II
-
- index of individuality
-
- IRIS
-
- International Renal Interest Society
-
- RCV
-
- reference change value
-
- SDMA
-
- symmetric dimethylarginine
-
- UC
-
- urinary creatinine concentration
-
- UP
-
- urinary protein concentration
-
- UPC
-
- urinary protein : creatinine ratio
-
- USG
-
- urine specific gravity
1 INTRODUCTION
Diagnosis of chronic kidney disease (CKD) is usually based on the combination of increased serum or plasma biomarkers (creatinine and symmetric dimethylarginine [SDMA]) and decreased urine concentration (urine specific gravity [USG] <1.035 in cats) or on persistent renal proteinuria (urinary protein: creatinine ratio [UPC] >0.4 in cats).1 When monitoring a cat with CKD, deterioration or improvement of blood and urine variables often is attributed to progression of disease or response to treatment, respectively. However, laboratory results are not only impacted by presence and severity of disease.2 A specific laboratory value in the same cat also can vary among measurements because of preanalytical causes (eg, method of sampling, sample storage conditions), analytical causes (eg, inter- and intralaboratory variability), and biological variation.2 Biological variation is the physiological fluctuation of an analyte concentration that can occur around a homeostatic set point within the same animal.2, 3 When serial laboratory results of the same animal are interpreted, the changes among subsequent measurements must be more than the variation that can be attributed to analytical and biological variation in order to be a real change and not just the result of measurement imprecision or physiological variation.3 For this purpose, the reference change value (RCV) is used, which is the difference that is required between 2 serial results from an individual in order for the change to be clinically relevant.2, 4
Whether the RCV should be applied when monitoring a laboratory value, depends on the analyte's index of individuality (II). For analytes with high individuality (II >1.67), there is less variability between the individual's results for that laboratory value than among results of different individuals from the same population. A limited change among serial results of the same animal could then already be clinically important, rendering population-based reference intervals of low utility and the RCV better suited to detect relevant changes in serial results. For analytes with low individuality (II <0.7), meaning there is less variation among different individuals of the same population, traditional population-based reference intervals generally are useful.2, 3 When the II is moderate (0.7-1.67), both population-based reference intervals and the RCV may be helpful for detecting changes in serial results and diagnosing disease.3
Several studies in cats have focused on the biological variation of serum and plasma analytes, but not on UPC or USG.5-9 Recent studies have investigated preanalytical and analytical factors influencing these urinary variables, but information on biological variation of these biomarkers in cats is lacking.10-15 This situation is in contrast to dogs, for which 1 study reported the RCV to be 35% at high UPC values (near 12) and 80% at low UPC values (near 0.5).16 Previous articles stated that serial UPC values in cats need to differ by 90% to conclude that the level of proteinuria has increased, and that the goal of treatment in case of proteinuria is to achieve a > 90% decrease in UPC.17, 18 However, evidence to support these statements has been lacking.
International Renal Interest Society (IRIS) guidelines recommend substaging cats with CKD based on ≥2 urine samples collected over a period of ≥2 weeks.19 Cats with CKD and borderline (UPC 0.2-0.4) or overt (UPC >0.4) proteinuria have a worse prognosis compared to nonproteinuric cats (UPC <0.2).20, 21 Although borderline proteinuria is not an uncommon finding in healthy nonazotemic cats,22-25 its clinical relevance is currently unknown, as is the persistence rate of borderline proteinuria in healthy cats. Also according to IRIS guidelines, inadequate urine concentrating ability without an identifiable nonrenal cause is compatible with stage 1 CKD in cats with normal serum creatinine concentration and normal or mildly increased serum SDMA concentration.19 A USG <1.035 was found in 6%-19% of healthy cats in different studies.22, 25-27 The clinical relevance of a single decreased USG value in healthy cats and its persistence rate are however equally unclear.
Our first aim was to determine the biological variation of UPC and USG in healthy adult cats, with prospective determination of the II and RCV. A second aim was to evaluate the persistence of borderline or overt proteinuria (UPC ≥0.2) or suboptimal urine concentration (USG <1.035) in healthy adult cats.
2 MATERIALS AND METHODS
Urine samples were prospectively collected from healthy client-owned cats from September 2019 to June 2022. Signed informed consent from the owner was required for participation. This study was approved by the Ethical Committee of the Faculty of Veterinary Medicine and the Faculty of Bioscience Engineering of Ghent University (Institutional Animal Care and Use Committee) and the Deontological Committee of the Belgian Federal Agency for the Safety of the Food Chain (EC 2018/54).
A schematic overview of study visits is shown in Figure 1. In all 80 included cats, UPC was assessed at baseline (day 0), 2 weeks (day 14) and 2 months (day 56) to evaluate the number of cats that were borderline or overtly proteinuric and the number of cats in which this borderline or overt proteinuria persisted. On the same days, USG was determined to evaluate the number of cats with suboptimal urine concentration (USG <1.035) and the frequency of persistence of this finding. In a subset of 15 cats, UPC and USG were assessed more frequently, namely at weekly intervals for 6 weeks (days 0, 7, 14, 21, 28, 35, and 42) to calculate the biological variation components, as recommended by published guidelines.2, 4 In these 15 cats, urine additionally was collected on 2 consecutive days (days 56 and 57) to evaluate the day-to-day variability of UPC and USG in healthy cats.

Cats needed to be adult (≥1 year old), healthy based on owner observations (ie, without clinical signs or changes in general behavior and with stable body weight), and not receiving medications (except preventive medications) for at least 2 months before inclusion. A history questionnaire was taken at the first consultation (day 0), and a complete physical examination including blood pressure measurement was performed. In cats with systolic blood pressure >160 mm Hg (Doppler), a fundoscopic examination was performed. If the fundoscopic examination was normal, blood pressure measurement was repeated during the next consultation to investigate persistence of hypertension.
Owners were asked to keep their cats fasted overnight before the first evaluation on day 0, but water could be given ad libitum. Blood was collected on day 0 and a CBC, serum biochemistry profile (including electrolytes, SDMA, total thyroxine, serum amyloid A and serum protein electrophoresis), feline immunodeficiency virus (FIV) antibody testing and feline leukemia virus (FeLV) antigen testing were performed by IDEXX Laboratories in Kornwestheim and Leipzig.
Urine samples were collected by ultrasound-guided cystocentesis using a 22G or 23G needle at each time point. Macroscopic and microscopic evaluation of urine samples and measurement of the USG using a handheld refractometer (MASTER-SUR/NM, Atago) were performed on site as soon as possible after cystocentesis by the same operator and first author of this study. The refractometer was calibrated monthly. Values above the upper limit of the reading scale (USG >1.060) were estimated visually. Sediment analysis was performed using an IDEXX SediVue Analyzer. Microscopic hematuria was considered present with erythrocyte counts of >15/high power field (hpf) and pyuria with leukocyte counts of >5/hpf. The remainder of the urine was sent overnight at ambient temperature, together with the blood samples, to a commercial laboratory (IDEXX Laboratories in Kornwestheim and Leipzig) where urine dipstick analysis and UPC measurement were performed. Bacterial culture of cystocentesis urine was performed on day 0 in all cats, and at a later time point only in cats with pyuria or suspicion of bacteriuria on urine sediment analysis during that visit. For UPC determination, urinary protein (UP) concentration was measured using pyrogallol red and urinary creatinine (UC) concentration using the Jaffe method.
One aliquot of urine supernatant per cat was immediately frozen (−80°C). Duplicate analysis of these aliquots was performed in batch on the same day after completion of the study to determine the analytical variation of UP, UC and UPC (n = 66 cats), and USG (n = 60 cats).
Cats with previously diagnosed metabolic or clinically relevant cardiovascular, inflammatory or systemic disease were excluded from the study, as were cats with abnormalities on the blood examination performed at day 0 indicating a metabolic or systemic disease (eg, CKD IRIS stages 2 or higher, hyperthyroidism, diabetes mellitus). Cats that tested positive for FIV antibodies or FeLV antigen were excluded, as were cats with a positive urine culture. Samples with macroscopic hematuria or pyuria on sediment examination at any time point were excluded as well. In case of systemic hypertension, cats were excluded if ocular lesions consistent with target organ damage were present or if hypertension was persistent. Owners were asked not to change the diet or administer any medications during the study period.
2.1 Statistical analysis
Normality of the observations and presence of outliers was checked through visual inspection (ie, normal probability plots and residual plots). Using restricted maximum likelihood (REML), the , , , and mean (μ) were estimated for UP, UC, UPC, and USG. The following coefficients of variation (CV) then were calculated for each urinary variable by dividing the estimated SD through the estimated mean: within-subject variation (), between-subject variation (), and analytical variation ().4 When the CVA : CVI ratio is calculated, a ratio <0.5 is known as “desirable imprecision,” meaning analytical variation does not significantly affect judgment of biological variation, and a CVA : CVI < 0.25 is considered compatible with “optimum performance.”3, 28 Subsequently, the II was calculated using the formula .2 A high II (>1.67) indicates a high degree of individuality, when II is between 0.7 and 1.67 there is intermediate individuality, and II <0.7 indicates low individuality.2 The RCV was calculated using the formula .2 For determination of RCV, 95% probability uni- and bidirectional changes were calculated using Z = 1.65 and Z = 1.96, respectively. For statistical analysis of USG, 1 was subtracted.29 The effect of microscopic hematuria on UPC was evaluated using a mixed model with cat as random effect and hematuria status as fixed effect. Statistical analysis was performed using SAS (version 9.4, SAS Institute, Inc, Cary, North Carolina).
3 RESULTS
3.1 Animals
Ninety-three apparently healthy cats were examined, but 13/94 (14%) subsequently were excluded because of the presence of CKD IRIS stage 2 or higher (n = 3), hyperthyroidism (n = 2), positive urine culture (n = 2), persistent macroscopic hematuria (n = 2), FIV antibodies (n = 2), pregnancy (n = 1), and laboratory misplacement of a urine sample (n = 1). Median age of the 80 included cats was 4 years (range, 1-15 years). Forty-eight cats were female (45 spayed) and 32 cats were male (all neutered). Cat breeds represented more than once were Domestic short- or longhair (n = 51), British short- or longhair (n = 9), Persian longhair (n = 4), Sphynx (n = 4), Birman (n = 3), Oriental shorthair (n = 3), and Russian blue (n = 2).
Systolic blood pressure could be measured according to the American College of Veterinary Internal Medicine (ACVIM) Consensus Guidelines30 on day 0 in 74/80 cats and ranged from 100 to 210 mm Hg (median, 140 mm Hg). In the 6 remaining cats, blood pressure could not be measured because of lack of cooperation. Hypertension (systolic blood pressure >160 mm Hg) was present in 7/74 (9.5%) cats. None of these cats showed abnormalities on fundoscopic examination and at the next reevaluation, systolic blood pressure was <160 mm Hg in 6/7 cats. One cat was persistently hypertensive (170 and 180 mm Hg) without signs of target organ damage and showed clear signs of stress during blood pressure measurement. This cat was nonproteinuric at the first 2 visits and borderline proteinuric at the third visit, and had well concentrated urine on all occasions. Blood pressure was reevaluated by the local veterinarian (shorter travel time) and was <160 mm Hg.
3.2 UPC and proteinuria substage
Median UPC for all 80 healthy cats on day 0 was 0.16 (range, 0.06-1.36). At inclusion, 62 (77%) cats were nonproteinuric (UPC <0.2), 15 (19%) cats were borderline proteinuric (UPC 0.2-0.4) and 3 (4%) cats were proteinuric (UPC >0.4). Renal proteinuria persisted after 2 weeks in 1/3 (33%) cats, but in none of these cats after 2 months (2 cats were borderline proteinuric and 1 cat nonproteinuric on day 56). Borderline proteinuria present at baseline persisted after 2 weeks in 11/15 (73%) cats, and at all 3 time points over a period of 2 months in 7/15 (47%) cats. Of the remaining borderline proteinuric cats, 7 became nonproteinuric and 1 proteinuric by day 56. Thus, 8/15 (53%) borderline proteinuric cats had a UPC persistently ≥0.2 at all 3 time points.
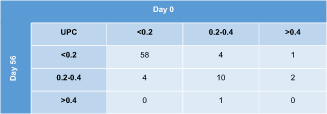
Contingency tables depicting agreement on IRIS proteinuria substages on subsequent evaluations of all 80 study cats are shown in Table 1 (day 0 vs 14) and Table 2 (day 0 vs 56). The UPC category was the same on all 3 visits in 57/80 (71%) cats (50 nonproteinuric, 7 borderline proteinuric). Of the 23 cats with a different substage after 2 weeks or 2 months compared to baseline, the difference was 1 substage in 21 cats (18 cats with both nonproteinuric and borderline proteinuric results, 3 cats with borderline and overtly proteinuric results) and 2 substages in 2 cats (having 1 nonproteinuric, 1 borderline, and 1 overtly proteinuric result over a period of 2 months). When calculating the absolute and percentage difference between the highest and lowest UPC value of each cat within the 2-month study period, the median difference was 0.05 (range, 0-1.11) or 37% (range, 3%-439%) for all 80 cats.

|
- Abbreviation: UPC, urinary protein : creatinine ratio.
|
- Abbreviation: UPC, urinary protein : creatinine ratio.
At the weekly consultations (day 0-42), proteinuria substage was the same on all 7 occasions in 7/15 (47%) cats (5 nonproteinuric, 2 borderline proteinuric). In 7 other cats, proteinuria substage differed between non- and borderline proteinuric for 1 or 2 of the 7 visits. The last cat was an exception and had a UPC <0.2 on 3 occasions, a UPC of 0.2-0.4 on 3 occasions and a UPC >0.4 on 1 occasion. When calculating the absolute and percentage difference between the highest and lowest UPC value of each cat within the 6-week study period, the median difference for all 15 cats was 0.10 (range, 0.04-0.35) or 73% (range, 40%-251%).
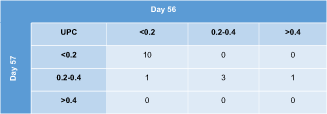
When measuring the UPC on 2 consecutive days (days 56-57) in 15 cats, proteinuria substage was identical in 13/15 (87%) cats. In the remaining 2 cats, there was 1 substage difference (Table 3). The median (range) difference between both UPC values was 0.03 (range, 0-0.17) or 20% (range, 1%-112%) for these 15 cats.
|
- Abbreviation: UPC, urinary protein : creatinine ratio.
Biological variation components based on weekly visits from 15 cats are shown in Table 4. The CVA : CVI ratio was <0.25 for all 3 urinary variables (UP, UC, and UPC), indicating optimal performance. Calculation of the II indicated intermediate individuality for UP, UC, and UPC.
| Analyte | CVI % | CVG % | CVA % | CVA : CVI ratio | II | RCV % (1-sided)a | RCV % (2-sided)b |
|---|---|---|---|---|---|---|---|
| UP | 34.3 | 23.3 | 3.0 | 0.08 | 0.7 | 80 | 95 |
| UC | 26.5 | 24.6 | 2.9 | 0.12 | 0.9 | 62 | 74 |
| UPC | 34.8 | 27.7 | 3.2 | 0.09 | 0.8 | 82 | 97 |
| USG | 15.5 | 15.3 | 0.4 | 0.02 | 1.0 | 36 | 43 |
- Abbreviations: CVI, within-subject variation; CVG, between-subject variation; CVA, analytical variation; II, index of individuality; RCV, reference change value.
- a 95% probability, unidirectional (Z = 1.65).
- b 95% probability, bidirectional (Z = 1.96).
Microscopic hematuria was present in 71/330 (21.5%) urine samples throughout the study and had a significant effect on UPC, with higher UPC values measured in samples with microscopic hematuria (difference of least squares means = −0.036, P = .03).
3.3 USG and urine concentrating ability
Median USG on day 0 was 1.048 (range, 1.008-1.060) for all 80 healthy cats. At baseline, 72 (90%) cats had a USG ≥1.035 and 8 cats (10%) had suboptimal urine concentration (USG <1.035). Suboptimal urine concentration was still present after 2 weeks in 5/8 (63%) cats and persisted at all 3 consultations in the 2-month period in 3/8 (38%) cats. Of the 3 cats with USG persistently <1.035, 2 cats were diagnosed with CKD IRIS stage 2 during a reevaluation 6 months later. The third cat was presented 5 months after the first consultation with arterial thromboembolism caused by hypertrophic cardiomyopathy (ACVIM stage C) and was euthanized.
Contingency tables displaying agreement on urine concentrating ability on subsequent evaluations of all 80 study cats are shown in Table 5 (day 0 vs 14) and Table 6 (day 0 vs 56). The USG category was the same at all 3 time points in 64/80 (80%) cats (61 cats always had USG ≥1.035 and 3 cats USG <1.035). When calculating the absolute and percentage difference between the highest and lowest USG value of each cat within the 2-month study period, the median difference was 0.010 (range, 0-0.046) or 22% (range, 0%-329%) for all 80 cats.

|
- Abbreviation: USG, urine specific gravity.

|
- Abbreviation: USG, urine specific gravity.
During the weekly visits, USG category was the same at all 7 times (day 0-42) in 10/15 (67%) cats. The remaining 5 cats had well concentrated urine at all consultations except for 1 (4/5 cats) or 2 (1/5 cats) visits. When calculating the absolute and percentage difference between the highest and lowest USG value of each cat within the 6-week study period, the median difference for all 15 cats was 0.012 (range, 0.004-0.035) or 28% (range, 8%-140%).
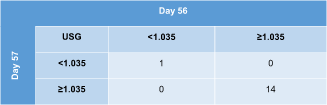
All 15 cats were assigned to the same USG category (≥1.035 or <1.035) on 2 consecutive days (days 56-57; Table 7). The median (range) difference between both USG values was 0.004 (range, 0.001-0.007) or 8% (range, 2%-14%) for these 15 cats.
|
- Abbreviation: USG, urine specific gravity.
Biological variation components for USG are depicted in Table 4. The CVA : CVI ratio was <0.25, indicating optimal performance, and the calculated II for USG was compatible with intermediate individuality.
4 DISCUSSION
The prevalence of suboptimal urine concentration (USG <1.035) at presentation was 10%, which is comparable with results of previous studies. One study in apparently healthy middle-aged and old cats found a single USG <1.035 without an increase in serum creatinine concentration in 7/99 (7%) cats.22 A second study in healthy cats 10 months or older detected a single USG <1.035 in 12/191 (6%) nonazotemic Ragdoll and control cats.25 A third study showed that USG was <1.035 in 94/976 (10%) apparently healthy adult cats, although underlying causes such as CKD and hyperthyroidism were excluded in only 43 of these 94 cats.27 In 2/7 (29%) cats from the latter study that had a subsequent evaluation performed, USG remained <1.035.27 A fourth study with healthy adult cats found USG <1.035 in 25/130 (19%) cats. Nine of these cats were reevaluated >2 years later and all had USG >1.035 at that time. Data on persistence of USG <1.035 in healthy cats are therefore limited, but our study showed persistently suboptimal urine concentration over 2 months in 3/8 (38%) cats presented with USG <1.035.
A UPC ≥0.2 was present in 18/80 (23%) healthy cats at baseline, with 15/80 (19%) borderline proteinuric and 3/80 (4%) proteinuric cats. This finding of 23% is slightly to markedly lower than the 27% (25% borderline and 2% proteinuric),22 29% (23% borderline and 6% proteinuric control cats),25 39% (28% borderline and 11% proteinuric Ragdoll cats),25 40% (all borderline proteinuric),23 and >50% (all borderline proteinuric)24 healthy cats in previously published studies. Renal proteinuria is considered persistent in cats when the UPC is >0.4 on ≥3 occasions ≥2 weeks apart.17 According to IRIS guidelines, substaging cats with CKD stage 1 or higher should be based on at least 2 UPC measurements over a period of at least 2 weeks, and cats that are persistently borderline proteinuric additionally should be reevaluated within 2 months, resulting in a total of 3 measurements during a 2-month period.19 No data are available about the rate of persistence of borderline and overt proteinuria in cats without CKD. Overt (renal) proteinuria was not persistent in any of the healthy cats of our population, but the number of proteinuric cats was small (n = 3). In the healthy cats presented with borderline proteinuria, UPC was persistently ≥0.2 in 8/15 (53%) of these cats on 3 occasions, ≥2 weeks apart, during a 2-month period.
Regarding day-to-day variability, proteinuria substage was identical on 2 consecutive days in most examined cats, and urine concentrating ability remained the same in all cats. If striking day-to-day variability had been observed, pooling of urine of 2-3 consecutive days before measurement of UPC or USG might have been appropriate, but results of these 15 healthy cats do not point in that direction. Studies in cats with CKD are needed to determine whether the same also applies to diseased cats.
For UP, UC, UPC and USG, CVA was <0.5 × CVI (and even <0.25 × CVI), indicating adequate and even optimal analytic precision for these analytes.5, 31 Replicate analysis was performed on frozen aliquots from 60 (USG) to 66 (UPC) study cats in batch after completion of the study using the same instruments as were used for the previous UPC and USG determinations, in order to determine CVA. This duplicate analysis resulted in similarly low CVA values for UP (2.9%) and UC (3.2%) as obtained by IDEXX Laboratories from internal quality control measurements (2.3% for UP and 2.2% for UC), and II and RCV obtained using both sets of CVA values were identical. The low CVA values in our study are also in concordance with results of a previous study indicating that intralaboratory variation is minimal for UP, UC, and UPC (intraclass correlation = 0.99 for all 3 urinary variables).14
Both UPC and USG, measured weekly in healthy cats during a 6-week period, had intermediate individuality (0.7 ≤ II ≤1.67). This result means that population-based reference intervals should be used with caution, and establishing the baseline value for each cat during health and subsequently applying RCVs to interpret serial measurements might improve early detection of clinically relevant changes in UPC or USG.7
For cats with a low UPC (≤0.4, as was the case for 96% healthy cats in our study), only an increase in UPC is clinically important, because it can indicate new or progressive renal disease once pre- and postrenal causes are excluded. Therefore, the 1-sided formula for RCV calculation was used, resulting in a RCV of 82% for UPC. This means that an increase in UPC of >82% is clinically relevant in healthy cats. When translating this RCV into a critical difference, this result implies that for a cat with a baseline UPC of 0.10, 0.15, or 0.20, an increase to >0.18, >0.27, or >0.36, respectively, is most likely clinically relevant, meaning there is 95% probability that the increase in UPC is not merely the result of physiological and analytical variation.2
On the other hand, when monitoring the response to treatment in proteinuric cats, a decrease in UPC also is clinically important. To investigate RCV for these cases, however, studies evaluating biological variation of UPC in proteinuric cats are needed.
Data regarding biological variation of the UPC in cats to our knowledge have not been previously reported. However, the RCV for UPC in our study (82%) is very comparable to the RCV found in dogs (80%).16 Researchers concluded that the UPC must change by at least 80% in dogs with low UPC values (near 0.5), and by at least 35% in dogs with high UPC values (near 12) to be clinically relevant.16 Because the goal of our study was to determine biological variation of UPC in healthy cats, measured UPC values were mostly low with a median UPC of 0.16, and 96% cats had a UPC <0.4 on day 0. Therefore, we can only draw conclusions on the biological variation of UPC in cats with values in the lower ranges. Additional studies specifically including cats with CKD and overt renal proteinuria are needed to assess biological variation of UPC in diseased cats and in cats with higher UPC values.
Several studies have reported that hematuria only affects UPC in dogs when it is macroscopically visible32-34 or when the urinary sediment of cats or dogs contains ≥250 erythrocytes/hpf.35 However, because a statistically significant effect of microscopic hematuria on UPC was found, variable degrees of microscopic hematuria may have contributed to variation in UPC between visits, in addition to biological and analytical variation. Iatrogenic macroscopic and microscopic hematuria can be avoided by collecting urine at home. When home sampling of urine is chosen, however, it is advisable to apply this sampling method at all time points used to identify persistence of borderline or overt proteinuria to be able to reliably compare serial UPC results in the same cat.15 Because all urine samples for our current study were obtained by cystocentesis, caution is warranted when extrapolating biological variability data to voided urine.
For USG, only a decreased value (decreased urine concentrating ability) is clinically important because it is a potential early marker for CKD in the absence of nonrenal causes for polyuria and polydipsia. Unidirectional analysis resulted in a RCV of 36% for USG. Therefore, when USG decreases >36% on subsequent evaluations (eg, from 1.060 to <1.038) in a healthy cat, there is 95% probability that this decrease reflects a true decrease in concentrating ability by the kidneys and is not merely the consequence of physiological fluctuations around the homeostatic set point or analytical variation caused by laboratory imprecision. Changes in diet (especially from dry to wet food) can however additionally influence USG, and thus clinicians should take diet into account as well when interpreting serial USG results.27
Our study had some limitations. Although certain preanalytical (urine collection method, urine storage time and temperature) and analytical (laboratory choice) factors were kept constant throughout the study period, other preanalytical factors may have differed between sequential visits of the same cat and therefore could have played a role in the variation of UPC and especially USG values: (1) Cystocentesis was not always performed at exactly the same time in the same cat. However, sampling time did not affect USG in 2 previous studies in cats.27, 36 A potential explanation is the more nocturnal behavior of cats compared to dogs, so they might drink or eat during the night, leading to an early morning USG that is not different from that during the day.27 (2) Cats were fasted overnight before blood was drawn on day 0, but may have eaten at variable times before presentation for cystocentesis at the other time points. In 1 study in cats, however, feeding schedule did not influence USG.36 In another study, cats that were not fasted had higher USG than those that had food withheld before presentation, but an explanation for this observation could not be found.27 (3) Variation in water intake and diet are other factors that may have varied among visits. Although water intake should affect UP and UC equally, and therefore not affect their ratio (UPC), there is a potential effect on USG. Owners were asked not to change the type of diet and not to administer medication during the 2-month study period, but it cannot be completely excluded that these instructions were not followed in some cats. This possibility could in turn have influenced UPC or USG results, the latter especially if owners would have changed from dry to canned food or vice versa.27 (4) Lastly, the interval between weekly visits was not always exactly 7 days. However, studies in humans have shown that CVI increases as the sampling interval increases up to 4-5 days, but then remains stable for longer sampling intervals up to 2 weeks.2 The sampling interval for the weekly visits was always between 5 days and 2 weeks for cats in our study.
In conclusion, UPC was persistently ≥0.2 on 3 occasions during 2 months in 53% of cats with borderline proteinuria at baseline. Overt proteinuria was rare in healthy cats and not persistent when present. Suboptimal urine concentration was persistent in 38% cats with USG <1.035 at inclusion. Both UPC and USG had intermediate individuality, which means that population-based reference intervals should be interpreted with caution and RCVs applied to the individual cat's baseline value when possible. An increase in UPC of >82% in a healthy cat is clinically meaningful and not solely attributable to physiological and analytical variation. For USG, a decrease of >36% is considered clinically relevant in a healthy cat.
ACKNOWLEDGMENT
This study is part of a PhD project financed by the Bijzonder Onderzoeksfonds (BOF) of Ghent University. Laboratory analysis for this study was financially supported by IDEXX Laboratories Inc. The publication fee was supported by CEVA Santé Animale. The authors thank Dr. Randolph Baral for his advice regarding the statistical analysis of our data.
CONFLICT OF INTEREST DECLARATION
Authors declare no conflict of interest.
OFF-LABEL ANTIMICROBIAL DECLARATION
Authors declare no off-label use of antimicrobials.
INSTITUTIONAL ANIMAL CARE AND USE COMMITTEE (IACUC) OR OTHER APPROVAL DECLARATION
Approval granted by the Ethical Committee of the Faculty of Veterinary Medicine and the Faculty of Bioscience Engineering of Ghent University (IACUC) and the Deontological Committee of the Belgian Federal Agency for the Safety of the Food Chain (EC 2018/54).
HUMAN ETHICS APPROVAL DECLARATION
Authors declare human ethics approval was not needed for this study.