Reaction time in psychomotor vigilance task is related to hypoxic load in males with sleep apnea
Summary
Oxygen saturation (SpO2)-based parameters are more strongly linked to impaired daytime vigilance than the conventional diagnostic metrics in patients with obstructive sleep apnea (OSA). However, whether the association between SpO2-based parameters and impaired daytime vigilance is modulated by sex, remains unknown. Hence, we investigated the interplay between sex and detailed SpO2-based metrics and their association with impaired vigilance in patients with OSA. The study population consisted of 855 (473 males, 382 females) patients with suspected OSA who underwent overnight polysomnography and psychomotor vigilance task (PVT). The population was grouped by sex and divided into quartiles (Q1–Q4) based on median reaction times (RTs) in the PVT. In addition to conventional diagnostic metrics, desaturation severity (DesSev), fall severity (FallSev), and recovery severity (RecovSev) were compared between the sexes and between the best (Q1) and worst (Q4) performing quartiles by using cumulative distribution functions (CDFs). Additionally, sex-specific covariate-adjusted linear regression models were used to investigate the connection between the parameters and RTs. The CDFs showed significantly higher hypoxic load in Q4 in males compared to females. In addition, the DesSev (β = 8.05, p < 0.01), FallSev (β = 6.48, p = 0.02), RecovSev (β = 9.13, p < 0.01), and Oxygen Desaturation Index (β = 12.29, p < 0.01) were associated with increased RTs only in males. Conversely, the Arousal Index (β = 10.75–11.04, p < 0.01) was associated with impaired vigilance in females. The severity of intermittent hypoxaemia was strongly associated with longer RTs in males whereas the Arousal Index had the strongest association in females. Thus, the impact of hypoxic load on impaired vigilance seems to be stronger in males than females.
1 INTRODUCTION
Obstructive sleep apnea (OSA) is a nocturnal breathing disorder characterised by frequent episodes of upper airway collapses and obstructions during sleep. Nearly 1 billion adults worldwide are estimated to have OSA (Benjafield et al., 2019; Lyons et al., 2020) and the prevalence is twice as high in males than in females (Heinzer et al., 2015; Peppard et al., 2013). Furthermore, males have longer apnea and hypopnea events and more severe desaturation events compared to females (Leech et al., 1988; Vagiakis et al., 2006; Ware et al., 2000). Ultimately, OSA gradually leads to daytime sleepiness, decreased consciousness, cognitive dysfunction, impaired vigilance, impaired work performance, and the overall deterioration of the quality of life (Brookings et al., 1996; Ferini-Strambi et al., 1940; Mitler et al., 1988).
The impact of OSA on cognitive functioning encompasses different domains such as impaired vigilance, poor cognitive performance, and inability to sustain attention (Arnardottir et al., 2016; Batool-Anwar et al., 2014; Dinges & Powell, 1985). Such difficulties to retain attention or vigilance can be assessed with the psychomotor vigilance task (PVT), which is a fast and objective method used in assessing the subject's alertness related to sleep deprivation (Lee, 2010; Parasuraman et al., 1987). Currently, polysomnography (PSG) is used as the ‘gold standard’ method to assess the severity of OSA (Pandi-Perumal et al., 2014) from which the Apnea–Hypopnea Index (AHI) is calculated to estimate the severity of OSA by counting the number of respiratory events per hour of sleep (Berry et al., 2017). However, patients with similar AHI values can have significant differences in hypoxic load (Muraja-Murro et al., 2012, 2014) and sleep fragmentation as assessed e.g., by the Arousal Index (ArI). Thus, several studies have challenged the value of the conventional metric as a universal expression for OSA severity (Muraja-Murro et al., 2012; Pevernagie et al., 2020; Randerath et al., 2018). In contrast, recent studies have shown that detailed characterisation of the oxygen saturation (SpO2) signal can better describe the severity and consequences of OSA (Kainulainen et al., 2019; Kulkas et al., 2013a; Kulkas, Tiihonen, Julkunen, et al., 2013; Pahari et al., 2022). Additionally, desaturation severity has been shown to have a stronger association with PVT outcomes and daytime sleepiness than the AHI (Kainulainen et al., 2019, 2020; Pahari et al., 2022). Thus, a more detailed characterisation of OSA severity and SpO2 signal characteristics could be beneficial also to mitigate the neurobehavioural consequences of OSA.
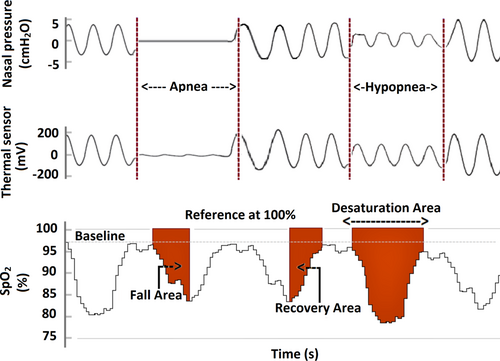
At present, there are no standard rules for scoring oxygen saturation events. Thus, several different methods are used to quantify the severity of intermittent hypoxaemia from SpO2 signals derived from a sleep study. One of the emerging ways to quantify the hypoxic load is to calculate the area under the oxygen saturation curve. Generally, the desaturation area is calculated from the onset of the desaturation to the end of the desaturation, i.e., the point where the SpO2 curve reaches the pre-event baseline. Similarly, the oxygen saturation fall, and recovery areas can be calculated by re-defining the start and end points (Figure 1). However, a detailed characterisation of desaturation events from a 100% saturation level and its impact on fall area and recovery area are not comprehensively studied in patients with OSA. In addition, the values of desaturation areas can be similar despite the completely different pre-event baseline values. This is the oxidative stress experienced by a patient is different if the pre-event baseline value of SpO2 is 98% compared to 85%. Therefore, to capture the variations in the baseline SpO2 values, it could be beneficial to calculate desaturation metrics using the 100% SpO2 level as a reference. To support this, we also observed in our recent study that the area between 100% reference and SpO2 curve better explains the consequences of OSA (Pahari et al., 2022). Additionally, a recent study introduced a novel hypoxic metric (respiratory event desaturation transient area) calculated from a 100% reference level of the SpO2 curve and showed that it predicted the cardiovascular consequences of OSA (de Chazal et al., 2021).
We hypothesise that a more detailed analysis of the oxygen desaturation events from a 100% reference level can improve the estimation of impaired daytime vigilance compared to the conventional PSG-based metrics in patients with OSA. Furthermore, it has not been previously studied in a sex-specific manner whether the characteristics of desaturation events differ between patients with impaired vigilance and unimpaired vigilance. Thus, we aimed to investigate how sex modulates the characteristics of oxygen desaturation events and their association with impaired daytime vigilance.
2 METHODS
2.1 Dataset
This retrospective study was based on 912 consecutive PVT and PSG measurement pairs, conducted at Sleep Disorders Centre, Princess Alexandra Hospital (Brisbane, Australia) during the years 2011–2017 for patients with suspected OSA. All PSGs were recorded with the Compumedics Grael acquisition system. Experienced sleep technologists manually scored the PSGs using Profusion PSG 4 software (Compumedics). An oxygen saturation signal was recorded using a transmissive Nonin Xpod 3011 (Minneapolis, USA) finger pulse oximeter. Oxygen desaturations were manually scored using the ≥3% drop criteria for hypopneas and used to calculate the Oxygen Desaturation Index (ODI) (Berry et al., 2017). SpO2 readings of <50% were considered unreliable, and thus removed from the analysis (Chan et al., 2013). The Human Research Ethics Committee of the Princess Alexandra Hospital approved the data collection and analysis (HREC/16/QPAH/021 and LNR/2019/QMS/54313).
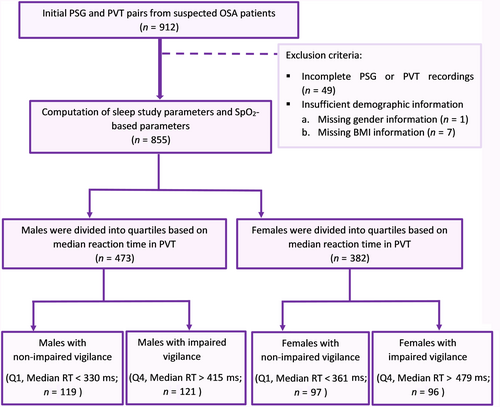
The PVTs were conducted with precisely 120 visual stimuli for each patient occurring at 2–10 s intervals to which the patients were instructed to respond as fast as possible by pressing the button. Reaction times (RTs) of <100 ms were considered false starts by the protocol and thus they were not included in the PVT time series. As the study included all 120 stimuli, therefore, the subjects’ RTs and potential false starts could slightly increase the total duration of the PVT. The average duration of the PVT was 16.6 min for all included patients. The minimum to the maximum range of PVT task time duration for all males was between 7.4 and 18.2 min and 14.9–19.3 min for all females. The standard outcomes, including median RT and the number of lapses were computed. Patients with incomplete PVT or PSG recordings (n = 49) and missing demographic information (n = seven) were excluded from the study (Figure 2). The remaining 855 patients were included in the analysis regardless of their AHI and grouped into males (n = 473) and females (n = 382) and studied separately. A detailed description of the study protocol is presented in Figures 2 and 3.
2.2 Parameters
The conventional PSG-based metrics, i.e., AHI, ArI, and ODI were calculated as the average number of apneas and hypopneas, arousals, and desaturation events per hour of sleep, respectively. In addition, we calculated several oxygen saturation-based parameters including average oxygen saturation (Avg. SpO2) and time spent below 90% oxygen saturation (T90) during sleep, desaturation duration, desaturation area, fall area, and recovery area. The desaturation area was computed from the onset of the desaturation to the offset of desaturation when the re-saturation level reached the pre-event baseline (Figure 1). The fall area was calculated from the onset of the desaturation to the lowest point of the desaturation (Figure 1). The recovery area was calculated from the lowest point of desaturation to the end of re-saturation where the saturation level reached the baseline (Figure 1). All areas were calculated by using the 100% SpO2 value as a reference. Finally, desaturation severity (DesSev), fall severity (FallSev), and recovery severity (RecovSev) parameters were calculated by summing the individual areas together and normalising them with total sleep time (TST).
2.3 Statistical analyses
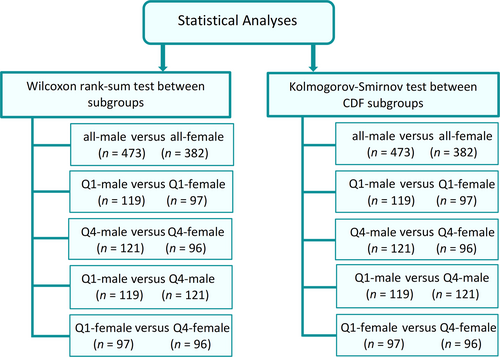
For statistical analyses, the included 473 males and 382 females were grouped into quartiles (Q1–Q4) based on median RT in the PVT (Figure 2). Currently, there are no standard clinical thresholds to define impaired vigilance from PVT outcomes. Therefore, we decided to divide the patients into quartiles. However, this artificial division hinders the comparison of Q2 and Q3 as it is uncertain whether these patients have impaired vigilance. Therefore, to ensure that we were certainly comparing patients with impaired vigilance to patients with unimpaired vigilance, only Q1 and Q4 were included for further analysis to investigate which parameters might explain impaired vigilance best. The statistical comparisons were performed both within and between the sexes and quartiles (Figure 3). Similarly, empirical cumulative distribution functions (CDFs) were used to compare parameter values between and within sexes and quartiles using the Kolmogorov–Smirnov test (Figure 3). A p value of 0.05 was selected as the threshold for statistical significance.
Unadjusted and adjusted linear regression models were used to investigate the association between SpO2 signal-based parameters and impaired daytime vigilance separately in all males and all females. In these models, the median RT was used as a continuous dependent variable. In the unadjusted models, the predictive parameters were modelled separately. In the adjusted models, the SpO2 signal-based parameters were the main predictive parameters while simultaneously controlling the traditional OSA diagnostic metrics; these models were adjusted with age, body mass index, TST, AHI, ArI, and history of atrial dysrhythmia and cardiac failure. The SpO2 signal-based and PSG-based parameters were normalised by the maximum value of each parameter to enable a feasible comparison between the parameters. The obtained regression coefficients (β values) were further scaled to correspond to a 10% change in the parameter values. Finally, as the median RT does not fully describe the impaired vigilance, we further performed similar analyses using the number of lapses (Figures S1 and S2). The number of lapses is not normally distributed, thus we considered lapses as a categorical dependent variable in regression models. All parametric calculations and statistical analyses were performed with MATLAB (R2022a, MathWorks).
3 RESULTS
The study population was middle-aged on average and consisted of 55.4% males, where about 90.7% of the included males had OSA (AHI ≥5 events/h) while only 77.5% of females had OSA. Consequently, males had higher AHI, ODI, and ArI compared to females (Table 1). In addition, DesSev, FallSev, and RecovSev were significantly higher in males compared to females, while the median RTs were longer in females (Table 1). Similar findings were observed between males and females in Q1 and Q4, males had a higher hypoxic load compared to females (Table 1 and Figure 4).
| Male | Female | |||||||
|---|---|---|---|---|---|---|---|---|
| Variable | All | Q1 (RT < 330 ms) | Q4 (RT > 415 ms) | p | All | Q1 (RT < 361 ms) | Q4 (RT > 479 ms) | p |
| Subjects, n (%)a | 473* | 119 (72.9) | 121 (88.3) | – | 382 | 97 (82.3) | 96 (94.9) | – |
| SubjectsAHI >5 events/h, n (%)b | 429 (90.7) | 108 (90.8) | 112 (92.6) | – | 296 (77.5) | 69 (71.1) | 75 (78.1) | – |
| Age, years, median (IQR) | 57.3* (45.4–67.2) |
52.9 (40.5–64.8) |
58.6 (48.8–68.9) |
<0.01 | 54.1 (43.8–63.8) |
50.7 (43.8–63.9) |
57.5 (47.4–66.3) |
0.01 |
| BMI, kg/m2, median (IQR) | 33.1* (28.7–38.7) |
32.4* (28.7–38.7) |
33.1 (28.7–38.7) |
<0.01 | 36.2 (30.5–43.1) |
36.5 (31.7–44.3) |
34.4 (29.1–41.4) |
0.05 |
| TST, h, median (IQR) | 4.8* (4.1–5.8) |
4.9 (3.9–5.8) |
4.6* (3.7–5.7) |
0.13 | 5.3 (4.4–6.1) |
5.4 (4.5–6.0) |
5.3 (4.3–6.1) |
0.97 |
| Avg. PVT task duration, min, median (IQR) | 16.5* (16.1–16.9) |
16.3* (16.0–16.6) |
16.9* (16.4–17.4) |
<0.01 | 16.7 (16.3–17.2) |
16.5 (16.1–16.8) |
17.3 (16.9–17.9) |
<0.01 |
| Mean 1/RT, 1/ms, median (IQR) | 2.7* (2.4–3.0) |
3.1* (3.0–3.3) |
2.0* (1.7–2.3) |
<0.01 | 2.4 (2.0–2.7) |
2.9 (2.8–3.1) |
1.7 (1.4–1.9) |
<0.01 |
| Median RT, ms, median (IQR) | 362.0* (330.0–415.3) |
312.5* (301.0–322.0) |
478.0* (434.5–570.5) |
<0.01 | 406.0 (361.0–479.8) |
336.0 (321.0–349.3) |
560.0 (517.0–690.5) |
<0.01 |
| Lapses, n, median (IQR) | 10* (4–24) |
3* (1–5) |
50* (33–78) |
<0.01 | 20 (8–51) |
4 (3–8) |
78 (64–102) |
<0.01 |
| AHI, events/h, median (IQR) | 25.3* (11.9–48.4) |
24.3* (12.0–43.4) |
28.8* (13.4–56.9) |
0.19 | 13.5 (5.5–26.7) |
12.5 (4.4–26.7) |
12.7 (5.7–26.7) |
0.78 |
| ArI, events/h, median (IQR) | 31.5* (21.1–48.9) |
31.9* (22.0–46.2) |
31.7* (21.4–53.4) |
0.92 | 22.3 (15.2–32.7) |
21.3 (14.4–29.1) |
24.1 (15.2–31.8) |
0.39 |
| ODI, events/h, median (IQR) | 15.8* (5.1–32.9) |
13.5* (4.9–28.5) |
19.8* (8.8–41.3) |
0.06 | 7.7 (2.6–20.8) |
6.9 (2.5–21.3) |
9.5 (3.0–20.9) |
0.50 |
| Avg. SpO2, %, median (IQR) | 93.4 (90.7–95.3) |
94.2 (91.8–95.5) |
92.9 (89.9–94.9) |
<0.01 | 92.8 (90.1–95.28) |
93.2 (89.8–95.18) |
92.3 (89.9–95.07) |
0.57 |
| T90, s, median (IQR) | 495.6* (52.1–2949.1) |
339.5 (48.8–1877.9) |
766.7 (78.8–4258.3) |
0.03 | 178.8 (19.2–1990.9) |
143.75 (14.9–633.1) |
302.1 (34.2–3046.1) |
0.09 |
| DesSev, %, median (IQR) | 1.05* (0.31–2.90) |
0.89* (0.31–2.92) |
1.25* (0.46–3.61) |
0.04 | 0.52 (0.11–1.61) |
0.41 (0.12–1.57) |
0.72 (0.12–1.79) |
0.07 |
| FallSev, %, median (IQR) | 0.68* (0.18–1.82) |
0.58* (0.18–1.49) |
0.78* (0.29–2.23) |
0.04 | 0.30 (0.07–0.99) |
0.24 (0.07–1.01) |
0.43 (0.07–1.16) |
0.06 |
| RecovSev, %, median (IQR) | 0.39* (0.11–1.01) |
0.31* (0.11–0.88) |
0.44* (0.16–1.26) |
0.02 | 0.20 (0.04–0.58) |
0.15 (0.05–0.53) |
0.25 (0.05–0.64) |
0.07 |
| DesDur, s, median (IQR) | 14.89* [4.9–31.4) |
13.43* [4.7–29.5) |
18.25* [6.9–39.3) |
0.04 | 7.40 [2.0–18.1) |
6.0 [2.0–18.1) |
8.2 [2.2–18.6) |
0.44 |
- Abbreviations: AHI, Apnea–Hypopnea Index; ArI, Arousal Index; Avg. PVT task duration, average task time duration in PVT; Avg. SpO2, average blood oxygen saturation during sleep; BMI, body mass index; DesDur, desaturation duration; DesSev, desaturation severity from 100% reference; FallSev, fall severity from 100% reference; IQR, interquartile range; Lapses, number of reaction times >500 ms in PVT; Mean 1/RT, mean reciprocal reaction time; Median RT, median reaction time in PVT; ODI, Oxygen Desaturation Index; PVT, psychomotor vigilance task; RecovSev, recovery severity from 100% reference; T90, time below 90% oxygen saturation level during sleep; TST, total sleep time.
- a Percentage of the identical population belonged to the same quartiles when quartiles are formed based on lapses or median RT.
- b Percentage of the total population and quartiles with OSA based on AHI.
- * Statistically significant (p < 0.05) difference between males and females; p = difference between Q1 and Q4; the statistical comparisons were investigated with Wilcoxon rank-sum test and between subjects by chi-square test. Bold values statistically significant at p < 0.05.
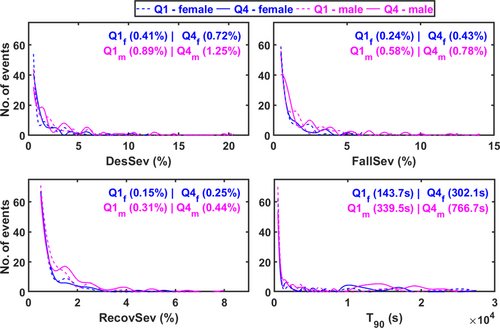
Male patients belonging to Q4 had significantly higher T90, DesSev, FallSev, and RecovSev and lower Avg. SpO2 compared to male patients in Q1 (Table 1 and Figure 4). In females, the severity of hypoxaemia showed a trend towards being higher in Q4 compared to Q1; however, the statistical significance of differences was borderline in many cases (Table 1 and Figure 4).
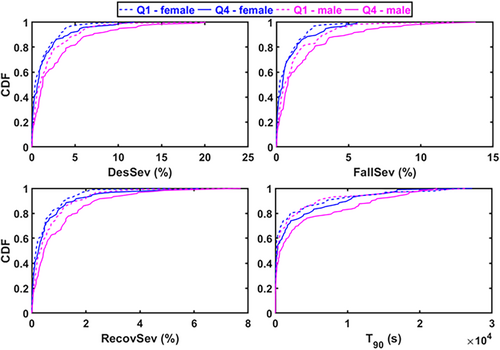
Based on CDFs, the DesSev, FallSev, RecovSev, and T90 were shifted towards higher values in Q4 compared to the Q1 in both males and females (Figure 5). Furthermore, T90, DesSev, FallSev, and RecovSev were significantly higher in Q4 males compared to the Q4 females and in Q1 males compared to the Q1 females, indicating again a higher hypoxic load in males (Figure 5).
In males, regression analyses revealed that higher ODI, T90, DesSev, FallSev, and RecovSev were associated with longer median RTs in the unadjusted models (Table 2) and this finding remained the same in the adjusted models (Table 3). The 10% increase in RecovSev elevated the median RT by 5.2 ms in the unadjusted model and by 9.1 ms in the adjusted model (Table 2 and Table 3). Additionally, the median RT increased by 12.3 ms in the adjusted model when the ODI increased by 10% (Table 3). In males, atrial dysrhythmia was the only statistically significant covariate (Table 3).
| Unadjusted model | ||||
|---|---|---|---|---|
| Male | Female | |||
| Parameter | Beta (95% CI) | p | Beta (95% CI) | p |
| AHI (events/h) | 1.14 (−0.84, 3.12) | 0.25 | 4.67 (1.69, 7.64) | <0.01 |
| ArI (events/h) | 0.70 (−1.44, 2.84) | 0.52 | 8.30 (5.94, 10.66) | <0.01 |
| ODI (events/h) | 3.41 (0.66, 6.15) | 0.01 | 2.38 (−0.49, 5.25) | 0.10 |
| Avg. SpO2 (%) | −12.46 (−26.63, 1.72) | 0.08 | −4.94 (−15.48, 5.60) | 0.35 |
| T90 (s) | 5.95 (3.51, 8.38) | <0.01 | 1.62 (−1.04, 4.28) | 0.23 |
| DesSev (%) | 4.53 (0.98, 8.07) | 0.01 | 1.63 (−1.22, 4.48) | 0.26 |
| FallSev (%) | 3.92 (0.33, 7.50) | 0.03 | 1.83 (−0.63, 4.28) | 0.14 |
| RecovSev (%) | 5.24 (1.37, 9.10) | <0.01 | 1.58 (−1.76, 4.90) | 0.35 |
- Note: Bold values statistically significant at p < 0.05.
- Abbreviations: 95% CI, 95% confidence interval for beta values; AHI, Apnea–Hypopnea Index; ArI, Arousal Index; Avg. SpO2, average blood oxygen saturation during sleep; DesSev, desaturation severity from 100% reference; FallSev: fall severity from 100% reference; ODI, oxygen desaturation index; RecovSev, recovery severity from 100% reference; T90, time below 90% oxygen saturation level during sleep.
| Adjusted model | ||||
|---|---|---|---|---|
| Male | Female | |||
| Parameter | Beta (95% CI) | p | Beta (95% CI) | p |
| ODI, (events/h) | 12.29 (5.45, 19.12) | <0.01 |
−2.01 (−7.37, 3.34) | 0.45 |
| Avg. SpO2 (%) | −10.71 (−28.01, 6.59) | 0.22 |
−5.81 (−16.70, 5.09) | 0.29 |
| T90 (s) | 7.63 (4.68, 10.59) | <0.01 |
0.16 (−2.39, 2.71) | 0.88 |
| DesSev (%) | 8.05 (2.36, 13.74) | <0.01 |
−2.82 (−6.88, 1.23) | 0.17 |
| FallSev (%) | 6.48 (0.65, 12.30) | 0.02 |
−1.87 (−5.39, 1.65) | 0.29 |
| RecovSev (%) | 9.13 (3.14, 15.12) | <0.01 | −3.17 (−7.61, 1.28) | 0.16 |
| Adjusting covariates | ||||
| AHI (events/h) | −1.31 to 0.25 (−6.37, 4.54) |
0.41–0.82 | −3.97 to −1.79 (−8.15, 3.53) |
0.05–0.54 |
| ArI (events/h) | −1.98 to −1.65 (−6.52, 3.01) |
0.38–0.48 | 10.75–11.04 (7.37, 14.41) |
<0.01 |
| Age (year) | 2.56–2.69 (−1.92, 7.18) |
0.23–0.26 | 3.76–4.12 (0.39, 7.43) |
0.01–0.02 |
| BMI (kg/ m2) | −1.51 to −0.32 (−9.36, 7.58) |
0.70–0.93 | 0.26–0.68 (−4.04, 4.97) |
0.75–0.88 |
| TST (h) | −26.33 to −18.59 (−74.79, 28.88) |
0.28–0.44 | 49.01–51.52 (13.29, 87.23) |
<0.01 |
| Atrial dysrhythmia | 163.09–169.09 (−3.25, 337.75) |
0.02–0.04 | −50.08 to −36.26 (−250.52, 163.96) |
0.60–0.71 |
| Cardiac failure | −287.56 to −253.11 (−643.85, 109.62) |
0.11–0.17 | 60.09–68.21 (−231.65, 361.08) |
0.64–0.68 |
- Note: The interquartile range of 95% CI is presented for adjusted covariates. Bold values statistically significant at p < 0.05.
- Abbreviations: CI, confidence interval for beta values; AHI, Apnea–Hypopnea Index; ArI, Arousal Index; Avg. SpO2, average blood oxygen saturation during sleep; BMI, body mass index; DesSev, desaturation severity from 100% reference; FallSev, fall severity from 100% reference; ODI, Oxygen Desaturation Index; RecovSev, recovery severity from 100% reference; T90, time below 90% oxygen saturation level during sleep; TST, total sleep time.
In females, the AHI and ArI were significantly associated with increased median RTs in the unadjusted models (Table 2) and only the ArI remained significant when the model was adjusted for covariates (Table 3). TST and age were statistically significant covariates in the adjusted model (Table 3).
Similarly, we observed a higher hypoxic load in males with impaired vigilance compared to females with impaired vigilance when the evaluations were done between quartiles formed based on the number of lapses in the PVT (see Appendix S1). We observed that mostly the same population belonged to the same quartiles regardless of the used PVT metric i.e., median RT or PVT lapses (Table 1).
4 DISCUSSION
In this study, we investigated how sex modulates the association between PSG-based parameters and impaired vigilance, and detailed SpO2 signal-based parameters and impaired vigilance. The severity of hypoxic load defined by DesSev, FallSev, and RecovSev was significantly higher in males compared to females, either with or without impaired vigilance. We found that the severity of SpO2-based parameters was associated with longer median RTs in males whereas the ArI showed a strong association with impaired vigilance in females. The hypoxic load had a significant impact on daytime vigilance in males, although the severity of hypoxic load was also higher in females with impaired vigilance compared to females with unimpaired vigilance. However, in females, the statistical significance of the association between the severity of intermittent hypoxaemia and impaired vigilance was not quite reached.
The result of this study revealed the OSA severity as measured by the AHI, is not significantly different between patients with unimpaired and impaired vigilance (Table 1). Previous studies have also demonstrated that the AHI has a poor correlation with PVT outcomes while the severity of hypoxaemia is correlated with worse PVT performance (Batool-Anwar et al., 2014; Kainulainen et al., 2019, 2020; Lee, 2010; Pahari et al., 2022). Similarly, we observed that hypoxia time (T90) and the increased severity of hypoxaemia were associated with impaired daytime vigilance (Figures 4 and 5). These findings reflect the importance of additional clinical metrics of OSA severity better associated with symptomatology. Therefore, considering hypoxaemia-related parameters in the diagnosis of OSA might enable a more representative estimation of OSA severity beyond conventional metrics (Batool-Anwar et al., 2014; Pahari et al., 2022; Randerath et al., 2018).
The results from the regression models also supported the significant association between the severity of intermittent hypoxaemia and increased median RTs in males even after relevant covariates were taken into account (Table 3). In addition, the Q4 group contained mostly the same patients regardless of whether the grouping was done based on the number of lapses or the median RT. It is also known that OSA-induced impaired daytime vigilance is strongly associated with cognitive dysfunction and is a potential risk factor in traffic accidents; however, it is not clear which patients with OSA are at the highest risk (Barbe et al., 1998; Pichel et al., 2006; Vakulin et al., 2012). As treatment of OSA significantly reduces the risk of traffic accidents (Cassel et al., 1996), these findings highlight the importance of considering SpO2-based metrics in clinical decision-making in order to recognise patients with OSA with impaired vigilance (Kainulainen et al., 2020; Pahari et al., 2022). That is, considering the SpO2 signal features with more detail can enhance the assessment of OSA severity and related symptoms, and provide a basis for whom treatment should be targeted.
Based on the sex-stratified analysis, males had significantly higher AHI, ODI, and ArI compared to females and these findings are in line with the previous studies (Leech et al., 1988; Vagiakis et al., 2006; Ware et al., 2000). Furthermore, the severity of intermittent hypoxaemia was also significantly higher in males than in females (Table 1). These findings are consistent with previous studies, showing that males have longer desaturations, larger desaturation areas, deeper fall areas, and longer recovery periods compared to females (Leppänen et al., 2017; Ware et al., 2000). In addition, it has been demonstrated that males have higher upper airway resistance during sleep than females due to increased neck circumference and pharyngeal airway dimension (Rowley et al., 2002). The structure and physiological behaviour of the upper airway are also different between sexes and obstructions of the pharyngeal airway can occur more frequently during sleep in males than in females (Mohsenin, 2001). These factors might explain the substantially reduced respiratory response and more severe hypoxaemia in males.
In this study, we observed that although males had more arousals on average; the ArI was associated with impaired daytime vigilance only in females. Previously, it has been reported that upper airway opening can occur with or without arousal at any obstruction severity level (Younes, 2004) and males have a slower ventilatory response (i.e., shallow breathing after arousal) compared to females (Jordan et al., 2003). Therefore, a combination of more collapsible upper airways due to decreased upper airway muscle activation before arousal, and hypoventilation that creates shallow breathing leading to a low oxygen saturation level after arousal; might explain a relatively higher hypoxic load in males than females. Also, in line with a previous study, we found that females had longer RTs and more lapses compared to males (Rowley et al., 2002; Tanno et al., 2017). Thus, sex is a factor that definitely should be considered when evaluating the factors contributing to OSA-related impaired vigilance.
We acknowledge that the present study has certain limitations. First, this study did not include a comparison study only to the healthy controls, i.e., participants without suspected OSA. However, the objective of this study was to investigate the differences in PVT performance between patients with OSA and factors explaining impaired daytime vigilance to determine which parameters best estimate OSA-related impaired vigilance. Second, we chose to solely use median RT as the analysed metric and acknowledge that it is unable to fully capture the vigilance. However, the groups with impaired vigilance and unimpaired vigilance are largely the same regardless of the used PVT metric (Table 1) and this same limitation would also exist with any other PVT metric. In addition, to further mitigate this, we further performed the analyses using the number of lapses (Appendix S1). Third, the PVTs were conducted in the evening before PSGs. While this captures the overall vigilance level after sleeping at home the previous night, the PVTs would better represent sleep quality measured in PSG if conducted also after it. A recent study also reported that the severity of individual obstruction events increases towards the morning (Nikkonen et al., 2020). Therefore, conducting PVTs both before and after PSGs would have been optimal and could have added further details to the study. Fourth, although the studied population was large, when patients were divided into quartiles, the number of patients within the sex-stratified analysis was relatively low. This could be one reason why the severity of intermittent hypoxaemia between Q1 and Q4 did not reach statistical significance in females, albeit also explained by the smaller severity range than for males. Moreover, the observation that the proportion of patients with an AHI of >5 events/h was considerably larger in both male Q1 and Q4 compared to female Q1 and Q4 (Table 1) is likely to have an effect. Lastly, we had limited information related to patients sleeping habits, caffeine or alcohol consumption, drug intake, or medication history, which could have added some uncertainties.
5 CONCLUSIONS
In this study, the severity of intermittent hypoxaemia was found to be associated with impaired daytime vigilance in males whereas the severity of sleep fragmentation had the strongest association with impaired daytime vigilance in females. These findings implicate that more sophisticated oxygen saturation signal-based parameters could bring additional information to the assessment of OSA-related impaired daytime vigilance, especially in males. Also, the results highlight sex-specific physiological traits that explain OSA-related impaired vigilance.
AUTHOR CONTRIBUTIONS
Purbanka Pahari contributed to the study design, data analysis, interpretation of the results, and wrote the first draft of the manuscript. Henri Korkalainen contributed to the study design, selection of data analysis methods, and writing of the manuscript. Tuomas Karhu contributed to the data interpretation and writing of the manuscript. Erna Sif Arnardottir contributed to the study design and writing of the manuscript. Juha Töyräs contributed to the study design and writing of the manuscript. Timo Leppänen and Sami Nikkonen contributed to the study design, selection of data analysis methods, data interpretation, and writing of the manuscript. All authors have reviewed the manuscript critically and accepted the latest version to be submitted.
ACKNOWLEDGEMENTS
The authors are grateful to Brett Duce (Princess Alexandra Hospital and the Queensland University of Technology, Brisbane, Australia) for providing the PSG-PVT data for our analyses.
FUNDING INFORMATION
This work was funded by the European Union's Horizon 2020 Research and Innovation Programme (grant 965417), the Academy of Finland (project 323536), NordForsk (NordSleep project 90458) via Business Finland (5133/31/2018) and the Icelandic Research Fund, the Research Committee of the Kuopio University Hospital Catchment Area for the State Research Funding (projects 5041767, 5041794, 5041805, 5041787, and 5041803), the Research Foundation of the Pulmonary Diseases, Finnish Anti-Tuberculosis Association, Tampere Tuberculosis Foundation, Instrumentarium Science Foundation, Orion Research Foundation, Respiratory Foundation of Kuopio Region, and Respiratory Diseases Research Foundation.
CONFLICT OF INTEREST STATEMENT
Purbanka Pahari, Henri Korkalainen, Tuomas Karhu, Timo Leppänen, and Sami Nikkonen disclose State Research Funding from the Research Committee of the Kuopio University Hospital Catchment Area for the State Research Funding Research Committee of the Kuopio University Hospital Catchment Area for the State Research Funding (projects 5041803, 5041805, 5041787, 5041794, 5041767, 5041768, and 5041809). Purbanka Pahari, Erna Sif Arnardottir, Juha Töyräs, and Timo Leppänen disclose research funding from NordForsk (NordSleep project 90458). Purbanka Pahari also discloses personal grants from the Respiratory Diseases Research Foundation, the Respiratory Foundation of Kuopio Region, and the Orion Research Foundation. Henri Korkalainen discloses funding from the Finnish Anti-Tuberculosis Association, the Finnish Cultural Foundation, and the Scientific Foundation of Respiratory Diseases. Henri Korkalainen also discloses working contrasts at the Diagnostic Imaging Centre, Kuopio University Hospital; Cancer Centre, Kuopio University Hospital; and the Department of Technical Physics, University of Eastern Finland. Additionally, Henri Korkalainen discloses his leading work package in Sleep Revolution, European Union's Horizon 2020 Research and Innovation Programme under grant agreement number 965417. Tuomas Karhu discloses personal grants from Tampere Tuberculosis Foundation, and Instrumentarium Science Foundation. Erna Sif Arnardottir discloses lecture fees from Nox Medical, Philips, ResMed, Jazz Pharmaceuticals, Linde Healthcare, Alcoa Fjardaral, and Wink Sleep. Erna Sif Arnardottir is also a member of the Philips Sleep Medicine and Innovation Medical Advisory Board. Juha Töyräs and Timo Leppänen disclose project funding from National Health and Medical Research Council (NHMRC), Australia, and European Commission, H2020-SC1-2020. Timo Leppänen additionally discloses project funding from the Academy of Finland (project 323536).
Open Research
DATA AVAILABILITY STATEMENT
The data includes medical records and personal information. Therefore the data can only be shared within the confinements of the Australian legislation and ethical conventions. Reasonable requests considering data sharing will be individually assessed.


