Program Quality Competition in Broadcasting Markets
We thank Myrna Wooders (editor), one associate editor and two anonymous referees for their valuable comments. We would like to thank Hong Feng, Qiang Gong, Jianpei Li, Jie Li, Ping Lin, Zhiyong Liu, Jie Ma, Lan Zhang, and seminar participants at UIBE, SWUFE, Jinan University, and Yantai University for their valuable comments. Changying Li gratefully acknowledges the financial support from the National Social Science Foundation (14AJL008) and the Shandong Science Foundation (ZR2012GM017). Jianhu Zhang acknowledges the financial support from CPSF (2012T50599) and the Foundation for Outstanding Young Scientist of Shandong Province (BS2014SF014).
Abstract
This paper develops a duopoly model where broadcasters first choose their program quality and then their pricing strategy. Two alternative financing schemes are considered: pay-TV and free-to-air. We find that, from a welfare perspective, a pay-TV regime always generates inadequate quality and advertising, whereas free-to-air might produce excessive quality and advertising. In the case of asymmetric competition, a pay-TV broadcaster always has a stronger incentive to conduct research and development than a free-to-air broadcaster does. Both platforms could either over- or underinvest. The pay-TV broadcaster always shows too few advertisements, but the free-to-air media might act in the opposite manner.
1. Introduction
In broadcasting markets, a central question is whether or not the market provides adequate quality programs, from a welfare perspective. This question is important and interesting on both theoretical and policy grounds. On one hand, it is frequently observed that broadcasters spend considerable effort to improve the quality of their programs. On the other hand, in many—especially European—countries, it is argued that private stations might have incentives to offer inadequate quality programs, thereby providing a basis for public intervention in the broadcasting industry (Armstrong and Weeds 2007).
This paper develops a duopoly model of broadcast competition with an emphasis on quality investment. In particular, we analyze two alternative schemes in which broadcasters are financed: the pay-TV regime under which broadcasters are financed both from advertising receipts and customers’ subscriptions, and the free-to-air regime under which broadcasters are financed from advertising receipts only. The purpose of this paper is to address the nature of the market failure with respect to the provision of quality programming. This is particularly important in light of the general trend towards deregulation in the broadcasting industry around the world (Choi 2006).
Several investigators before us have analyzed some aspects of quality competition in broadcasting markets. Armstrong and Weeds (2007) compare program qualities under pay-TV and free-to-air. They show that program quality is higher under pay-TV than under free-to-air. However, by assuming that broadcasters simultaneously choose their research and development (R&D), advertisements and prices, they consequently neglect the effect of quality investment on the levels of price and advertising. González-Maestre and Martínez-Sánchez (2015) analyze quality improvement via competing platforms. But they discuss free-to-air only, with an emphasis on comparison between private and mixed duopoly outcomes. The applicability of that analysis is limited, however, by the assumption that advertising revenue functions are linear and R&D functions are quadratic.
The current paper assumes that platforms first choose their R&D efforts and then their pricing strategies. This assumption allows us to explicitly investigate how quality improvement affects advertising (and subscription price under pay-TV). The focus of this paper is the divergence between socially and privately optimal levels of quality and advertising. We find that, from a welfare perspective, a pay-TV regime always leads to lower levels of program quality and advertising, whereas free-to-air might produce the opposite results. Our result implies that program quality might be lower under pay-TV than under free-to-air, which differs from the finding by Armstrong and Weeds (2007).
The logic underlying our results is as follows. As we show below, a pay-TV regime generates a full pass-through of advertising revenues into lower prices. An immediate consequence is that the amount of advertising is undersupplied relative to a social optimum. The pass-through effect also induces broadcasters to offer lower levels of program quality. By contrast, depending on the strategic response between advertisers and viewers, a free-to-air regime might lead to the social under- or overprovision of advertising. Regarding the determinants of quality investment, there are two opposing forces. On one hand, an increase in R&D by a platform makes its program more attractive. This is an encouraging force. On the other hand, an increase in R&D by a platform will force its competitor to cut the level of advertising, which in turn hurts the investor since its program becomes less attractive. This is a discouraging force. Therefore, in the free-to-air market, the levels of R&D could be distorted either upwards or downwards, from a welfare perspective.
Our analysis obviously falls into the category of studies on a two-sided market. In the media market literature without quality investment, Anderson and Coate (2005) present a theory on the market provision of broadcasting, given the level of content differentiation. They show that, from a welfare perspective, the market provision of advertising may be too large or too small. Some other papers focus on platforms’ endogenous content and advertising decisions (e.g., Gabszewicz, Laussel, and Sonnac 2001, 2002, 2004; Gal-Or and Dukes 2003; Peitz and Valletti 2008).1
The rest of the paper is organized as follows. Section 2. outlines the basic model and derives the socially optimal outcome. Section 3. explores the dependence of quality investment on financing schemes. Particularly, we analyze three cases: first, both platforms are pay-TV stations; second, both are free-to-air stations; and finally, one is a pay-TV broadcaster, and the other is a free-to-air broadcaster. Section 4. extends our analysis by allowing for elastic demand, and further discusses the possible regulation of the broadcasting markets. The final section concludes this paper.
2. The Model and Social Optimum
 , to improve the quality of its program, where
  is the degree of innovation. The cost of delivering programs to viewers is normalized to zero. The following assumption is used to ensure the existence and uniqueness of the equilibrium investment:

 is viewers’ disutility from consuming programming content that does not fit their taste.3
 when he/she watches a type i program,4
  is the location of program i,
  . Our assumption on program locations implies that
  and
and  . Viewers are assumed to be annoyed when programs are interrupted by advertising messages. The corresponding utility loss is
  if the number of advertisements is
  ,5,6 where
  is a nuisance parameter that measures the extent to which viewers dislike the interruptions caused by commercials.7 A viewer has to pay a fee
  under pay-TV. The utility of a viewer of type x from watching program i then is
 (1)
(1) is the reservation utility obtained by any viewer who watches any of the two programs. Assume that
  is sufficiently high so that the market is fully covered. For a viewer with a taste parameter
 (2)
(2) (3)
(3)As in Anderson and Coate (2005), Choi (2006), and Crampes, Haritchabalet, and Jullien (2009), we define  as the inverse demand for channel i's per-viewer advertising with
  and
and  ,
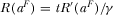
, . Accordingly,
  is channel i's per-viewer advertising revenue. The advertisers’ surplus from per-viewer advertising is given by
  . The following assumption is used to ensure the existence of a unique level of advertising.


The first two statements under Assumption 2 imply that marginal revenue of advertising is very large (small) if the level of advertising is very low (high). The third statement under Assumption 2 guarantees that the second-order conditions are satisfied, and it implies that marginal revenue of advertising is strictly decreasing in the amount of advertising.
We distinguish between two financing regimes, pay-TV and free-to-air. In the pay-TV regime, viewers are charged a pay-per-view price,  . Following Peitz and Valletti (2008), we allow for the subsidization of viewers, i.e.,
  .9 In the free-to-air regime, a program is offered for free to viewers.
 (4)
(4) (5)
(5) (6)
(6) (7)
(7)
Observe that the property of  implies that
  is uniquely determined. The uniqueness of
  follows directly from Assumption 1.
PROPOSITION 1.The socially optimal level of advertising is  and the R&D effort is
  .
.
The optimal levels of R&D effort and advertising are determined by disjoint sets of considerations. More specifically, the optimal level of R&D investment is determined by the viewer surplus gain with respect to content and the increase in programming costs, whereas the optimal level of advertising is determined by advertiser benefit reflected in the inverse demand function  and viewer disutility cost of advertising γ.
3. Market Equilibrium
3.1. Pay-TV
In the pay-TV regime, both broadcasters are financed through both subscription fee and advertising revenue. The following three-stage game is considered. In the first stage, the broadcasters simultaneously choose how much to invest in improving their program quality. In the second stage, they decide their advertising space  and choose their viewing price
  ,
,  . In the third stage, advertisers and viewers choose their channels.
 (8)
(8) and
and  are, respectively, given by 11
 (9)
(9) (10)
(10) (11)
(11) (12)
(12)Equation 11 implies that both the levels of advertising and subscription prices are strategic complements, i.e., an advertising (subscription price) increment by one broadcaster will invoke an advertisement (subscription price)-increasing response by its competitor. Equation 11 also implies that one broadcaster's amount of advertising and the other broadcaster's subscription price are strategic complements. This suggests that an increase in channel i's amount of advertising causes viewers to switch off, which allows channel j to charge a higher subscription price,  ,
,  . Equation 12 indicates that, with an increase in advertising intensity, a platform will optimally reduce the subscription price of its program, in order to attract viewers.

This result follows from the assumption that advertisers are multihoming.13 The equation above shows how advertising space  reacts to viewer nuisance cost. As a result, a platform's advertising space solely depends on viewer nuisance cost of advertisement, not on its content, subscription fee nor its competitor's decision.

The right-hand side of the expression consists of three terms. The first term reflects the degree to which the programs are substitutes. A greater t implies a lower substitutability, which allows for a higher subscription price. The second term captures the viewer's utility from the platforms’ R&D. A higher investment by a platform makes its program more attractive to viewers, and thus allows it to charge a higher subscription price. Conversely, a higher R&D by the competitor makes this platform's program less attractive, and consequently reduces its subscription fee. The third term illustrates the impact of per-viewer advertising revenue on the pricing ability of a platform. In other words, if a platform generates more revenues from advertising, it can attract more viewers by means of lower prices via a subsidy. An immediate implication of 14 is that all advertising revenues  are passed on to viewers, which implies that advertising revenues do not affect the equilibrium profits of the two platforms (noted as “profit neutrality” in Peitz and Valletti 2008).
 (15)
(15)It is obvious that the platforms’ profits depend on both the intensity of the competition and the levels of R&D efforts, but are independent of the levels of advertising. This is an immediate consequence of the full pass-through of advertising revenues into lower subscription prices.
 (16)
(16) (17)
(17)The above analysis can be summarized by the following proposition.
PROPOSITION 2.In the pay-TV regime, equilibrium outcome is characterized by  ,
,  and
and  .
.
It is interesting to see that equilibrium quality investment is independent of both the nuisance parameter and the amount of advertising. This arises from the full pass-through effect. It is worth mentioning that the sign of  is ambiguous. That is, equilibrium prices could be either positive or negative, depending on the intensity of competition (t) and the advertising revenue per viewer (
 ).
).
3.2. Free-to-Air
In the free-to-air regime, programs are provided for free to viewers, and thus platforms earn revenues solely from the advertising market. The timing of the game is consequently modified because, in the first stage, both broadcasters simultaneously choose their R&D. In the second stage, they decide their advertising space  ,
,  . In the final stage, advertisers and viewers choose their platforms.
 (18)
(18) leads to
 , which implies that the platforms’ levels of advertising are strategic complements. In other words, an increase in the level of advertising by one platform will force the viewers to switch off, which in turn allows the competing platform to place a high amount of advertising. Rewriting the first-order conditions, one obtains
 (20)
(20) (21)
(21) .16
.16
LEMMA 1.In the free-to-air regime, a platform's advertising intensity increases in its own R&D effort but decreases in its rival's R&D effort. That is,  and
and  ,
,  ,
,  .
.
Proof.See Appendix B.
The intuition is very straightforward and is omitted. An immediate implication is that a higher R&D effort by platform i will lead to asymmetry between platforms; the equilibrium advertising reaction is for platform i to act more aggressively and the competing platform to act less aggressively.
 and
and  are functions of
  and
and  ,
, 
 (23)
(23) (24)
(24) (25)
(25) (26)
(26)PROPOSITION 3.In the free-to-air regime, there exists a unique equilibrium where the level of advertising is determined by 21 and the R&D effort  is determined by
 (27)
(27)Proof.See Appendix C.
In contrast to pay-TV, equilibrium investment in the free-to-air regime depends on three factors: the intensity of the competition, the nuisance parameter and the inverse advertising-demand function. This is because in the free-to-air market, R&D effort is, as explained earlier, affected by both direct and indirect effects, which differs from the pay-TV market.
Example. Suppose  , where
  represents the market size and
  reflects the elasticity of inverse demand.18 It is easy to verify that
  .
.
COROLLARY 1.In the free-to-air regime, if  ,19 then
  and
and  , where
  ,
, and
and  .
.
Proof.See Appendix D.
In order to explain the intuition underlying this result, we need to emphasize the two effects generated by the R&D investment (see 25 and 26). It can be shown that higher levels of t (or γ) reduce the marginal benefits of R&D via the direct effect, but they might either increase or decrease the marginal benefits of R&D via the indirect effect. With a smaller elasticity of the inverse demand, higher values of t (or γ) will reduce the marginal benefits of investments via the net of the two effects, and as a consequence, lead to lower levels of R&D.
3.3 Comparison of the Market Equilibrium and the Social Optimum
Direct comparison leads to the following statement:
PROPOSITION 4.
- A pay-TV regime generates socially insufficient R&D and advertising.
- Free-to-air produces mixed predictions. Particularly,
- the equilibrium level of advertising is too high (low) if
 20, and
- (ii) R&D investment is higher (lower) if
 (<)t,21 where
  reflects the net effect between the direct and indirect effect of quality investment.
Proof.See Appendix E.
The intuition behind Proposition 4 can be interpreted as follows. In the pay-TV market, advertising revenues are fully passed on to viewers. This pass-through effect implies that commercials do not affect platforms’ profits. An immediate consequence is that, with an increase in advertising, the incremental revenue is smaller than the incremental surplus, leading to a social underprovision of advertising. The pass-through effect also implies that platforms cannot absorb all rents from their R&D effort, and thus the marginal benefit of R&D is smaller than the marginal surplus of R&D, generating a socially insufficient investment.
In the free-to-air market, however, broadcasters do not charge viewers for watching their programs, and thus profits solely depend on advertising revenues. In this case, equilibrium advertising is determined by a strategic response between advertisers and viewers. Particularly, for a higher level of content differentiation (large t) and a lower level of inverse demand elasticity (small  ), broadcasters will place an excessive amount of advertising in comparison to the social optimum; conversely, for a lower level of content differentiation (small t) and a higher level of inverse demand elasticity (large
  ), broadcasters will place a smaller amount of advertising relative to the social optimum.
The difference in R&D effort stems from the exercise of market power by media platforms. Instead of equating marginal R&D cost with marginal benefits 7, free-to-air broadcasters equate their marginal R&D cost with marginal revenue 25, and take into account the indirect R&D effect 26. Broadcasters overinvest if the net of the direct and indirect effect is larger, but underinvest otherwise.
Proposition 4 implies that, compared to a pay-TV regime, free-to-air might produce higher quality programming and fewer advertisements. Armstrong and Weeds (2007) conclude that, on the contrary, program quality is higher and advertisements are fewer under pay-TV than under free-to air. The difference in quality comparison lies in the different timing of the game. Armstrong and Weeds assume that broadcasters simultaneously choose their R&D, advertisements, and prices. The current paper, however, assumes that broadcasters first choose their R&D and then their pricing strategies. Our assumption is more relevant since R&D investment is usually a more long-term decision than pricing considerations.
When quality investment is chosen first, a platform's current R&D will either reduce its competitor's price under pay-TV (as shown by 14), or lower its rival's advertising intensity under free-to-air (as shown by Lemma 1). This consequently induces a platform to lower its investment, which is obviously absent in Armstrong and Weeds (2007). It is the negative effect that explains why, in the current model, free-to-air might generate higher quality programming.
The difference in the levels of advertising arises from the difference between the restrictions on the values of t. Armstrong and Weeds (2007) assume that t is large enough, in order to obtain a non-negative price under pay-TV. Our model, however, allows for negative prices instead, which accordingly eliminates the restriction on the values of t. In the pay-TV regime, an equilibrium level of advertising does not depend on the value of t, which results from the pass-though effect. However, in the free-to-air regime, a smaller t implies a greater substitutability between the programs, which induces the platforms to cut their levels of advertising, in order to attract viewers. Therefore, equilibrium levels of advertising could be lower under free-to-air than under pay-TV.
 and
and  , where
  and
and  . In order to guarantee that the second-order condition is satisfied, we assume that
  . It is easy to derive the socially optimal levels of investment and advertising


 when
when 


- (2)
 when
when 


3.4. Asymmetric Financing Schemes
It is quite common that, in the real world, pay-TV broadcasters cohabit with free-to-air broadcasters. Thus, in this subsection, we investigate the case where broadcaster 1 has two sources of income: subscription and advertising revenue, whereas broadcaster 2 profits solely from advertising.22 The timing of the game is similar to that in Sections 3.2 and 3.3, except that, in the second stage, broadcaster 1 chooses both its advertising space and its viewing price, but broadcaster 2 sets its advertising space only.

The first-order conditions of  are the same as 9 and 10, which implies that the advertising space of platform 1 is
  . Similarly, the first-order condition of
  is the same as 19, which implies that the advertising space of platform 2 is
  .
.
 , and the quadratic R&D cost,
  , with
  ,
,  and
and

 (28)
(28) (29)
(29) (30)
(30) (31)
(31) (32)
(32)Equation 31 shows that the platforms’ levels of advertising are strategic complements. Equation 31 also suggests that platform 1's subscription price and platform 2's amount of advertising are strategic complements. Equation 32 implies that an increase in advertising intensity will force platform 1 to lower its subscription price.
 (33)
(33) (34)
(34)

 (35)
(35) (36)
(36)One can show that  , i.e., the platforms’ R&D investments are strategic substitutes.
  is due to the fact that an increase in the R&D effort by broadcaster 2 reduces subscription price S1, which inhibits broadcaster 1's R&D incentive. On the other hand, a higher R&D effort by broadcaster 1 suppresses broadcaster 2's amount of advertising and furthermore lowers broadcaster 2's R&D investment, justifying
  .
.
Equations 35 and 36 determine the equilibrium R&D efforts  . Unfortunately, it is not possible to obtain analytical derivations. Therefore, a numerical simulation is performed, and is summarized in Figure 1. The result holds for all parameter constellations checked by the authors.

Numerical simulation 1: In the case of asymmetric forms of finance, quality investment by platform 1 is always higher than that by platform 2,26 and both platforms could over- or underinvest. Platform 1 always shows a socially underpreferred level of advertising, but platform 2 might act in the opposite manner.


It is easy to show that, for higher or lower parameter values of b, the divergence between socially and privately optimal levels of R&D and advertising is smaller under pay-TV than under free-to-air; however, for intermediate parameter values of b, the opposite is true. Therefore, the pay-TV regime is socially the best if b is high (or low); but the free-to-air regime is most efficient if b is intermediate.27 Figure 2 gives the results for  ,
,  ,
,  , and
, and  . Results remain qualitatively the same for any other parameter values checked by the authors.

 ,
,  ,
,  , and
, and  .
.An immediate implication is that, if the market demand for advertising is either very large or very small, the government should permit platforms to charge viewers; but if the market demand for advertising is intermediate, platforms should be encouraged to offer programs for free.
It is interesting to compare the results of our two-sided competition model with the results from the more familiar one-sided competition model. In the standard Hotelling model with firms locating at the opposite ends of the linear segments, it is not hard to imagine that equilibrium investment is always lower compared to the socially optimal level, due to the fact that the marginal revenue of increasing R&D is smaller than the marginal surplus. Compared with the results of a one-sided market model, pay-TV in the current formulation does not produce a qualitatively different result, since it has the essential characteristics of a one-sided market, as defined by Rochet and Tirole (2003, 2006), where there is a full pass-through of advertising revenues into subscription prices.
However, a free-to-air regime (asymmetric duopoly, partially) eliminates the pass-through effect, and thus makes our model truly two-sided. As a consequence, quality provision could be above or below the socially efficient level. The general message contained in our analysis is that, in the case of two-sided markets, when strategic interactions are taken into account, the result with respect to quality investment could be qualitatively misleading, as it is based on one-sided competition models.
4. Discussion and Extensions
It is obvious that, due to the nature of the Hotelling framework, our previous analysis relies on an implicit assumption that aggregate demand is inelastic. As a consequence, an increase in quality investment affects viewers’ utility but does not affect aggregate demand. In this section, we extend the base model by allowing for elastic demand. In addition, we discuss the possible regulations of the broadcasting market by considering the case where advertising levels can be controlled.
4.1. Elastic Demand
 (37)
(37) is a scale parameter that represents the magnitude of the market expansion. As pointed out by Armstrong and Wright, an assumption,
  , is needed to ensure that market expansion is nonexplosive. It is apparent that the aggregate demand becomes
 (38)
(38) (39)
(39) . Assumption 1 is consequently modified as

 is determined by
 (40)
(40) . Similarly, one can obtain the equilibrium outcome under pay-TV:
 (41)
(41)
 (42)
(42)Direct comparisons lead to a similar finding with Proposition 4.
PROPOSITION 5.Under the elastic demand assumption, a pay-TV regime leads to socially under-desirable quality and advertising; however, a free-to-air regime might produce the opposite result.
Proof.See Appendix F.
For the asymmetric case where broadcaster 1 chooses pay-TV but broadcaster 2 chooses free-to-air, a numerical simulation yields a second result, which is illustrated by Figure 3. Similar qualitative results can be obtained for other parameter values checked by the authors.

Numerical simulation 2: For the asymmetric duopoly with elastic demand, platform 1 has a stronger R&D incentive than platform 2, and both platforms could either over- or underinvest if the market expansion effect is small (small λ); however, both platforms always underprovide quality if the opposite is true (large λ). Platform 1 always shows too few advertisements, but a free-to-air broadcaster might place too many advertisements.
4.2. Optimal Advertising Regulation
Apparently, the first-best outcome can be achieved if a social planner could choose both the levels of R&D and the levels of advertising. However, since R&D efforts are hardly measured due to private information, we therefore analyze the second-best problem facing a social planner who can regulate only the advertising intensity, and the R&D decision is left to the broadcasters. In this case, the timing of the game is modified as follows: First, a social planner chooses the level of advertising; second, both platforms determine their levels of quality investment; third, the pay media sets its subscription price; and finally, advertisers and viewers choose their platforms.
As shown above, in the pay-TV market, the level of R&D and the amount of advertising are determined, as in the first-best scenario, by disjoint sets of parameters (noted as “a separation result” in Choi 2006).28 This implies that the two distortions can be dealt with separately. An immediate conclusion is that the second-best advertising level is identical to the first-best advertising level.
In contrast to the pay-TV regime, the free-to-air regime does not generate such a separation result, which implies that correcting one type of distortion might exacerbate the other. Simple algebra leads to the following statement:
PROPOSITION 6.In the free-to-air market, the second-best advertising level ( ) is higher (lower) than the first-best advertising level (
 ) if
) if  .
.
Proof.See Appendix G.
In order to understand the intuition of Proposition 6, we need to mention that an increase in advertising intensity will encourage a platform to increase its quality investment, which follows directly from the proof of Proposition 6, i.e.,  . When the degree of competition is low (high t), it would be beneficial to increase the advertising intensity to a level higher than the social optimum, in order to induce a higher R&D effort. The corresponding loss generated by more advertisements is overweighed by the gain from higher program quality. The other case (low t) can be interpreted in a similar way.
If platform 1 chooses pay-TV whereas platform 2 chooses free-to-air, a numerical analysis leads to a third result, which is reflected by Figure 4. Similar results can be found for other parameter values checked by the authors.

Numerical simulation 3:
 when
when  ,
, when
when  ,
, when
when  .
.
 when
when  ,
, when
when  .
.
5. Conclusions
Based on a duopoly model of broadcast competition, we allow for program quality choice before the pricing stage. We have studied two alternative financing instruments: a pay-TV regime where platforms receive revenues from both advertising and subscription fees, and a free-to-air regime where platforms receive revenues from advertising only. Our analysis focuses on how financing schemes influence platforms’ choice of quality and advertising. We show that, from a welfare perspective, a pay-TV regime always produces inadequate quality and advertising, whereas a free-to-air regime might generate an opposite result. This result differs from the finding obtained by Armstrong and Weeds (2007), who show that program quality is higher and advertisements are fewer under pay-TV than under free-to-air. In the case of asymmetric competition, pay-TV always underprovides advertising, but free-to-air TV may over-provide advertising; comparison of program quality yields ambiguity.
 cannot be too large. It is worth mentioning that this assumption is sufficient but not necessary. For example, if
  , then the corresponding condition is
  . It can be shown that
  and
and  are always true for any value of
  .
. , then the corresponding condition is
  .
. , then the corresponding condition is
  .
. .
.Appendix A: A: Proof of Equations (11) and (12)


Appendix B: B: Proof of Lemma 1
Assumption 2 implies 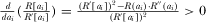 , which means
  is a strictly decreasing function. Assumption 2 also implies that there exists a unique
  such that
  and
and 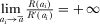 . Note that
  , there must be a unique
  satisfying 21.
We then show that  and
and  ,
,  ,
,  .
.
 . Equation
 . We can use the implicit function theorem to obtain
 (B2)
(B2) .
. . From Assumption 2, one obtains

 (B3)
(B3)
Appendix C: C: Proof of Proposition 3
 and
and  . Combining Equations
 (C2)
(C2) (C3)
(C3) (C4)
(C4) and
and  . Hence,

 such that

Appendix D: D: Proof of Corollary 1
 (D1)
(D1)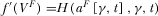 . It is easy to show that


 , we can use the implicit function theorem to obtain


Observe  implies that
  , which yields
  and
and  . From Equation 21 and Assumption 2, we know that
  and
and  . Hence,
  ,
,  ,
,  and
and  .
.
Appendix E: E: Proof of Proposition 4
E.1. Proof of Proposition 4(1)
 ,
,  ,
,  , and
, and  . Note furthermore that
  , we have
  . Observe
  implies the following results:

E.2. Proof of Proposition 4(2)
The levels of advertising. Equation 21 is equivalent to 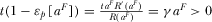 . It is easy to verify that if
  then
then . Observe
  and
and  imply that
  if
if  .
.
Quality investments. Equation 27 implies that 
 if
if  . Combining Propositions 1 and 3 together with
  yields
  if
if 
Appendix F: F: Proof of Proposition 5
Since the levels of advertising coincide with those in the base model, the order of their ranking does not change. We turn to compare the amount of R&D investment.
F.1. Comparison between VES and VEP
 and
and  . Equations
  and
and  . Direct comparison yields


Therefore, we have  .
.

 (Assumption 3)
 (since
  ).
).
 is a decreasing function. Thus we have
  .
.
F.2. Comparisons among VES, VEP, and VEF
Since it is not possible to obtain analytical derivations, we take the constant-elasticity demand function,  , and the quadratic R&D cost,
  , to perform a numerical simulation. Figure 5 summarizes the results, and they are qualitatively the same for any other parameter values checked by the authors.

Appendix G: G: Proof of Proposition 6

 is given by


 leads to
 implies that

This can be evaluated as  , which implies that if
  then
then 

Biographies
Changying Li, 27 Shanda South Road, School of Economics, Shandong University, Jinan, Shandong, 250100, P.R. China ([email protected]).
Jianhu Zhang, 27 Shanda South Road, School of Economics, Shandong University, Jinan, Shandong, 250100, P.R. China.