Automatic identification of buildings vulnerable to debris flows in Sichuan Province, China, by GIS analysis and Deep Encoding Network methods
Funding information: National Natural Science Foundation of China, Grant/Award Number: 4179043; Research on Intelligent Monitoring and Early Warning Technology of Debris Flow on Sichuan-Tibet Railway, Grant/Award Number: K2019G006
Abstract
Debris flows commonly cause tremendous damage to buildings in mountainous areas. The identification of buildings susceptible to debris flows is vital for settlement risk management. The efficient identification method is a major issue limiting the targeted regional policy setting. By combining geographic information system (GIS) and Deep Encoding Network (DE-Net) methods, we proposed an automatic identification method for buildings highly susceptible to debris flows with large-scale digital elevation data and high-resolution remote sensing imagery. The judgment criteria were based on a vulnerability matrix containing different threshold values of the horizontal distance (HD) and vertical distance (VD) between buildings and channels obtained from the statistics of 362 buildings destroyed by 23 debris flows and the maximum debris flow depths of 26 events, respectively. Five steps, which are debris flow channel extraction, building extraction, building cluster segmentation, distance calculation, and building classification, were implemented in the method. A case study in Puge County, Sichuan Province, demonstrated the high identification potential of the method for buildings susceptible to debris flows in large areas with only scarce information available. The identification results provide valuable information regarding high-risk residential areas to governments and facilitate targeted measure design in these areas in the initial planning stage.
1 INTRODUCTION
Debris flows are some of the most harmful disasters in mountainous areas, claiming thousands of lives and causing catastrophic damage to structures and infrastructure every year. Among all the elements susceptible to debris flow disasters, buildings are the most highly susceptible objects to debris flow hazards (Hu et al., 2012; Toyos et al., 2003; Zanchetta et al., 2004; Zeng et al., 2015), and most fatalities and property losses are closely related to building damage (Wei et al., 2018). There have been many notorious disasters, such as the debris flows in Venezuela in December 1999 and in Zhouqu in August 2010 (Hu et al., 2012; López et al., 2003), which destroyed a large number of buildings and resulted in very high economic losses and fatalities. The risk assessment of the debris flow damage to buildings is the basis for mitigation measure planning in mountain settlements.
China is highly susceptible to debris flow disasters and suffers much damage to buildings and loss of human lives each year. Sichuan Province in Southwest China, with mountainous regions covering ~376,000 km2 (Jiang & Zeng, 2009), is the province most severely affected by debris flows. A total of 6695 debris flow-prone catchments have been identified, and approximately 5718 settlements hosting a population of 406,065 people are threatened by debris flows. Most settlements with a high population density prone to debris flows are located in alluvial fan areas in steep valleys. Due to limited land resources, residents commonly live very close to downstream channels where historical debris flow hazard records are lacking. Moreover, strong earthquakes and extreme climate events have greatly increased the debris flow frequency since 2008 (Fan et al., 2018; Zhang & Zhang, 2016). Recent debris flow disasters have revealed that buildings dangerously close to channels are the most vulnerable (Gan et al., 2018; Hu & Huang, 2017; Tian et al., 2011). To reduce building damage and fatalities, it is necessary to identify buildings susceptible to debris flows in the preliminary stage. Field surveys, expert judgment, and numerical simulation (Anbalagan & Singh, 1996; Bell & Glade, 2004; Corominas et al., 2005; S. Liu & Lei, 2003; Mousavi et al., 2011; Zou et al., 2019) always adopted to evaluate building damage at a local scale. These methods require detailed information on the specific watershed and settlement and cannot be applied to quantitatively evaluate the risk to tens of thousands of buildings over extensive areas. A subjective and rough estimate of buildings vulnerable to debris flows through artificial investigation in a large area always involves much uncertainty which may result in unreasonable prevention planning at the beginning stage. The exact amount and spatial distribution of buildings susceptible to debris flows are vital for formulating targeted plans at a regional scale. The development of a quantitative method for the rapid automated identification of highly vulnerable buildings in a large region such as Sichuan is a challenge for scientists and technical officials.
In recent years, computational intelligence has been increasingly applied for risk management of fluvial hazards (Fotovatikhah et al., 2018; Fu et al., 2020; Mosavi & Ozturk, 2018; Taormina, 2015), and remote sensing techniques s have become complementary tools in risk assessment and urban planning (Patino & Duque, 2013; Tapiador et al., 2011; Taubenböck et al., 2008, 2009). Interpretation of high-resolution satellite imagery has been frequently applied to detect and identify buildings and other man-made objects at risk, and the buildings extracted from high-resolution imagery are highly applicable in risk management (Dash et al., 2004; Van Westen, 2004). The combination of computational intelligence and remote sensing has proven to be helpful and effective for vulnerability assessment in a large area (Patino & Duque, 2013). The automatic extraction of buildings from high-resolution satellite imagery has been studied by many researchers from different perspectives, such as object-oriented segmentation, semantic segmentation, and edge detection (Ahmadi et al., 2010; Dash et al., 2004; Ghanea et al., 2014; Xia et al., 2019; C. Zhang et al., 2012). The Deep Encoding Network (DE-Net) proposed by Liu et al. (2019) typically yields a higher building extraction precision than traditional models and is less affected by noise, such as building roof color changes or tree coverage (Liu et al., 2019). Considering the high efficiency of DE-Net in building identification in mountainous areas, the combination of geographic information system (GIS) and DE-Net methods can be adopted for the automatic identification of buildings vulnerable to debris flows in a large area.
This study introduces a new approach for the identification of buildings vulnerable to debris flows based on empirical statistics, GIS analysis, and DE-Net building extraction methods. First, distance threshold values are determined according to empirical statistics of the relative position of residential buildings destroyed by historical debris flows. Second, an identification process workflow is introduced in detail. The process mainly includes the following steps: debris flow channel extraction from digital elevation models (DEMs), building extraction from high-resolution satellite remote sensing images, relative building distance calculation, and building vulnerability level determination. Finally, the method is applied in Puge County, Sichuan Province. The approach is markedly different from the traditional method and provides a beneficial reference for high-accuracy debris flow risk management across large regions.
2 METHOD
2.1 Vulnerability matrix
The damage to buildings is impacted by many factors, such as hazard intensity and building vulnerability (Papathoma-Köhle et al., 2015). Generally, intensity parameters such as impact force, velocity, and deposition depth are derived from numerical simulations or field investigations. Building vulnerability is obtained by the matrices, curves, and indicators approach (Papathoma-Köhle et al., 2017). All the methods require a detailed investigation of specific watersheds and settlements, which is not suitable for large areas due to a large amount of work and high cost.
The relative distance, including the horizontal distance (HD) and vertical distance (VD), of buildings to debris flow channels, reflects the debris flow intensity, such as the velocity and impact force, at a given position (Akbas et al., 2009; Hürlimann et al., 2008; Jakob et al., 2012; Lo et al., 2012; Papathoma-Köhle et al., 2012). The building wall distance to a torrent channel greatly influences the impact force of fluviatile sediment transport. The flow velocity and depth near the channel are generally greater than those farther away, which may result in a high impact force on a building (Sturm et al., 2018). Without considering the inherent building characteristics, a building with a small VD to a channel is more likely to be destroyed. Therefore, in the absence of debris flow parameters and detailed characteristics of buildings, the distance of a building from a debris flow channel can be adopted as a relatively ideal indicator to identify those buildings susceptible to debris flows across large-scale regions containing building patches. However, scientific standards are lacking in regard to the safe distance of buildings from debris flows. Du et al. (2015) conducted an experimental study of the interaction between building clusters and flash floods. Their experiment indicated that the safe VD of a building from a river channel is 13 m for buildings in inner gully areas, while the safe HD is 80 m under extreme flood conditions.
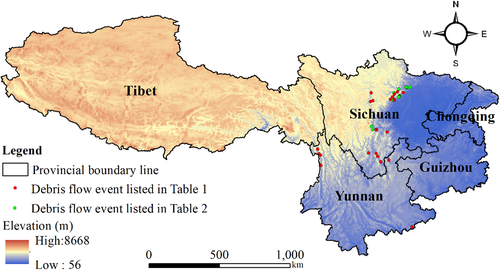
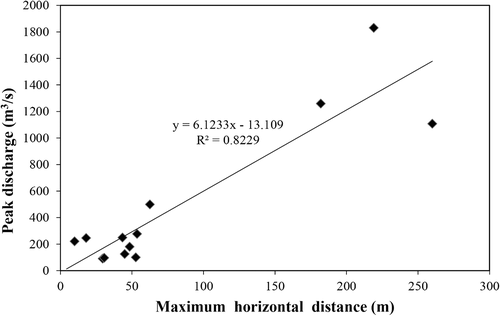
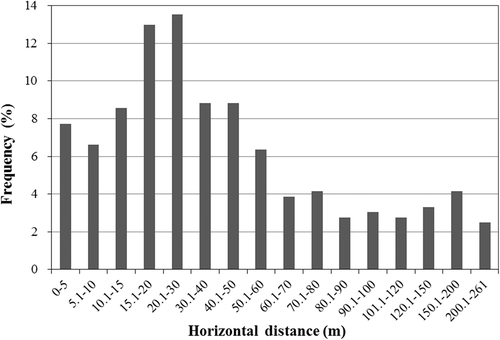
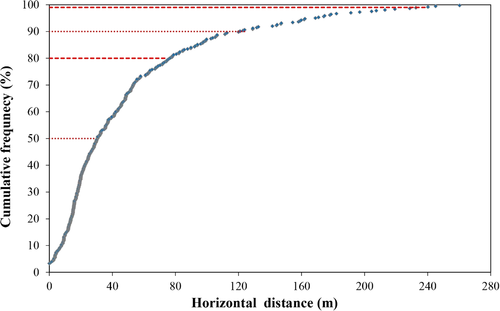
To examine the distance characteristics of damaged buildings in a specific settlement, numerical simulation of damage-causing mechanisms on the buildings exposed to debris flow is necessary. However, the analysis result is difficult to apply in other catchments due to the different characteristics of debris flow. Frequency–magnitude distributions quantify the relative probability of hazard events of various sizes, and are widely utilized in debris flow hazard evaluation (Hungr et al., 2008; Riley et al., 2013; Stoffel, 2010). In the study, a series of historical debris flow events (Figure 1) were analyzed to obtain the characteristics of damaged buildings and debris flow. These debris flow catchments are tectonically active and landform undulates greatly. The climate is an eastern monsoon climate, long-duration heavy rains, and short storms occur frequently during the wet season. The complex active geological structure, steep terrain, and abundant precipitation make these catchments the most susceptible to debris flow disasters in Southwest China. Data on 362 residential buildings destroyed by 23 debris flow events in Southwest China from 2003 to 2020 (Table 1) were compiled based on field investigation and aerial photograph interpretation. Eighteen catchments are located in Sichuan Province and the remaining five are located in Yunnan Province (shown in Figure 1 as red dots). The 23 catchments are mainly distributed in the Minjiang River basin, Ddu River basin, Jinsha River basin, and Nujiang River basin, which are most susceptible to debris flows in Southwest China (Wei et al., 2021). The majority of damaged buildings were in concentrated rural settlements, 59% of the total damaged buildings were constructed on debris fans, and the remaining 41% were located near the upper channel above the debris fan. Therein, 131 buildings were severely damaged by a catastrophic debris flow that occurred in the Qipan Valley (Wenchuan, Southwest China) on July 11, 2013 (Hu & Huang, 2017; Zhu et al., 2015). The peak discharge values of 13 debris flow events were retrieved from technical articles and government research reports. Linear regression was performed to determine the relationship between the peak discharge and maximum building HD. The F and T tests were adopted, and the linear regression results are shown in Figure 2. The results reveal that the p value of the F and T tests is much lower than 0.001 and 0.05, respectively, and the R2 value is 0.823, indicating that a high peak flow discharge results in a large destruction area. Generally, a high peak flow discharge is associated with a high velocity and narrow flow section, thus resulting in extensive damage. The positions of buildings relative to the debris flow channel (the smallest and largest HD between a building and the channel centerline) were statistically analyzed. The largest distance of a building destroyed by one of the studied debris flows was 260 m in the Wenjia Gully (Yu et al., 2013). The frequency and cumulative frequency distribution of the HD are shown in Figures 3 and 4, respectively. The distance was divided into several intervals in Figure 3. The proportions of buildings in different intervals vary and buildings at distances between 15 m and 30 m take the largest proportion. Buildings at distances of less than 60 m accounted for 73.5% of the total buildings. According to Figure 4, the distances of 50% of all buildings were less than 30 m, and the distances of 80% of all buildings were less than 80 m. In contrast, buildings at distances greater than 100 m only accounted for only 16.7% of the total buildings, and all these buildings were destroyed by a debris flow that occurred in the Wenchuan earthquake region (Tian et al., 2011). In most cases, the damage degree of a building exhibits a positive correlation with its distance to a channel due to the relatively high impact force. For example, among the 362 buildings, most buildings with a distance of less than 30 m were completely destroyed by the debris flow, and these buildings always sustained structural damage or collapsed and could not be repaired. Most casualties and massive property losses occurred in these cases. In contrast, most buildings with distances greater than 100 m were partly inundated by debris sediments with a shallow depth, resulting in a high survival rate for the people in these buildings. Hence, the ratio of the building distance could reflect the degree of loss resulting from debris flows. The cumulative frequency distribution of the HD could be adopted as a classification indicator for buildings vulnerable to debris flows. Therefore, we selected the HD as an indicator of the building vulnerability. For the regional forecasting model in risk management, the probability is usually divided into a series of reference intervals, such as (0, 20), [20, 50), [50, 60), [60, 80), and [80, 100] (S. Zhang et al., 2018), different grades of warning are defined according to the preselected intervals. The value at the probability of 50% is regarded as the key for forecasting (S. Liu et al., 2020). In this study, the probability was divided into five intervals, namely (0, 50], (50, 80], (80, 90], (90, 99], and (99, 100). The distance values corresponding to cumulative frequencies of 50%, 80%, 90%, and 99% (at 30, 80, 130, and 240 m, respectively) were employed as threshold values in HD classification. Compared to the intervals divided by S. Zhang et al. (2018), the intervals divided in the study were not uniform and decreased gradually. The division method has a particular emphasis on the first and second intervals, and more buildings with high vulnerability may be involved in this method than in the uniform division methods.
| No. | Occurrence year | Catchment name | Longitude of the gully mouth (°) | Latitude of the gully mouth (°) | Catchment area (km2) | Mainstream length (km) | Elevation difference (m) | Number of buildings | Minimum distance (m) | Maximum distance (m) |
|---|---|---|---|---|---|---|---|---|---|---|
| 1 | 2003 | Caiazui Gully | 102.3843 | 27.6641 | 5.2 | 5.5 | 1493 | 22 | 0 | 62.5 |
| 2 | 2006 | Tangfang Gully | 101.8942 | 27.6855 | 12 | 4.9 | 1819 | 2 | 5 | 10 |
| 3 | 2007 | Nianfang Gully | 102.6909 | 27.1166 | 11.1 | 4.5 | 2012 | 10 | 10 | 29.6 |
| 4 | 2010 | Lufang Gully | 103.1924 | 27.2323 | 79.9 | 10.5 | 3290 | 1 | 15 | |
| 5 | 2010 | Wenjia Gully | 104.1155 | 31.5523 | 7.7 | 4.5 | 1520 | 30 | 78.8 | 260 |
| 6 | 2010 | Jiangjia Gully | 103.5664 | 31.0820 | 0.38 | 1.34 | 695 | 3 | 0 | 20 |
| 7 | 2010 | Dongyuegehe | 98.7319 | 27.6361 | 41.9 | 13.5 | 3174 | 9 | 0 | 182 |
| 8 | 2011 | Miancu Gully | 103.7404 | 31.5859 | 64 | 17 | 2673 | 10 | 0 | 9.9 |
| 9 | 2011 | Binzhongluo | 98.6519 | 27.9358 | 44.8 | 16.11 | 3059 | 10 | 30.7 | 99.2 |
| 10 | 2013 | Qianpan Gully | 103.5513 | 31.4448 | 54.2 | 15.1 | 2900 | 131 | 7.9 | 219 |
| 11 | 2013 | Majingzi Gully | 102.3907 | 29.1812 | 8.4 | 6.3 | 1957 | 24 | 0 | 53.6 |
| 12 | 2013 | Xiongjia Gully | 102.4084 | 29.1650 | 5.5 | 4.1 | 1920 | 3 | 27.3 | 48.3 |
| 13 | 2014 | Latudi | 98.86234 | 26.9044 | 33.8 | 13.5 | 2825 | 11 | 10.7 | 43.4 |
| 14 | 2016 | Dianzisha Gully | 102.6863 | 27.1228 | 0.3 | 1 | 435 | 1 | 4.27 | |
| 15 | 2016 | Lazahe | 98.8252 | 27.5443 | 5.2 | 5.2 | 2305 | 3 | 17.6 | 18 |
| 16 | 2017 | Tongzilin Gully | 102.4792 | 27.4696 | 3.7 | 5.5 | 1780 | 7 | 3.6 | 44.9 |
| 17 | 2018 | Xiangcangpeng Gully | 104.715 | 22.878 | 0.8 | 1.99 | 318 | 9 | 0 | 30.6 |
| 18 | 2019 | Weishengyuan Gully | 103.0868 | 29.0238 | 5.9 | 1.28 | 1602 | 4 | 2.6 | 9.3 |
| 19 | 2019 | Shulinkou Gully | 103.438 | 31.264 | 41.7 | 11 | 2839 | 9 | 9.2 | 36.5 |
| 20 | 2019 | Jiajia Gully | 103.295 | 31.115 | 30.6 | 9.9 | 2871 | 18 | 19 | 70 |
| 21 | 2020 | Meilong Gully | 102.023 | 30.983 | 61 | 9 | 2586 | 12 | 15.4 | 48.2 |
| 22 | 2020 | Tunbing Gully | 102.066 | 31.537 | 11.7 | 6.2 | 1600 | 22 | 2.9 | 52.7 |
| 23 | 2020 | Chenghuangmiao Gully | 102.173 | 31.035 | 5.81 | 4 | 2050 | 11 | 3.6 | 105 |
Additionally, the VD between a building and debris channel is also pivotal for the safety of the building. Therefore, the VD of a building was chosen as the second indicator of the building vulnerability. However, the pre-disaster VD of buildings cannot be accurately determined due to a lack of pre-disaster terrain data. The debris flow depth was selected as a substitute to determine threshold values of the VD of buildings. The maximum debris flow depths in the main channels during 26 events in Sichuan Province were statistically analyzed (Table 2). The 26 debris flow catchments are distributed in the Minjiang River basin, Dadu River basin, Tuojiang River basin, and Fujiang River basin (shown in Figure 1 as green dots). All the depth values were obtained by field measurements of the mud depth of the debris flow near the alluvial fan or upper channel. The average flow depth was 3.9 m, and depths equal to or less than 5 m accounted for 80% of the total events, excluding the depth in curved channels. The debris flow depth often sharply increases in a curved channel, as exemplified by the curved channel with at depth greater than 10 m observed in the Tangjia Valley (Xie et al., 2013). Based on the above analysis, 5, 10, and 15 m were chosen as the threshold values in VD classification.
| No. | Occurrence year | Catchment name | Longitude of the gully mouth (°) | Latitude of the gully mouth (°) | Catchment area (km2) | Maximum depth |
|---|---|---|---|---|---|---|
| 1 | 2003 | Chayuan Gully | 103.5255 | 31.5300 | 19.4 | 5 |
| 2 | 2003 | Jizhong Gully | 102.1565 | 29.1861 | 2.66 | 5.6 |
| 3 | 2010 | Dongyuege | 98.7319 | 27.6361 | 41.9 | 4.1a |
| 4 | 2010 | Hongchun Gully | 103.4923 | 31.0659 | 5.35 | 0.8 |
| 5 | 2010 | Wenjia Gully | 104.1155 | 31.5523 | 7.7 | 2.7 |
| 6 | 2010 | Bayi Gully | 103.5167 | 31.0612 | 8.63 | 2.5 |
| 7 | 2010 | Jianping Gully | 103.5634 | 31.0886 | 3.6 | 1.18 |
| 8 | 2011 | Miancu Gully | 103.7404 | 31.5859 | 64 | 1.4 |
| 9 | 2012 | Tangjia Gully | 102.0783 | 29.3829 | 32.9 | 11a |
| 10 | 2012 | Yinchang Gully | 103.8777 | 31.3373 | 1 | 5.6 |
| 11 | 2012 | Shuangyanwo | 103.8763 | 31.3262 | 1.3 | 7.5 |
| 12 | 2012 | Guanzi Gully | 103.8740 | 31.3243 | 2.5 | 4.5 |
| 13 | 2012 | Gan Gully | 103.8698 | 31.3163 | 0.6 | 5 |
| 14 | 2012 | Xiejiadianzi | 103.8459 | 31.2940 | 0.9 | 4.2 |
| 15 | 2012 | Xiangshuidong | 103.8311 | 31.7865 | 3.14 | 5 |
| 16 | 2012 | Yushi Gully | 103.8311 | 31.2765 | 1.11 | 4.1 |
| 17 | 2013 | Majingzi Gully | 102.3907 | 29.1812 | 8.4 | 3.9 |
| 18 | 2013 | Qipan Gully | 103.5513 | 31.4448 | 54.2 | 1.9 |
| 19 | 2013 | Xiongji Gully | 102.4084 | 29.1650 | 5.5 | 3.8 |
| 20 | 2013 | Xujia Gully | 103.8144 | 31.2634 | 1.9 | 4 |
| 21 | 2013 | Zhangjia Gully | 104.5677 | 31.9061 | 14.4 | 4.5 |
| 22 | 2013 | Huangpi Gully | 104.3966 | 31.8654 | 10.49 | 4.5 |
| 23 | 2013 | Shuimo Gully | 104.3144 | 31.8574 | 10.25 | 5.2 |
| 24 | 2013 | Jinzi Gully | 104.2940 | 31.8973 | 1.15 | 3.5 |
| 25 | 2013 | Qingliang Gully | 104.3068 | 31.8859 | 1.52 | 5 |
| 26 | 2017 | Tongzilin Gully | 102.4792 | 27.4696 | 3.7 | 2.2 |
- Note: The references are as follows: 1: X. Liu et al. (2004); 2: Chen et al. (2003); 3: J. Zhang et al. (2015); 4: Li et al. (2012); 5: Yu et al. (2010); 6: Ma et al. (2011); 7: Chu et al. (2011); 8: Guo et al. (2012); 9: Xie et al. (2013); 10–16: Ge et al. (2012); 17,19: Ni et al. (2015); 18: Sichuan Shutong Geotechnical Investigation Co., Ltd. (2013); 20–25: J. Liu et al. (2014); 26: Chen and Huang (2018).
- a The depth sharply increases in curved channels.
Finally, a vulnerability matrix for the identification of buildings susceptible to debris flows was proposed based on the above threshold values (Figure 5). Based on the common classification methods of buildings vulnerability concerning debris flows (Fuchs et al., 2007), the building vulnerability level was mainly divided into four categories, corresponding to very high, high, moderate, and low levels. Moreover, the very high, high, and low vulnerability levels were further divided into two categories, and a total of seven levels were involved in the vulnerability matrix. The subdivided methods in this study provided a more meticulous classification of vulnerability level, these specific subdivided levels make the assessment result less vague and are more convenient for practical applications.
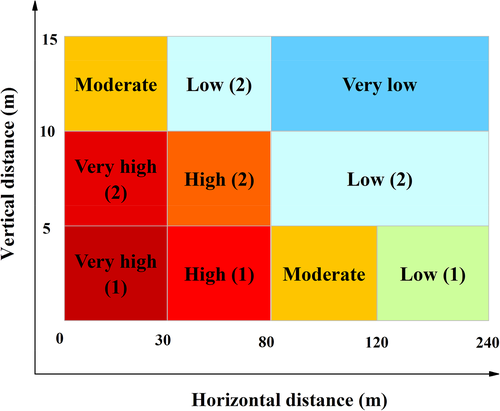
As such, the vulnerability of buildings with HD ≤30 m and VD ≤10 m is at a very high level. The vulnerability of buildings with HD > 30 m and ≤80 m and VD ≤10 m is at a high level. Buildings with HD ≤ 30 m and 10 m < VD ≤ 15 m or 80 m < HD ≤ 120 m and VD ≤ 5 m are classified as occurring at the moderate vulnerability level. Buildings with HD ≤240 m and VD ≤15 m are classified as exhibiting a low or very low vulnerability level.
2.2 Building identification
2.2.1 Extraction of the debris flow channels
A GIS system was utilized to extract debris flow channels from DEMs. The Hydrology Command tool in the Spatial Analysis toolset in ArcToolbox was applied in the process. The detailed process was divided into five stages: depression filling, flow direction calculation, flow accumulation calculation, stream network extraction, and stream network vectorization. Details of these steps have been provided in Omran et al. (2016).
2.2.2 Building extraction and segmentation
Building extraction
A fully convolutional network (DE-Net) (H. Liu et al., 2019) was adopted for building extraction from high-resolution remote sensing imagery. DE-Net consists of four modules, namely, an inception-style downsampling component, an encoding component, a compressing component, and a densely upsampling module. Building extraction details have been reported in H. Liu et al. (2019).
Building segmentation
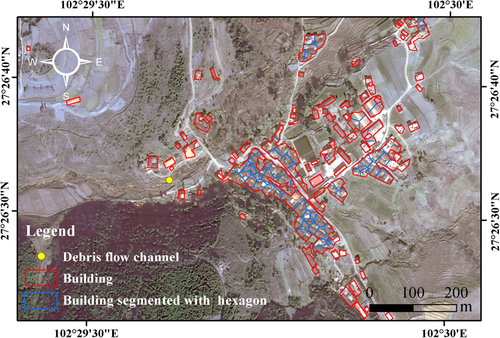
The buildings extracted in the previous step contained two types: single buildings and building clusters. A building cluster cannot be directly implemented in the following steps, and further processing is needed. The buildings near debris channels in southwestern China are always constructed at different elevations, and the HD and VD of each building in a cluster relative to the channel may not be the same. The vulnerability of building clusters cannot be used to distinguish single buildings with different vulnerability levels in practice. Field investigations have revealed that the building area in rural communities in southwestern China is often smaller than 500 m2. When the area of a building cluster exceeds 1000 m2, the corresponding distance between the building cluster and debris flow channel may cause relatively large errors for the different buildings in the cluster in most regions. Therefore, buildings with an area smaller than 1000 m2 were directly analyzed in the following step. Buildings with areas larger than 1000 m2 were selected, and the corresponding building polygons were split into hexagonal shapes with an area of 500 m2 with Python. Polygons with a very small area obtained during the splitting process were merged with adjacent polygons. Finally, the newly obtained polygons were applied in the following stage.
2.2.3 Distance calculation and building identification
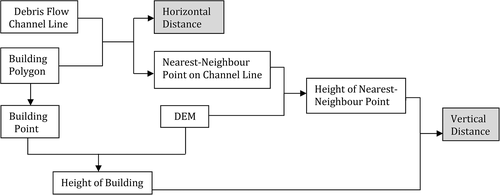
The process of distance calculation is shown in Figure 6 based on the GIS. First, the proximity tool in ArcGIS was adopted to calculate the HD between the building and debris channel. The nearest-neighbor distance was calculated between the polygon (building) and polyline (channel). Moreover, the corresponding nearest-neighbor points of the buildings on the polyline were extracted. Second, the building polygons were converted into points inside the boundary through the Feature to Point tool. The elevation values of the building points and corresponding nearest-neighbor points were then extracted from the DEM. Subsequently, the difference between the above two elevation values was considered the VD between the building and debris flow channel. Finally, the vulnerability levels of the buildings were determined according to the classification matrix, as shown in Figure 5. A final map of the buildings at the different vulnerability levels was generated for all debris flow catchments.
3 CASE STUDY—PUGE COUNTY, SOUTHWEST CHINA
3.1 Physical setting
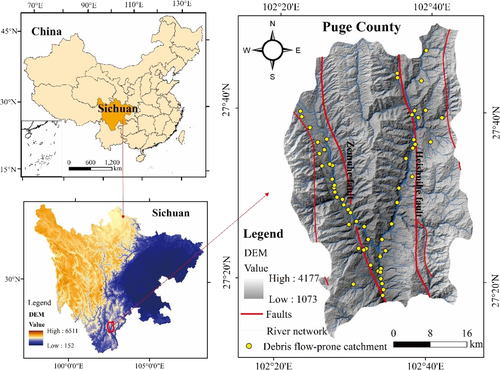
Puge County is located in the southwestern part of Sichuan Province, China. Its geographic scope includes an area of approximately 1918 km2 with longitudes of 102°26′E and 102°46′E and latitudes of 27°13′N and 27°30′N (Figure 6). The elevation in the area ranges from 1400 to 4359 m above sea level (a. s. l.) with a relative height difference of 3319 m. Areas with slopes between 10° and 30° account for 62.25% of the total area. The area spans the two secondary tectonic units of the Kangdian platform uplift and the Dianqian syncline, largely consisting of a series of north–south folds and compression and transtensional faults. The Zemuhe and Heishuihe faults are two typical structures (Figure 7). Quaternary unconsolidated deposits mainly occur along the river, and clastic rocks, including sandstone and mudstone, primarily outcrop in the northern area. Carbonate rocks, including limestone, dolomite, and marl, occupy the central and southern areas. Magmatic rocks are mostly basalt distributed in the eastern area.
The climate of Puge County is controlled by the southwest monsoon and the dry continental air of northern India. The wet and dry seasons are distinct, and the annual range of the temperature is small, while the daily range of the temperature is large. Approximately 89.2% of the rainfall occurs between May and September, which is the period when most debris flow events occur in this area. The precipitation increases with the elevation, and the average annual precipitation reaches 1176.3 mm. The maximum rainfall in 1 h and 10 min amounts to 51.2 and 15.2 mm, respectively.
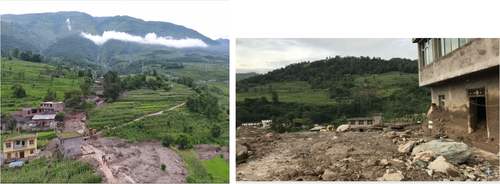
Puge County lies in the Jinsha River basin and is one of the counties in China that is the most affected by debris flows due to its active tectonic setting, abundant rainfall, and rapid urbanization. Sixty debris flow-prone catchments have been distinguished by the local government, and approximately 5630 people are at risk for debris flow hazards (Figure 6). The most recent debris flow disaster occurred on August 8, 2017, in the Tongzilin Gully, and this debris flow resulted in 25 fatalities and four injuries due to building collapse (Figure 8). Direct economic losses totaling 160 million RMB were caused by this event.
Puge County is a less developed county in China and the risk management of debris flows is still in the preliminary stage. Detailed records of historical debris flows are lacking in Puge County. Research on debris flow risk assessment in this area is scarce, and the preliminary identification of buildings prone to debris flows is mainly based on manual investigation.
3.2 Data sources and preprocessing
In this study, a DEM with a cell size of 10 × 10 m was adopted to extract the debris flow channels, and the DEM data were reprojected onto the Universal Transverse Mercator (UTM) zone 48 (WGS 1984) projection. A flow accumulation threshold value of 14,000 was applied for stream network extraction in the study area.
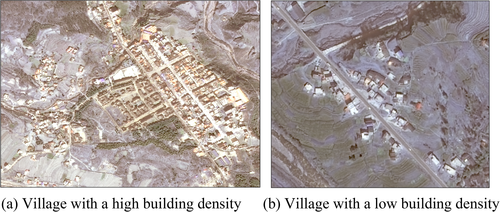
Gaofen-2 (GF-2) satellite images were employed for the extraction of buildings. GF-2 is a new-generation Chinese satellite equipped with sensors capable of resolving data at the submeter resolution launched in August 2014. Two barrel-mounted panchromatic cameras and two sets of multispectral cameras are assembled on this China-made satellite, which are collectively referred to as the Panchromatic and Multispectral Sensor (PMS). One 0.8-m-resolution panchromatic band and four 3.2-m-resolution multispectral bands are provided in the PMS data (Peng et al., 2019). Four GF-2 raw images acquired on February 27, 2019, two images obtained on April 7, 2019, two images captured on February 2, 2018, one image recorded on February 17, 2018, two images acquired on April 8, 2017, and one image obtained on February 2, 2017 were adopted in the study. The high-resolution panchromatic images and four-band multispectral mobile mapping system images were fused. Figure 9 shows two typical fused images obtained from the very large amount of data, and the two images exhibit high and low residential building densities.
3.3 Result
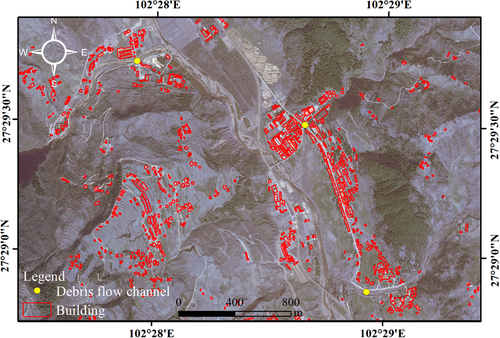
A total of 35,009 building polygons covering an area of 8.5 km2 were extracted from the GF-2 satellite images. Figures 10 and 11 show examples of the extracted buildings in two settlements, and certain buildings in Figure 11 were segmented with hexagons.
The comparison between extracted buildings and actual buildings was carried out in 10 sample areas with a single area of 1 km2. The results indicated that the correctness of the results exceeded 90%, and the completeness of the extracted buildings was higher than 85%. The extraction errors mainly occurred in the high mountainous areas. The accuracy in the alluvial fans was relatively high, while that in the high mountainous areas was relatively low due to the effect of vegetation and other factors. Most buildings extracted from the satellite images precisely conformed to reality. The buildings that were not successfully extracted from the imagery were mainly located in the high mountains, and these buildings are usually not easily destroyed by debris flows due to their large VD to the debris flow channel.
Careful scrutiny of the satellite images reveals that the settlements susceptible to debris flows are largely located near the debris flow channels at a distance of less than 1 km. To obtain the total area in all the settlements susceptible to debris flows, buffer zones with a radius of 1 km were plotted around the main channel using ArcGIS, and the total area of the buildings in these buffer zones was calculated. The results reveal that the area of buildings located in settlements near the main channels or debris flow fans reaches 2.1 km2, which accounts for 24.8% of the total area of buildings in Puge County. These buildings are always constructed with a high density in communities, and some buildings have been impacted by debris flows or flash floods. Statistics of the areas of the buildings at the different vulnerability levels in all settlements prone to debris flows are listed in Table 3. The results reveal that approximately 10% of the buildings exhibit a very high vulnerability level, 15.53% of the buildings exhibit a high vulnerability level, and the buildings at the moderate and low vulnerability levels account for 5.71% and 13.47%, respectively, of the total buildings. The highest frequency is observed at the high (1) vulnerability level, and the next highest frequency occurs at the very high (1) level. The total area of the buildings at the very high and high vulnerability levels amounts to 539,316 m2, which means that approximately 1078 buildings covering an area of 500 m2 are recognized as being at a very high or high risk of being destroyed by debris flows.
| Vulnerability level | Very high (1) | Very high (2) | High (1) | High (2) | Moderate | Low (1) | Low (2) |
|---|---|---|---|---|---|---|---|
| Area (m2) | 192,452 | 18,664 | 238,104 | 90,096 | 120,692 | 118,819 | 165,992 |
| Proportion (%) | 9.11 | 0.88 | 11.27 | 4.26 | 5.71 | 5.62 | 7.85 |
- Note: The proportion is calculated in terms of the area of the buildings in the settlements susceptible to the above 60 debris flow channels in Puge County.
Among all these settlements threatened by the 60 debris flow-prone catchments in Puge County, the communities located near 13 debris flow channels are the most vulnerable. The proportions of the areas of the buildings at the very high and high vulnerability levels in these settlements are higher than 50%. Moreover, the settlements located near six out of the 13 channels are the most vulnerable (Figures 12-15), and some have even experienced several debris flow events in the past.
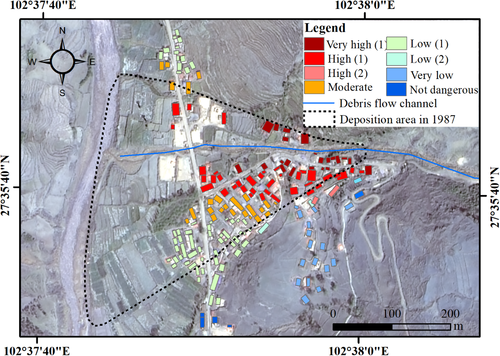
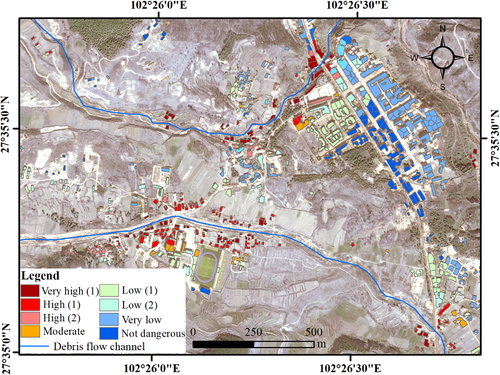
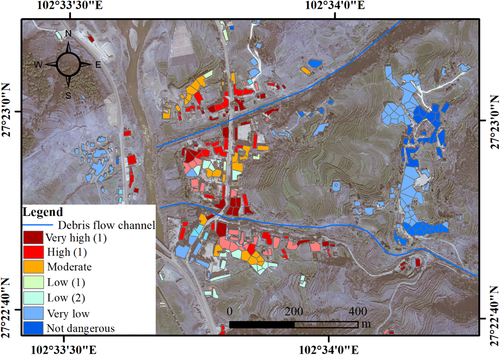
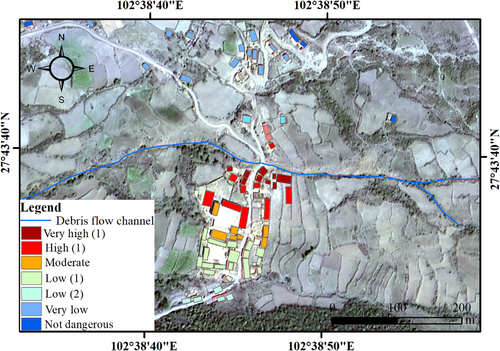
Luomo village, as shown in Figure 12, is affected by the debris flow of the Niunaidu Gully and experienced four debris flow disasters in 1987, 1997, 2006, and 2016. The 1987 debris flow occurred at approximately 2:30 a.m. on July 2, which destroyed approximately 40 buildings near the forest protection station and resulted in one death. The buildings at the very high and high vulnerability levels were mainly located in the deposition area of the 1987 debris flow (Figure 12). Three debris flow events then occurred in 1997, 2016, and 2017; fortunately, these events neither cause very high property losses nor numerous casualties. Currently, debris flows still greatly threaten the lives and properties of approximately 80 households and 400 villagers. Deyu and Luobo villages, as shown in Figure 13, are two settlement centers located near Luoji Mountain, which is a well-known tourist attraction in Puge County. Two debris flow gullies, namely, the Qinshui Gully and Jialuobo Gully, which are located in the upstream and downstream directions, respectively, threaten these two villages. The majority of the buildings, including population centers such as government buildings, kindergartens, and middle schools, in Luobo village, occur at the high and very high vulnerability levels. The very high- and high-vulnerability level buildings in Deyu village are mainly supermarkets, hotels, and restaurants targeting tourists attracted by Luoji Mountain. Similar to Luobo village, the Huashan community, as shown in Figure 14, is a popular center of Luowu town, and an elementary school, a middle school, a post office, and government departments are located in this community. More than 50% of the buildings in the above community are prone to damage at the very high and high vulnerability levels. The buildings in Weilati village are relatively sparse, as shown in Figure 15, and approximately 50% of these buildings occur at the very high and high vulnerability levels. In recent years, several households in steep mountainous areas have relocated to debris flow fan areas, such as Luomo village, after the implementation of the policy involving the relocation of impoverished residents in China. Newly constructed buildings in debris flow fan areas are likely to increase in the future, which may result in risk management challenges. More attention should be given to these communities, and further investigation is imperative for the implementation of detailed measures.
4 DISCUSSION
The method proposed herein distinguishes buildings at the different vulnerability levels in settlements threatened by debris flow across large areas. The method is based on the empirical statistics of historical events in Southwest China, and the threshold values of the vulnerability levels are determined according to the cumulative probability distribution of the distance of buildings to debris flow channels and maximum debris flow depths in the debris flow channels. Moreover, the threshold values of the distance can be adopted as references when planning the construction of buildings in debris flow fan areas. Furthermore, the GIS and building extraction techniques required for this method are widely available and relatively simple. Therefore, if high-resolution remote sensing imagery and DEMs can be obtained, the method can be applied in large regions where only scarce qualitative information is available. In addition, the method attains a high identification accuracy and efficiency and reduces the total cost relative to the artificial investigation approach, whereby the latter method subjectively determines the vulnerability levels of buildings based on self-determined distances. The distribution of buildings at the different vulnerability levels in various settlements can be simply obtained by the concerned authorities and building owners for disaster management purposes. Maps of the building identification results provide valuable settlement information. High-risk communities can be preliminarily determined according to the number of buildings at the very high and high levels in a settlement so that attention may be paid to these high-risk settlements in terms of mitigation measures.
Measures should be carefully planned for buildings based on the vulnerability level. For example, relocation should be preferentially implemented in settlements with the majority of buildings occurring at a very high vulnerability level. In addition to structural measures such as check dams and dikes, which are directed against debris flows, other measures such as deflection walls used to protect entire buildings should also be considered and implemented in communities prone to debris flows. When new buildings are constructed adjacent to existing buildings at the moderate vulnerability level, construction should occur on elevated ground or the buildings should be raised a certain distance above the ground for safety (Attems et al., 2019). Additionally, nonstructural measures are indispensable, and detailed explanations to improve debris flow awareness, understanding, and preparedness of residents in settlements with diverse numbers of buildings at different vulnerability levels should be published.
However, the building vulnerability proposed in this study is not equivalent to the concepts of hazard or risk. It only qualitatively describes the probability of building damages caused by debris flows from a macroscopic perspective. The identification method does not involve any dynamic process analysis of debris flows or building resistance. Some limitations and uncertainty remain in the analysis process.
The statistics of the locations of buildings destroyed by debris flows are generally based on limited samples in Southwest China. The safe distance of buildings in different catchments is not constant due to the distinct intensities of the debris flows and inherent building characteristics, such as structure and materials. The threshold values of horizontal distance were determined by unequal intervals of cumulative probability. Compared to the equal interval method, the selection of unequal intervals increases the number of buildings with very high and high vulnerability. The safe VD of buildings is determined subjectively by the debris flow depth due to the lack of actual VD data. The erosion and deposition of debris sediment in the main channel are not considered in the study. The threshold values of VD in the study may lead to an underestimate of building vulnerability in settlements located near debris flow gullies where serious erosion or deposition occurs.
Considering the identification process, certain limitations are identified. The resolutions of DEMs and satellite images greatly impact the accuracy of the results. A low-resolution DEM would generate channel line deviations, resulting in inaccurate distances. The segmentation approach of buildings with hexagons ignores the differences in building area and flat shape. The segmented hexagons do not perfectly coincide with the boundaries of individual buildings and may underestimate or overestimate the number of buildings in clusters. This will also lead to errors in communities with a high building density. Moreover, new buildings constructed after the acquisition time of the satellite imagery are not considered in the analysis. To avoid these limitations and uncertainties in the calculation steps, recently acquired high-resolution DEMs and satellite images should be acquired in the future.
We, therefore, recommend that the method be applied only in large areas in the early planning stage rather than as a quantitative risk assessment in a specific settlement. The identification results cannot be used as an accurate risk assessment of buildings, and much more intensive and deeper investigations should be conducted in specific settlements before the implementation of measures.
5 CONCLUSION
The classification of buildings vulnerable to debris flows is very important for early risk management planning in debris flow-prone communities. The traditional risk assessment method at the local scale requires a detailed investigation of the catchment and a census of building characteristics. In this paper, an approach for the identification of buildings susceptible to debris flows based on the empirical statistics of the locations of 362 buildings destroyed by 23 historical debris flow events was proposed. A classification matrix of the building vulnerability was developed containing threshold values of the HD and VD of buildings to debris flow channels. Values of 30, 80, 120, and 240 m corresponding to 50%, 80%, 90%, and 99%, respectively, of the cumulative frequency distribution were defined as HD threshold values, and 5, 10, and 15 m were adopted as VD threshold values. The process of identifying buildings at the different vulnerability levels mainly included five stages: debris flow channel extraction, building extraction from high-resolution remote sensing imagery via DE-Net, building cluster segmentation, distance calculation, and building classification. We demonstrated the value of the proposed method based on a case study in 60 debris flow-prone catchments. The identification results directly revealed the vulnerability level of all the buildings located in the considered debris flow-prone settlements.
The method is easily applied in large-scale regions with only scarcely available qualitative information. Despite the identified limitations and remaining uncertainties, this approach readily provides a bird's-eye view of all buildings at different vulnerability levels to policymakers, planners, and building owners in large areas. Based on the identification results, attention can be paid to settlements that contain a large number of buildings at the very high and high vulnerability levels. Furthermore, the approach is an effective tool for policymakers and planners to formulate more effective and targeted plans at the early stage of risk management.
AUTHOR CONTRIBUTIONS
Kaiheng Hu conceived and designed the automatic identification method. Li Wei made GIS analysis of the collected data and wrote the manuscript. Jin Liu provided constructive discussions with the results.
ACKNOWLEDGMENTS
This work was supported by the National Natural Science Foundation of China under Grant 41790434, and the Research on Intelligent Monitoring and Early Warning Technology of Debris Flow on Sichuan-Tibet Railway under Grant K2019G006.
CONFLICTS OF INTEREST
The authors declare that there are no conflicts of interest.
Open Research
DATA AVAILABILITY STATEMENT
All data including the remote images and the extracted buildings can be available upon request to Kaiheng Hu or Li Wei.


