Urban storm flood simulation using improved SWMM based on K-means clustering of parameter samples
Funding information: National Natural Science Foundation of China, Grant/Award Numbers: 51739009, 51979250
Abstract
To address the two problems of unclear delineation of sub-catchment and complicated and cumbersome parameter rate determination in the Storm Water Management Model (SWMM), this study proposes a rapid construction method of SWMM based on the principle of single urban functional area combined with K-means clustering algorithm, The research area is the southern part of Jinshui District, Zhengzhou City. The Hydrological Response Unit (HRU) contains only a single urban functional area, divided by combining the natural and social attributes of the urban surface. Calibrated uncertain parameters from 76 papers were selected as samples, and the K-means clustering algorithm was used to cluster and calculate the parameter values, to improve the SWMM model, selecting three typical rainfall runoff processes for validation application. The results show that simulated runoff is consistent with measured runoff trends, with the NSE and R2 value scores of the flow processes of the three floods above 0.86 and the, locations and numbers of flooded nodes are consistent with the actual research. This provides a new idea and technical support for the construction of urban flood models in flood prevention and mitigation. The relevant results can provide scientific decision-making reference for urban flood forecasting and warning.
1 INTRODUCTION
In the past 100 years, the temporal and spatial patterns of global precipitation have significantly changed leading to the increasing frequency and degree of natural disasters (Zhang et al., 2016). Since the 21st century, China's urbanization process has accelerated significantly (Li, 2019) with the continuous expansion of construction areas and the formation of urban agglomerations. The natural geomorphology of the city has undergone tremendous changes and affecting the characteristics of urban storms and floods (Re et al., 2019); (1) urban heat island effect, condensation nucleus effect and underlying surface changes have an impact on the physical mechanism of precipitation (Hu et al., 2020; Hu et al., 2018) which increased the amount and frequency of urban rainstorm; (2) urban expansion, squeezing the space of rivers and lakes, reducing the capacity of urban water storage (Wang et al., 2020). The increase in the surface hardening rate leads to an increase in the Impermeable Rate (Imperv), which reduces the infiltration rate during the rainfall process, increases the runoff and runoff coefficient, increases the flow rate, advances the peak occurrence time, and increases the risk of flooding (Hallegatte et al., 2013); (3) due to the limited urban drainage capacity, old urban area has low flood control and drainage standards, and the drainage pipe network is prone to silt and block in the process of urban development(Martins et al., 2018) The flood channel outside the city becomes the urban drainage ditches, burden of drainage, and flood control is increased (Wang et al., 2010); and (4) urban microtopography such as recessed overpasses, underground garages, and underground shopping malls facilitate the accumulation of rainwater to form waterlogging (Luo et al., 2018; Zhang et al., 2016)making urban floods increasingly serious due to the combined effects of climate change and urban development (Song et al., 2014; Zhang et al., 2014).
Urban storm flood simulation technology is one of the key technologies for urban flood prevention and disaster reduction, and it is also a hot spot in the field of urban storm flood simulation and disaster prevention and mitigation (Wu et al., 2021). Zhang et al. (2020) investigated the progress of urban flood simulation technology research and studied how to construct urban flood models. The results of SWMM, MIKE URBAN, InfoWorks ICM, MOUSE, and other model software have been used for dynamic rainfall-runoff simulation (Hu et al., 2010), These models are mainly used to simulate the city market rainstorm or water quality simulation, pipe flow calculation, boundary conditions of the pipeline network, and pumping station scheduling calculation process are focused on the calculation results of the catchment area (Hu et al., 2019). MIKE URBAN is used to calculate the movement process of urban pipe flow and integrates the drainage system. MIKE URBAN CS (Zhao, 2021) and the water supply system (MIKE URBAN WD) are suitable for water flow calculation in various urban scenarios. InfoWorks ICM (Ye et al., 2021) provides a variety of distributed surface runoff generation and confluence simulation methods. The MOUSE model of the integrated module includes rainfall infiltration, surface runoff, pipe network flow, real-time control, water quality, sediment transport, etc. Lyu et al. (2019) propose a storm flood simulation method that combines SWMM and GIS analysis, and inputs the calculated water volume in the SWMM sub-catchment into GIS. The stable water level of each grid in the GIS is used to reflect the study area's submerged depth to obtain the study area's flooding node. SWMM is widely used in drainage and flood prevention calculations, urban hydrological process simulation, water quality simulation, low-impact development measures due to its open-source code, clear principles, and strong operability (Liu et al., 2007; Newman et al., 2000; Villarreal et al., 2004; Zhang, 2017).
Sensitivity analysis of parameters is a critical part of the operating model (Ji et al., 2017). In some application studies, there is no precise method for the division of sub-catchment areas. Liu (2012) used runoff coefficients sensitive parameters identified and verified for the output calibration; Huang et al. (2007) and Shi, Pang, et al. (2014) analyzed the global parameters of SWMM by modifying the Morris method; Dong et al. (2008a) used the regional sensitivity method to take the roof as an example to study the ranking of sensitive parameters in impervious areas; the global sensitivity analysis method is more in line with the operating principle of the model (Ji et al., 2017). This paper studies the differentiation of sensitive parameters in different functional areas; the value is helpful to reflect the actual situation in the study area and improve the accuracy of flood simulation.
The problems faced in this study for flood simulation in plain cities: (1) selection of urban rain and flood simulation software; (2) SWMM parameter calibration method; and (3) No accumulation of flooding nodes are displayed on the SWMM model. Based on the previous study, the following solutions are proposed in this research: (1) Choose the SWMM model, its code is open source, the principle is clear, the operability is strong, and it can be coupled with GIS; (2) In the previous research, take typical values or apply a specific value to the entire study area and selects different function areas to take different parameter calibrations; and (3) SWMM and GIS are coupled to visualize the overflow of the pipeline (Lyu et al., 2019).
This study takes the southern part of Jinshui District, Zhengzhou City, China, as the study area. According to urban hydrological data such as remote sensing images, land use properties, drainage pipe network and precipitation water, a city storm flood simulation model is constructed based on SWMM. The urban HRU division and parameters are taken to improve the model in terms of value, propose the principles and methods for dividing HRU. The K-mean clustering algorithm was applied to calculate the values of uncertainty parameters in three different urban functional areas of Commercial Areas (CA), Residential Areas (RA), and Public Areas (PA) to improve the simulation efficiency of the model to provide a decision-making basis for urban flooding node reconstruction, flood prevention and disaster reduction detection, and flood disaster loss risk assessment.
2 MATERIALS AND METHODS
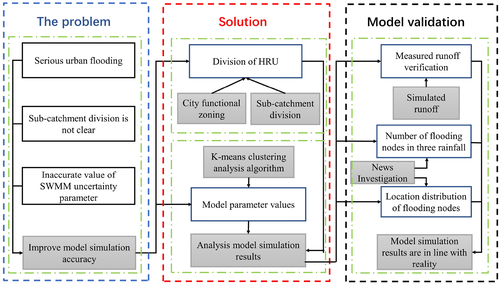
In the application of numerical simulation of urban rain and flood, the unclear principle of dividing the corresponding unit of urban hydrology and the cumbersome and complicated parameter calibration process are two problems. To further improve these two issues, the first step of this research is to propose a new urban HRU division method; the second step is to use the K-means clustering algorithm for parameter sample learning. These two steps constitute an improved SWMM model. The research framework is shown in Figure 1.
2.1 Methods
2.1.1 SWMM model
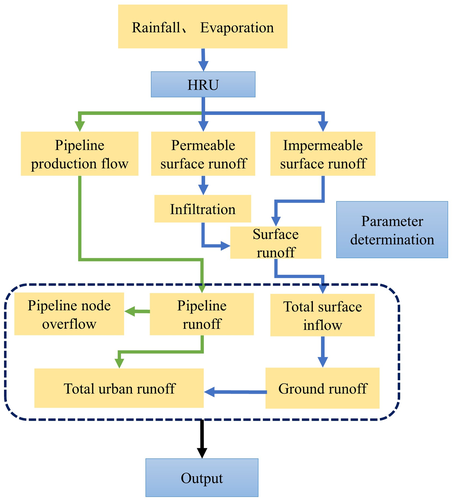
The U.S. Environmental Protection Agency developed SWMM in 1971. It can dynamically simulate the precipitation-runoff process on the surface, pipe network, and river channels in urban areas. The Surface Runoff Module (SRM) needs to separate the study area and divide it into multiple HRU; the Surface Confluence Module (SCM) treats the HRU as a nonlinear reservoir for calculation; the Pipe Network Confluence module (PNCM) uses the motion wave method or the dynamic wave method for calculation. The frame diagram of the SWMM model is shown in Figure 2.
2.1.2 SWMM parameter values
SWMM model parameters can be divided into deterministic parameters and uncertain parameters (Table 1). Deterministic parameter values are obtained by field measurement or software analysis (Zhao, 2021). Uncertainty parameter values are often obtained by parameter calibration or directly using typical values, and then applied to the entire study area. This parameter calibration method has certain accuracy, but it is difficult to reflect the characteristics of HRU in urban areas. If different parameter values are taken in different urban functional zones then the model can reflect the spatial variation characteristics of the urban surface (Wu et al., 2021).
| Model parameters | Deterministic parameter | Uncertainty parameter |
|---|---|---|
| SRM | Sub-catchments area, Characteristic width, Impervious area rate | Depth storage in the permeable area (Destore-Perv), Depth storage in the impervious area (Destore-Imperv), Maximum infiltration rate (MaxRate), Minimum infiltration rate (MinRate), Attenuation Coefficient (Decay) |
| SCM | Slope | Manning Coefficient in the permeable area (N-Perv), Manning Coefficient in impervious area (N-Imperv) |
| PNCM | Node elevation, Pipe shape, Length of Pipe, The Pipe Bottom Elevation | Manning coefficient of the pipeline (Conduit Roughness) |
The sensitivity of model uncertainty parameters is related to rainfall characteristics and subsurface conditions. In different studies in the literature, Destore-Imperv, Destore-Perv, N-Imperv, and N-Perv have different values. The surface depression storage volume (SDSV) reflects the depth of depression storage in HRU and the surface. Manning coefficient (SMC) reflects the resistance of precipitation in passing through HRU. Under small slope and undulating topography conditions in plain cities, SDSV and SMC become more significant sensitive parameters and more correlated with urban surface characteristics.
The Imperv is one of the most sensitive parameters in the model's hydrological characteristics, which refers to the percentage of the impervious surface area of sub-catchment to the overall area (Wu et al., 2021; Zhang, 2012). This study uses the intersection tabulation function in GIS to extract and calculate the sub-catchment and land-use layer, also calculate the impermeability of each sub-catchment. Imperv of different sub-catchment is shown in Table 2.
| Sub-catchment | 56 | 57 | 58 | 59 | 60 | 61 | 62 | 63 | 64 |
|---|---|---|---|---|---|---|---|---|---|
| Imperv | 29.02 | 58.69 | 63.14 | 73.12 | 56.92 | 59.60 | 60.12 | 52.41 | 59.69 |
| Sub-catchment | 65 | 66 | 67 | 68 | 69 | 70 | 71 | 72 | 73 |
| Imperv | 78.99 | 44.83 | 79.74 | 48.25 | 48.35 | 59.15 | 49.16 | 69.70 | 64.82 |
2.1.3 K-means clustering algorithm
The K-means cluster algorithm is a clustering technique that attempts to determine K nonoverlapping clusters to maximize between cluster variance and minimize the within cluster variance (Alizadeh et al., 2017; Fernandez et al., 2016). The main steps of K-means cluster algorithm are summarized as follows (Figure 3).
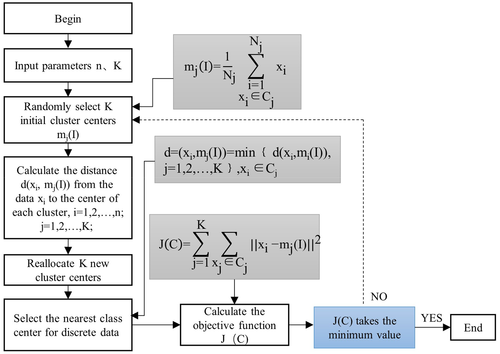
When applying the K-means clustering algorithm, the set of data points used for clustering and the number of clusters K need to be given. The set of data points are Destore-Perv, Destore-Imperv, N-Perv, N-Imperv and K is the urban functional zone Quantity in the literature. According to the characteristics of different urban functional areas, the clustering results are matched with the urban functional areas, and the values of the four parameters in different urban functional areas are obtained.
2.1.4 Division principle of HRU
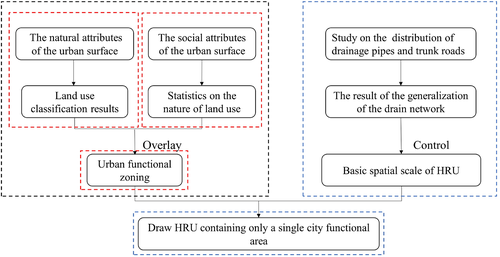
In the application research of the SWMM model, the division of sub-catchment depends heavily on the experience of researchers. There are no specific conditions for the number and area of sub-catchment and type of land used. Comprehensive analysis of these studies achievements, absorbing the experience of sub-catchment division, on this basis, discussing the number and spatial scale of sub-catchment division as the basic HRU (Wu et al., 2020), and proposing its division principle. The division road map is shown in Figure 4.
Principles for dividing HRU:
(1) The urban surface has both natural and social attributes, and the two attributes are superimposed to divide the city's function;
(2) Analyze the topography and confluence characteristics of the study area which determine the drainage area to use the distribution of the main drainage pipe network, and the main road as the division frame;
(3) Control the number of HRU and the basic spatial scale. The generalization result of the drainage network is the ratio of the number of pipe sections and the number of nodes to the number of sub-catchment is mostly between 0.6 and 1.4 (Du, 2020; Zhang, 2017);
(4) Draw HRU within the division and basic spatial scale framework and make the HRU have only one urban functional area.
2.1.5 Model validation
The model validation was performed on the measured runoff from three fields of 20160605, 20170730, and 20170812. The prediction effect of the model after parameter rate setting was evaluated by analyzing the relevant results of measured runoff, simulated runoff, Nash-Sutcliffe efficiency (NSE) and Coefficient of determination (R2).
Besides, we obtained the location information of common flooding nodes in the study area through relevant news reports provided by the Zhengzhou Flood Control Office and on-site investigations which illustrate the practicality of the model.
2.2 Materials
2.2.1 Study area
Located between 112°42′E–114°14′E and 34°16′N–34°58′N, Zhengzhou is the capital of Henan Province and its political, economic and cultural center. Typical flat prototype city, flat and open terrain, rapid urban development, and the central urban area from 5.23 km2 in 1948 to 601.77 km2 in 2018, In this study, Jinshui District was selected because it has a developed economy, high population density, many buildings, and a complete drainage network system. The study area is 64.42 km2 and there are four rainfall stations in the area (Figure 5). It can be divided into 292 sub-catchment and 272 pipe sections.
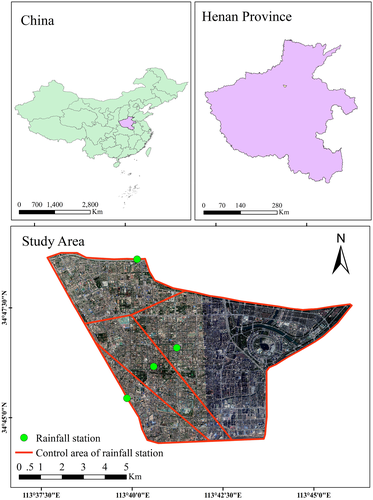
The study area belongs to the continental monsoon climate, characterized by rain and heat at the same time, four seasons, the average rainfall of many years is about 635 mm, rainfall concentrated in June to September, accounting for more than 60% of the total annual rainfall. Due to the short and intense rainfall in summer, and the low design standard of the pipe network in the study area. The susceptible siltation of the storm water mouth and the pipe network will lead to water accumulation in some areas and the formation of flood disasters.
2.2.2 Rainfall data
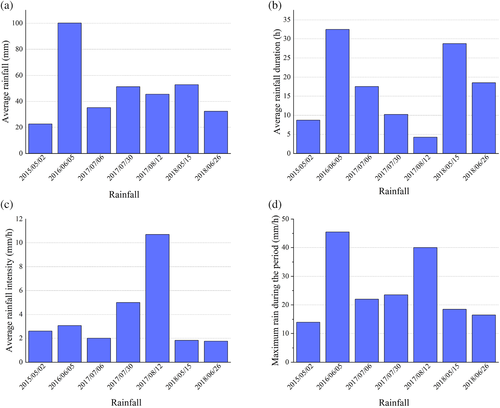
The rainfall data from 2015 to 2018 was selected in the model study area, measured by four rainfall stations (Figure 3). From 2015 to 2018, the selected rainfall-runoff sequence, selected seven rainfalls as the model input data namely 20150502, 20160605, 20170706, 20170730, 20170812, 20180515, and 20180626. The rainfall characteristics of each session are shown in Figure 6.
2.2.3 Parameter sample
In this study, we selected 76 documents as the value samples of the K-means clustering algorithm, and summarized many sensitive parameter values in the documents based on the SWMM model. Some researched parameter values are shown in Table 3.
| Author | Study area | Destore-Imperv (mm) | N-Imperv | Destore-Perv (mm) | N-Perv |
|---|---|---|---|---|---|
| He et al., 2015 | West of Kaifeng | 3.5 | 0.024 | 6.5 | 0.24 |
| Jia, 2018 | Dalian | 3 | 0.014 | 7 | 0.2 |
| Huang et al., 2015 | Guangzhou | 0.254 | 0.013 | 0.508 | 0.24 |
| Shi, Pang, et al., 2014 | Beijing | 1.5 | 0.024 | 4.7 | 0.18 |
| Ma et al., 2012 | North of China | 3.5 | 0.012 | 6.5 | 0.15 |
| Li, 2013 | Suide County | 0.05 | 0.01 | 0.05 | 0.1 |
| Li, 2016 | Zhengzhou | 3.5 | 0.021 | 6.8 | 0.18 |
3 RESULTS AND DISCUSSION
3.1 Division of HRU
Based on dividing HRU (Figure 5), this study divided the study area into urban functional areas and drew HRU containing only a single urban functional area.
3.1.1 City functional zoning
(1) Analysis of natural attributes of urban surface.
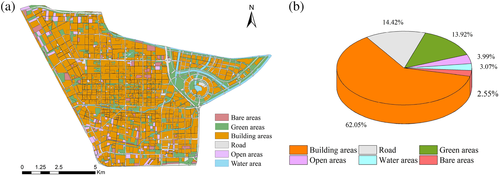
Land use classification can reflect the natural attributes of the urban surface. The remote sensing image with a spatial resolution of 1 m × 1 m in the southern part of Jinshui District is obtained from Google Earth, and Arc-GIS combined with artificial recognition is used to classify the underlying surface of the study area. Six land use types were divided: bare areas, green areas, building areas, road, open areas and water areas. The land use classification map and various types of land area are shown in Figure 7.
(2) Analysis of social attributes of urban surface.
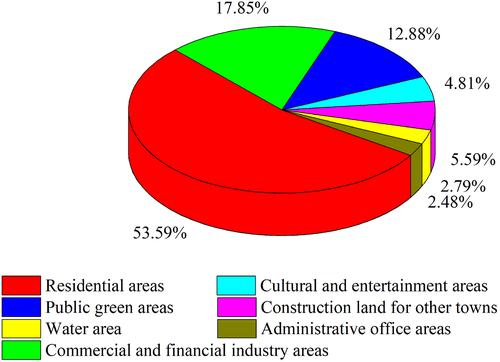
The nature of land use can reflect the social attributes of the city's surface. According to the central urban land plan in the “Zhengzhou City Master Plan (2010–2020)” (Hu et al., 2019). The study area located in the central urban area includes many residential areas and school areas, administrative office areas, commercial and financial industry areas, public green areas, water areas. The statistical analysis of the land area of different properties in the study area is shown in Figure 8.
(3) Urban functional zoning.
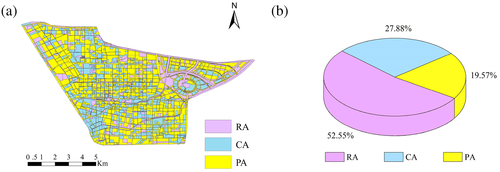
According to the land use classification map and land use planning map, it can be seen that the social attributes and the natural attributes cross and merge, and the natural attributes and social attributes of the underlying surface are combined to carry out urban functional zoning. Combine attributes of land use type classification, to prevent the problem of too few categories of urban functional divisions to distinguish HRUs, and too many categories, so it is difficult to determine the parameter values under each sub-category. Finally, the urban functions of the study area are divided into three categories: CA, RA, and PA. The urban functional zoning map and the area of each district are shown in Figure 9.
3.1.2 Division of sub-catchment
According to the current situation and planning of the pipeline network in the Jinshui District of Zhengzhou City the drainage network is generalized based on the spatial topology. The generalization result is 265 nodes, 272 pipe sections, and one outlet. The generalized results of pipe network nodes are shown in Figure 10.
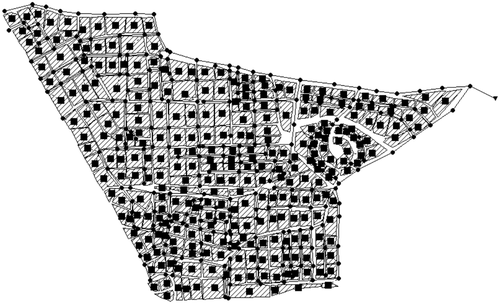
Based on the principle of HRU division, the number of sub-catchment is often between 0.6 and 1.4 times the number of pipe sections and nodes (Du, 2020; Zhang, 2017). In addition, according to the research on the spatial scale of the urban storm flood simulation model of Zhengzhou City; there are 2200 sub-catchment with an area of about 550 km2 in Zhengzhou, average area of sub-catchment is 0.25 km2, sub-catchment areas are between 0.0108 and 1.2413 km2 (Hu et al., 2019) which determines the basic spatial scale of the sub-catchment of the study area. When the SWMM-based urban flood simulation model was established in the southern part of Jinshui District, the study area was drawn as four large drainage areas according to the topography of the study area, the distribution of river systems, main streets and main pipe networks, and generalized in each drainage area and pipe network Results Control the basic spatial scale of the sub-catchment and try to make only a single urban functional area exist in a sub-catchment. The final number of sub-catchment divided is 292 and the area of the study area is 64.42 km2. The average sub-catchment is 0.22 km2 and the result of sub-catchment division is shown in Figure 10. Finally, according to the DEM data of the study area and the water flow direction in the pipe network, the confluence direction between sub-catchment and the pipe network is established.
3.2 K-means clustering uncertainty parameter
Taking the values of these parameters in Table 3 as samples, the K-means clustering algorithm calculates the parameter values on different urban functional areas. The number of clusters K is set to 3 and the clustering results are shown in Table 4.
| Depression of impermeable area (mm) | |
| CA | 0.27 |
| RA | 1.98 |
| PA | 3.36 |
| Depression of permeable area (mm) | |
| CA | 2.50 |
| RA | 6.50 |
| PA | 12.50 |
| Manning coefficient of Impermeable area | |
| CA | 0.013 |
| RA | 0.023 |
| PA | 0.050 |
| Manning coefficient of permeable area | |
| CA | 0.044 |
| RA | 0.205 |
| PA | 0.477 |
For other parameters, the calculation results of flood control and drainage in Zhengzhou City (Li, 2016) are used as the values of model parameters. Among them, MaxRate (f∞) is 76.2 mm/h; MinRate (f0) is 3.6 mm/h; AC (K) is 3; Conduit Roughness is 0.014; and the MC of the river course is 0.03.
3.3 Validation of simulation results
The Thiessen polygon method calculated areal rainfall as the model input data (Figure 5). The improved SWMM model simulates the urban runoff process, and the nodes where overflow occurs in the simulation results. It was marked as ponding points to obtain the number and location distribution for the three rainfall events.
The runoff simulated by the calibrated model is compared with the measured runoff, and the model is verified. The results show that the calibrated model has a better simulation effect. Figure 11 shows that the error between the peak present time of the simulated runoff and the measured value does not exceed 2 h. Hence, the simulation effect is better after the model is calibrated.
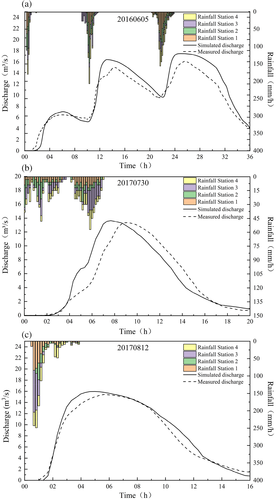
The NSE values of the three sessions in Table 5 are all >0.86. The closer the NSE value is to 1 higher the accuracy of the prediction results, and the R2 values are all >0.86, the prediction results are accurate. The rainfall in Figure 11c has NSE value of 0.97 and R2 value of 0.9831, which shows the best simulation effect.
| Rainfall | NSE | R2 |
|---|---|---|
| 20160605 | 0.91 | 0.9714 |
| 20170730 | 0.86 | 0.8604 |
| 20170812 | 0.97 | 0.9831 |
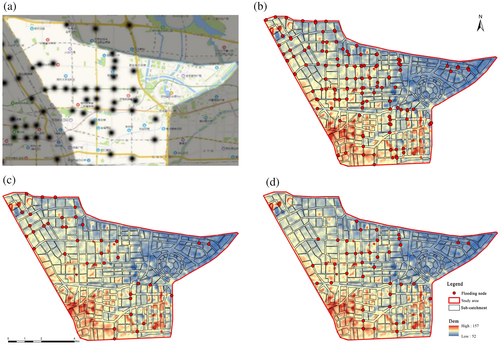
Further analyze the simulation results, count the number of flooding nodes and study the location distribution of flooding nodes (Figure 12). It can be seen from Table 6 that the 20160605-rainfall event has a large amount of precipitation, and the number of flooding nodes generated is more than the other two rainfall events. The number of flooding nodes generated by the 20170812-rainfall event is also greater than that of the 20170730-rainfall event. There are often news reports on flooding nodes after rainfall. According to the number of news articles about flooding nodes through investigations; 45 pieces of information were crawled in the 20160605-rainfall event, 17 pieces of information were crawled in the 20170730-rainfall event, and a total of 29 pieces of information were crawled in the 20170812-rainfall event. The number of news items crawled is consistent with the number of flooding nodes in the three rainfall events simulated by the model. It indicates that the number of simulated flooding nodes is like the actual number of flooding nodes.
| Rainfall | 20160605 | 20170730 | 20170812 |
|---|---|---|---|
| Number of flooding nodes | 159 | 37 | 40 |
Through the investigation of possible flooding nodes in the city by the Zhengzhou Flood Control Office, combined with the survey results, a large number of news reports after rainfall occurred and the location distribution of common flooding nodes in the study area were obtained. The flooding nodes of the 20160605-rainfall event covered almost all common flooding nodes. The distribution is closest to the common flooding nodes, although the number of flooding nodes in the 20170730-rainfall event is close to the 20170812-rainfall event. The location distribution is quite different because the spatial distribution of the two rainfalls is very different. For the 20170730-rainfall event, the rainfall in the northwest of the study area was much more than that in other areas, resulting in more water accumulation.
The flooding nodes of these three rainfall simulations are mostly distributed in the northwest of the study area. Analyze the urban functional zoning of the study area; the northwestern part has dense industrial and commercial land, dense buildings and large surface hardening area, large imperviousness, low Surface Depression (SD), low SMC, the fastest confluence speed, and the most prone to water accumulation. The simulated water accumulation rarely occurs in the northeast of the study area, public land in the study area is most distributed, the soil coverage area of the public green area is large, sparse buildings, lush vegetation, low imperviousness, large SD, large SMC, not easy to produce water, and there is no actual flooding node in this area. The above results prove that the simulation results of the model conform to the actual situation.
4 CONCLUSIONS
In order to realize fast and effective urban rainfall simulation, this study focused on the problem of exponential growth in the number of parameter rate determinations arising from the increase in the number of sub-catchment complex urban sub-bedding surfaces and uses the SWMM to examine this. The principles and methods of dividing HRU in urban flood model simulation have been used, by dividing the study area into single urban functional areas CA, RA, and PA. Based on the literature survey data, the K-means clustering algorithm calculates the parameter values of different urban functional areas, and an improved model was used to simulate the study area.
The results show that the simulated runoff of the three rainfall fields is consistent with the trend of the measured runoff, with NSE and R2 values >0.86; Most of the flooded nodes obtained from the simulation are distributed in the northwestern part of the study area, with dense distribution of CA and RA in the northwestern part and large Imperv. This distribution of flooded node locations is consistent with the actual situation.
In this study, the relationship between SWMM uncertainty parameters and urban complex subsurface, four parameter clustering methods such as Destore-Imperv, N-Imperv, Destore-Perv, and N-Perv are discussed, providing new ideas to improve the model simulation efficiency from the parameter perspective. It proposes a fast and efficient method to determine the parameters of SWMM model and greatly improves the speed of the urban flood model to obtain uncertain parameters. Thus, providing the possibility of urban flood simulation. Future research could perhaps improve the division accuracy of HRU and promote and apply them in coastal cities for stable model simulation and calibration and verification to improve the model's simulation accuracy.
AUTHOR CONTRIBUTIONS
For this research paper with several authors, a short paragraph specifying their contributions was provided. Yue Sun and Xian Du completed the data collection, calculation and research articles finishing section. Chengshuai Liu was responsible for data collecting. Caihong Hu provided guidance and improvement suggestions. Yichen Yao and Shan-e-hyder Soomro provided some guidance for the writing of the article. All authors have read and approved the final manuscript.
FUNDING INFORMATION
This study was funded by Key projects of National Natural Science Foundation of China, grant number 51739009 and 51979250.
CONFLICT OF INTEREST
The authors declare no conflict of interest.
Open Research
DATA AVAILABILITY STATEMENT
Data sharing is not applicable to this article as no new data were created or analyzed in this study.


