LMO1 polymorphisms and the risk of neuroblastoma: Assessment of meta-analysis of case-control studies
Abstract
Neuroblastoma (NB), a neuroendocrine tumour, is one of the most prevalent cancers in children. The link between LMO1 polymorphisms and NB has been investigated by several groups, rendering inconclusive results. Here, with this comprehensive systematic review and up-to-date meta-analysis, we aim to distinctively elucidate the possible correlation between LMO1 polymorphisms and NB susceptibility. Eligible studies were systematically researched and identified using PubMed, Web of Science and Scopus databases up to 10 February 2019. Odds ratios (ORs) and 95% confidence intervals (CIs) were calculated to assess the strength of the associations. Our findings revealed that rs110419 and rs2168101 polymorphisms were significantly associated with a decreased risk of NB in all genetic models. In addition, the rs4758051 variant appeared protective against NB in homozygous, dominant and allele genetic models, whereas the rs10840002 variant markedly decreased the risk of NB in the allele model. In contrast, the rs204938 polymorphism showed a positive association with NB susceptibility in allele genetic models. In summary, our meta-analysis is the first to provide clear evidence of an association between specific polymorphisms of LMO1 and susceptibility to NB. Of note, additional larger well-designed studies would be helpful to further evaluate and confirm this association.
1 INTRODUCTION
Neuroblastoma (NB) is the most common solid tumour outside of the cranium in children, especially within the first 5 years after birth (median age of diagnosis at about 17 months).1-3 The tumours are most common in the abdomen (65%), followed by the neck, pelvis and chest (2). Neuroblastoma is a neuroendocrine tumour, which originates from the developing sympathetic nervous system, and its prevalence varies worldwide, affecting approximately 8-14 individuals per million in the developed countries.4
Possible risk factors suspected of aiding the development of NB in children include parental exposure to radiation sources, solders, wood dust and hydrocarbons.5, 6 Hence, degradation of environment may contribute to the occurrence of the cancer. Furthermore, with the advances in regenerative medicine and the use of novel biomaterials in implants such risks may increase.7, 8
Our group performed in the past years several meta-analyses,9-11 which underlined the role of polymorphisms in various cancer-associated genes. Over the last decade, genome-wide association studies (GWAS) have identified several loci linked to NB susceptibility,12-22 of which the LIM domain only 1 (LMO1) gene at 11p15.4 represents a promising candidate.14 LMO1 was recognized as neuroblastoma oncogene.14 It also acts as an oncogene in colorectal cancer (CRC) and lung cancer. LMO1 overexpression is a new predictive marker for anti-EGFR therapy.23, 24 However, no significant differences were observed for LMO1 gene expression level between tumour tissues and corresponding adjacent benign tissues in human breast cancer, hepatocellular carcinoma (HCC) and gastric cancer (GC), which suggests that LMO1 gene may display a more complex functional network in these cancers.24 Sun et al25 have found that the expression levels of LMO1 in gastric cancer tissues were higher than those in adjacent tissues and the overexpression of LMO1 could be as a markers of poor prognosis. Deregulated expression of LMO1 may be involved in the development and maintenance of T-ALL (T-acute lymphoblastic leukaemia).26
Thus far, several studies have investigated LMO1 polymorphisms and their impact on NB susceptibility, with varying and inconclusive results.14, 20, 27-33 In the current study, we performed an up-to-date meta-analysis to more precisely evaluate the association between specific LMO1 polymorphisms and NB susceptibility.
2 METHODS
2.1 Literature search
To identify all potentially eligible literature, PubMed, Scopus and Web of Science databases were searched for relevant publications up to February 2019. The search keywords were ‘neuroblastoma’ and ‘LIM domain only 1 or LMO1’ and ‘polymorphism or mutation or variation’. Studies were included in our meta-analysis if they met the following inclusion criteria: (a) original case-control studies; and (b) studies comprising necessary genotyping data of LMO1 polymorphisms in both disease cases and controls. The exclusion criteria were as follows: (a) case reports, conference abstracts, meta-analyses and duplication data; and (b) studies lacking genotype information.
2.2 Data extraction
Two investigators independently searched literature and extracted the appropriate data from eligible studies. Data collected from each study included: the first author, publication date, country, ethnicity of study participants, control-population source, genotyping methods of LOM1 polymorphisms, genotype distributions in cases and controls, and the result of the HWE test (Table 1).
| First author | Year | Country | Ethnicity | Source of control | Genotyping method | Case/Control | Cases | Controls | HWE (P) | ||||||||
|---|---|---|---|---|---|---|---|---|---|---|---|---|---|---|---|---|---|
| rs110419 | AA | AG | GG | A | G | AA | AG | GG | A | G | |||||||
| Capasso M | 2013 | Italy | Caucasian | PB | Illumina HumanHap550 | 323/774 | 87 | 152 | 84 | 326 | 320 | 133 | 370 | 271 | 636 | 912 | 0.727 |
| Capasso M | 2013 | USA | European American | PB | Illumina HumanHap550 | 1626/2575 | 509 | 787 | 330 | 1805 | 1447 | 599 | 1310 | 666 | 2508 | 2642 | 0.357 |
| He J | 2016 | China | Asian | HB | TaqMan | 256/531 | 103 | 117 | 36 | 323 | 189 | 159 | 275 | 97 | 593 | 469 | 0.248 |
| He L | 2018 | China | Asian | HB | TaqMan | 313/762 | 150 | 118 | 45 | 418 | 208 | 279 | 355 | 128 | 913 | 611 | 0.405 |
| Latorre V | 2012 | USA | African American | HB | Illumina HumanHap 550 | 365/2491 | 223 | 124 | 18 | 570 | 160 | 1491 | 863 | 137 | 3845 | 1137 | 0.409 |
| Lu J | 2015 | China | Asian | HB | MassARRAY iPLEX | 244/305 | – | – | – | 359 | 129 | – | – | – | 369 | 241 | – |
| Oldridge DA | 2015 | USA | European American | N.A | Illumina HumanHap550 | 2101/4202 | – | – | – | 2349 | 1853 | – | – | – | 4110 | 4294 | – |
| Wang K | 2011 | USA | Discovery | N.A | Illumina HumanHap550 | 1627/3254 | – | – | – | 1790 | 1464 | – | – | – | 3189 | 3319 | – |
| Wang K | 2011 | USA | US replication | N.A | Illumina Human610 | 190/1507 | – | – | – | 232 | 148 | – | – | – | 1477 | 1537 | – |
| Wang K | 2011 | USA | UK replication | N.A | TaqMan | 253/845 | – | – | – | 268 | 238 | – | – | – | 811 | 879 | – |
| Wang K | 2011 | USA | Italian replication | N.A | TaqMan | 181/491 | – | – | – | 177 | 185 | – | – | – | 403 | 579 | – |
| Zhang J | 2017 | China | Asian | HB | TaqMan | 374/812 | 150 | 171 | 53 | 471 | 277 | 245 | 417 | 150 | 907 | 717 | 0.239 |
| rs4758051 | GG | AG | AA | G | A | GG | AG | AA | G | A | |||||||
| Capasso M | 2013 | Italy | Caucasian | PB | Illumina HumanHap550 | 340/792 | 70 | 156 | 114 | 296 | 384 | 141 | 405 | 246 | 687 | 897 | 0.248 |
| Capasso M | 2013 | USA | European American | PB | Illumina HumanHap550 | 1624/2571 | 436 | 787 | 401 | 1659 | 1589 | 525 | 1292 | 754 | 2342 | 2800 | 0.507 |
| He J | 2016 | China | Asian | HB | TaqMan | 256/531 | 95 | 126 | 35 | 316 | 196 | 194 | 242 | 95 | 630 | 432 | 0.199 |
| He L | 2018 | China | Asian | HB | TaqMan | 313/762 | 138 | 123 | 52 | 399 | 227 | 256 | 364 | 142 | 876 | 648 | 0.530 |
| Latorre V | 2012 | USA | African American | HB | Illumina HumanHap 550 | 365/2491 | 239 | 108 | 18 | 586 | 144 | 1692 | 713 | 86 | 4097 | 885 | 0.310 |
| Lu J | 2015 | China | Asian | HB | MassARRAY iPLEX | 244/305 | – | – | – | 332 | 156 | – | – | – | 357 | 253 | – |
| Oldridge DA | 2015 | USA | European American | N.A | Illumina HumanHap550 | 2101/4202 | – | – | – | 2059 | 2143 | – | – | – | 4605 | 3799 | – |
| Wang K | 2011 | USA | Discovery | N.A | Illumina HumanHap550 | 1627/3254 | – | – | – | 1660 | 1594 | – | – | – | 2929 | 3579 | – |
| Wang K | 2011 | USA | US replication | N.A | Illumina Human610 | 190/1507 | – | – | – | 209 | 171 | – | – | – | 1356 | 1658 | – |
| Wang K | 2011 | USA | UK replication | N.A | TaqMan | 253/845 | – | – | – | 258 | 248 | – | – | – | 761 | 930 | – |
| Wang K | 2011 | USA | Italian replication | N.A | TaqMan | 181/491 | – | – | – | 163 | 199 | – | – | – | 412 | 570 | – |
| Zhang J | 2017 | China | Asian | HB | TaqMan | 374/812 | 145 | 185 | 44 | 475 | 273 | 282 | 380 | 150 | 944 | 680 | 0.271 |
| rs10840002 | AA | AG | GG | A | G | AA | AG | GG | A | G | |||||||
| He J | 2016 | China | Asian | HB | TaqMan | 256/531 | 90 | 124 | 42 | 304 | 208 | 182 | 240 | 109 | 604 | 458 | 0.070 |
| He L | 2018 | China | Asian | HB | TaqMan | 313/762 | 120 | 128 | 65 | 368 | 258 | 240 | 375 | 147 | 855 | 669 | 0.981 |
| Latorre V | 2012 | USA | African American | HB | Illumina HumanHap 550 | 365/2491 | 204 | 128 | 33 | 536 | 194 | 1430 | 897 | 164 | 3757 | 1225 | 0.148 |
| Lu J | 2015 | China | Asian | HB | MassARRAY iPLEX | 244/305 | – | – | – | 317 | 171 | – | – | – | 342 | 268 | – |
| Wang K | 2011 | USA | Discovery | N.A | Illumina HumanHap550 | 1627/3254 | – | – | – | 1367 | 1887 | – | – | – | 2408 | 4100 | – |
| Wang K | 2011 | USA | US replication | N.A | Illumina Human610 | 190/1507 | – | – | – | 167 | 213 | – | – | – | 1145 | 1869 | – |
| Wang K | 2011 | USA | UK replication | N.A | TaqMan | 253/845 | – | – | – | 187 | 319 | – | – | – | 608 | 1082 | – |
| Zhang J | 2017 | China | Asian | HB | TaqMan | 374/812 | 132 | 186 | 56 | 450 | 298 | 260 | 384 | 168 | 904 | 720 | 0.233 |
| rs204938 | AA | AG | GG | A | G | AA | AG | GG | A | G | |||||||
| He J | 2016 | China | Asian | HB | TaqMan | 256/531 | 164 | 83 | 9 | 411 | 101 | 354 | 165 | 12 | 873 | 189 | 0.153 |
| He L | 2018 | China | Asian | HB | TaqMan | 313/762 | 200 | 97 | 16 | 497 | 129 | 476 | 258 | 28 | 1210 | 314 | 0.336 |
| Latorre V | 2012 | USA | African American | HB | Illumina HumanHap 550 | 365/2490 | 42 | 162 | 161 | 246 | 484 | 241 | 1040 | 1209 | 1522 | 3458 | 0.426 |
| Lu J | 2015 | China | Asian | HB | MassARRAY iPLEX | 244/305 | – | – | – | 359 | 129 | – | – | – | 489 | 121 | – |
| Wang K | 2011 | USA | Discovery | N.A | Illumina HumanHap550 | 1627/3254 | – | – | – | 1660 | 1594 | – | – | – | 3644 | 2864 | – |
| Wang K | 2011 | USA | US replication | N.A | Illumina Human610 | 190/1507 | – | – | – | 190 | 190 | – | – | – | 1658 | 1356 | – |
| Wang K | 2011 | USA | UK replication | N.A | TaqMan | 253/845 | – | – | – | 253 | 253 | – | – | – | 946 | 744 | – |
| Zhang J | 2017 | China | Asian | HB | TaqMan | 374/812 | 241 | 119 | 14 | 601 | 147 | 522 | 262 | 28 | 1306 | 318 | 0.485 |
| rs2168101 | GG | GT | TT | G | T | GG | GT | TT | G | T | |||||||
| He J | 2018 | China | Asian | HB | TaqMan | 373/812 | 245 | 117 | 11 | 607 | 139 | 407 | 342 | 63 | 1156 | 468 | 0.448 |
| He L | 2018 | China | Asian | HB | TaqMan | 313/762 | 214 | 85 | 14 | 513 | 113 | 401 | 310 | 51 | 1112 | 412 | 0.389 |
| Oldridge DA | 2015 | USA | European American | N.A | Illumina HumanHap550 | – | – | – | – | 3185 | 1017 | – | – | – | 5774 | 2630 | – |
2.3 Statistical analysis
All analyses were performed using STATA 14.1 (Stata Corporation). Departure from Hardy-Weinberg equilibrium (HWE) in controls was examined by the χ2 test. The strength of the association between LMO1 polymorphisms and NB risk was assessed by pooled odds ratios (ORs) and their 95% confidence intervals (CIs). The Z-test was implemented to establish the statistical significance of the pooled ORs. We estimated the between-study heterogeneity by the Q-test and I2-test, with P < .10 indicating the presence of heterogeneity. In case of heterogeneity, a random-effect model was used; otherwise, a fixed-effect model was employed.
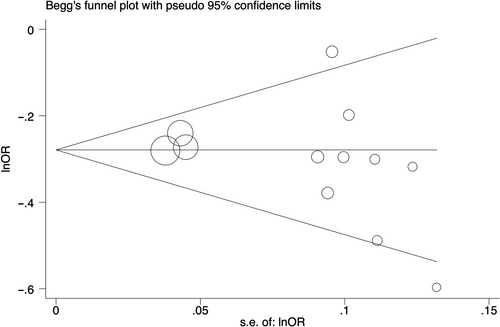
We determined publication bias using funnel plots for visual inspection and by conducting quantitative estimations using the Egger's test. Sensitivity analyses were carried out by sequentially ignoring a single study at a time to assess the impact of individual data sets on the pooled ORs.
3 RESULTS
3.1 Study characteristics
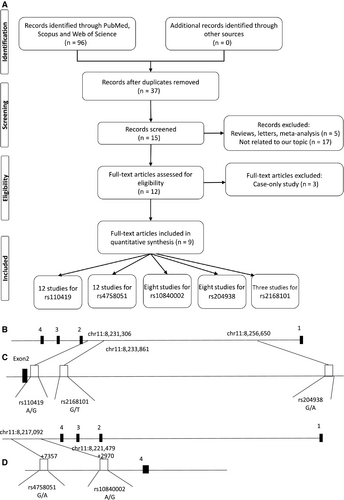
Figure 1A shows a flow chart of the study selection procedure. Ultimately, 9 published articles14, 20, 27-33 that met our inclusion criteria were identified: 12 case-control studies on rs110419 and rs4758051 polymorphisms, 8 studies on rs10840002 and rs204938 polymorphisms, and three studies on the rs2168101polymorphism were also included in our meta-analysis. The Figure 1B-D illustrates the position of the analysed polymorphisms within the LMO1 gene. The articles were published between 2011 and 2018, and they include representatives of major ethnic groups (Caucasians, European Americans, African Americans and Asians). The main characteristics of these studies are listed in Table 1.
3.1.1 Association of rs110419 polymorphism and neuroblastoma risk
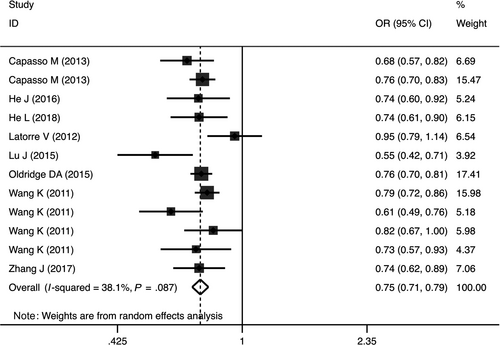
Quantitative analysis revealed that the rs110419 variant markedly decreased the risk of NB in heterozygous (OR = 0.72, 95%CI = 0.65-0.79, P < .00001, AG vs AA), homozygous (OR = 0.59, 95%CI = 0.52-0.67, P < .00001, GG vs AA), dominant, (OR = 0.68, 95%CI = 0.59-0.78, P < .00001, AG + GG vs AA), recessive (OR = 0.73, 95%CI = 0.66-0.82, P < .00001, GG vs AG + AA) and allele (OR = 0.75, 95%CI = 0.71-0.79, P < .00001, G vs A) genetic models (Table 2, Figure 2).
| Polymorphism | No. | Genetic model | Test of association | Heterogeneity (I2 (%), P) | Egger's test | ||||
|---|---|---|---|---|---|---|---|---|---|
| OR (95%CI) | Z | P | χ 2 | I2 (%) | P | P | |||
| rs110419 | 6 | AG vs AA | 0.72 (0.65-0.79) | 6.77 | <.00001 | 8.15 | 39 | .15 | .643 |
| 6 | GG vs AA | 0.59 (0.52-0.67) | 8.09 | <.00001 | 4.03 | 0 | .55 | .565 | |
| 6 | AG + GG vs AA | 0.68 (0.59-0.78) | 5.29 | <.00001 | 10.65 | 53 | .06 | .772 | |
| 6 | GG vs AG + AA | 0.73 (0.66-0.82) | 5.51 | <.00001 | 1.66 | 0 | .89 | .411 | |
| 12 | G vs A | 0.75 (0.71-0.79) | 10.14 | <.00001 | 17.78 | 38 | .09 | .293 | |
| rs4758051 | 6 | AG vs GG | 0.85 (0.71-1.01) | 1.85 | .06 | 13.56 | 63 | .02 | .487 |
| 6 | AA vs GG | 0.76 (0.61-0.96) | 2.32 | .02 | 12.36 | 60 | .03 | .207 | |
| 6 | AG + AA vs GG | 0.83 (0.70-0.99) | 2.08 | .04 | 15.62 | 68 | .008 | .363 | |
| 6 | AA vs AG + GG | 0.86 (0.70-1.06) | 1.38 | .17 | 13.51 | 63 | .02 | .612 | |
| 12 | A vs G | 0.86 (0.75-0.99) | 2.13 | .03 | 121.1 | 91 | <.00001 | .245 | |
| rs10840002 | 4 | AG vs AA | 0.92 (0.80-1.05) | 1.24 | .22 | 9.98 | 40 | .17 | .764 |
| 4 | GG vs AA | 0.89 (0.65-1.23) | 0.71 | .48 | 8.04 | 63 | .05 | .750 | |
| 4 | AG + GG vs AA | 0.91 (0.80-1.04) | 1.35 | .18 | 4.38 | 32 | .22 | .506 | |
| 4 | GG vs AG + AA | 0.94 (0.68-1.30) | 0.37 | .71 | 9.98 | 70 | .02 | .724 | |
| 8 | G vs A | 0.87 (0.79-0.95) | 3.00 | .003 | 15.31 | 54 | .03 | .587 | |
| rs204938 | 4 | AG vs AA | 0.96 (0.83-1.12) | 0.48 | .63 | 0.97 | 0 | .81 | .922 |
| 4 | GG vs AA | 0.97 (0.74-1.28) | 0.21 | .83 | 4.11 | 27 | .25 | .044 | |
| 4 | AG + GG vs AA | 0.97 (0.84-1.13) | 0.36 | .72 | 1.76 | 0 | .62 | .685 | |
| 4 | GG vs AG + AA | 0.92 (0.76-1.12) | 0.79 | .43 | 4.20 | 28 | .24 | .046 | |
| 8 | G vs A | 1.13 (1.00-1.26) | 2.03 | .04 | 20.15 | 65 | .005 | .635 | |
| rs2168101 | 2 | GT vs GG | 0.54 (0.45-0.66) | 6.13 | <.00001 | 0.25 | 0 | .61 | – |
| 2 | TT vs GG | 0.39 (0.25-0.60) | 4.17 | <.00001 | 1.56 | 36 | .21 | – | |
| 2 | GT + TT vs GG | 0.52 (0.43-0.63) | 6.84 | <.00001 | 0.01 | 0 | .91 | – | |
| 2 | TT vs GT + GG | 0.48 (0.31-0.75) | 3.21 | .001 | 1.70 | 41 | .19 | ||
| 3 | G vs T | 0.64 (0.55-0.74) | 5.96 | <.00001 | 4.54 | 56 | .10 | – | |
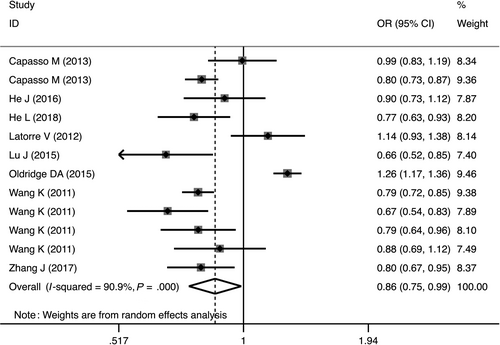
The rs4758051 variant markedly decreased the risk of NB in homozygous (OR = 0.76, 95%CI = 0.61-0.96, P = .02, AA vs GG), dominant (OR = 0.68, 95%CI = 0.59-0.78, P = .04, AG + GG vs AA) and allele (OR = 0.86, 95%CI = 0.75-0.99, P = .03, A vs G) genetic models (Table 2, Figure 3). Similar findings were true for the rs10840002 variant, but only in the allele genetic model OR = 0.87, 95%CI = 0.79-0.95, P = .003, G vs A; Table 2). In addition, the rs2168101 polymorphism was associated with decreased risk of NB susceptibility in heterozygous (OR = 0.54, 95%CI = 0.45-0.66, P < .00001, GT vs GG), homozygous (OR = 0.39, 95%CI = 0.25-0.60, P < .00001, TT vs GG), dominant (OR = 0.52, 95%CI = 0.43-0.63, P < .00001, GT + TT vs GG), recessive (OR = 0.48, 95%CI = 0.31-0.75, P = .001, TT vs GT + GG) and allele (OR = 0.64, 95%CI = 0.55-0.74, P < .00001, G vs T) genetic models (Table 2). In contrast to the other polymorphisms evaluated, the results revealed that rs204938 marginally increased the risk of NB in the allele genetic model (OR = 1.13, 95%CI = 1.00-1.26, P = .04, G vs A; Table 2).
3.1.2 Heterogeneity and publication bias
Between-study heterogeneity across studies included into pooled analysis is displayed in Table 2. No evidence of heterogeneity was observed between studies for rs110419 and rs2168101 polymorphisms. For rs4758051; however, heterogeneity was identified in all codominant, dominant, recessive and allele genetic models (Table 2). Regarding rs10840002, no heterogeneity was observed in heterozygous, homozygous and dominant genetic models. No evidence of heterogeneity was found for rs204938 in heterozygous, homozygous, dominant and recessive genetic models (Table 2).
Begg's funnel plots and Egger's tests were performed to estimate the publication bias of the included literature. The Egger's tests revealed no existence of publication bias for all polymorphisms, except rs204938 in homozygous and recessive genetic models (Table 2, Figure 4).
3.1.3 Sensitivity analysis
Sensitivity analysis was conducted to assess the effects of individual studies on the stability of the pooled ORs. With sequential removal of individual study results from the analysis for rs110419, the pooled ORs remained significantly consistent in heterozygous, homozygous, recessive, dominant and allele genetic models (Figure 5). With regards to rs10840002, the ORs remained unchanged in heterozygous and allele genetic models. Lastly, the pooled ORs changed in all genetic models for rs204938 and rs4758051 polymorphisms.

4 DISCUSSION
Genetic susceptibility to NB has led to growing attention of the studies focused on genetic variations. To date, several reports on the potential association between LMO1 polymorphisms and NB development have been published, but the findings were inconsistent. Somehow surprisingly, none of the polymorphisms are in the coding region of the LMO1 gene. Therefore, they do not result in any amino acid change. They seem not to be related to splicing variants either and; therefore, the nature of their association with susceptibility to NB remains elusive. Three polymorphisms: rs110419, rs2168101 and rs204938 are located in the intron 1, while rs4758051 and rs1084000 are in the intergenic region, beyond the last, fourth exon of the LMO1 gene. Hence, the analysed polymorphisms most likely affect regulatory mechanisms within the LMO1 gene.
Our meta-analysis, based on systematically collected studies, aimed to obtain an accurate summary of the estimates of the strength of association between specific LMO1 gene polymorphisms and NB susceptibility, and, to our best knowledge, is the first to do so. We found that rs110419, rs4758051, rs10840002 and rs2168101 polymorphisms were associated with reduced susceptibility to NB, while the rs204938 polymorphism increased the risk of the disease.
He et al30 reported that rs110419, rs10840002, rs4758051 and rs2168101 polymorphisms of the LMO1 gene were associated with a decreased risk of NB in an eastern Chinese subpopulation. In addition, the rs2168101 and rs3750952 polymorphisms were markedly associated with decreased NB susceptibility in children from North and South China.28 Similarly, the LMO1 rs110419 A > G polymorphism was linked to a reduced NB risk in Southern Chinese children.29 A significant association between the rs204926 variant and NB susceptibility has been reported,32 and rs4758051 and rs10840002 polymorphisms were associated with decreased NB.33 Furthermore, a significant association between the rs110419 polymorphism and risk of NB was observed in an Italian population as well as European American children.27 Conversely, no significant associations between LMO1 polymorphisms and NB risk were observed in African Americans.31 While some studies indicate that frequently occurring polymorphisms at the LMO1 locus are strongly connected to susceptibility to developing NB.14 The observed differences in susceptibility, between populations, are likely due to the overall genetic background that modifies the LMO1 prone risk factors.
This meta-analysis has a few limitations that should be considered. First, we have only included studies published in the English language. Second, there was significant heterogeneity among studies. There was also variation in study sample size, populations and ethnicity of participants, (please see Table 1 for details). Third, our findings were obtained with a relatively limited sample size and consequently, our conclusions are preliminary in nature. Fourth, the assessments of gene-gene and gene/environment interactions were not performed despite some data suggest so.
In conclusion, our meta-analysis is the first to provide evidence of an association between specific genetic polymorphisms of the LMO1 gene and susceptibility to NB. Further validation by well-designed studies performed by international multicenter programme (addressing diverse ethnic populations) is needed to conclusively confirm the impact of specific LMOI polymorphisms on NB susceptibility and development. Unfortunately, at present we lack sufficient number of studies (studied populations) to reliably perform such analyses. Nevertheless, the presented analysis offers interesting insight into the analysed polymorphisms, as outlined above.
ACKNOWLEDGEMENTS
The authors would like to thank Science Impact (Winnipeg) for post-editing the manuscript. JS and MJŁ thank you for the support from Polish National Science Centre, grants # 2016/21/B/ST7/02241.
CONFLICT OF INTEREST
The authors declare no conflict of interest. The funders had no role in the design of the study; in the collection, analyses, or interpretation of data; in the writing of the manuscript or in the decision to publish the results.
AUTHOR CONTRIBUTIONS
M. Hashemi, S. Sarabandi, S. Karami, A. Moazeni-Roodi, J. Śmieja: involved in conceptualization, data collection, validation, statistical analysis and manuscript writing (first draft); S. Ghavami and MJ Łos: formally analysed and finalized the manuscript.


