The biogeography of warming tolerance in lizards
Abstract
Aim
Many ectotherms are at risk from climate change as temperatures are increasingly exceeding their thermal limits. Many evaluations of the vulnerability of ectotherms to climate change have relied on statistical metrics derived from coarse-scale climatic data, which may result in misleading predictions. By applying an integrative approach, we investigated geographical correlates of the vulnerability of lizards to climate change.
Location
Globally.
Taxon
Lizards.
Methods
We combined data on lizard thermal physiology and ecology, with high-resolution climate data and biophysical modelling to assess lizards’ vulnerability to climate change. We calculated warming tolerance (difference between their body temperatures and upper thermal limits) and number of hours of activity. We investigated associations between warming tolerance and activity time with latitude, altitude and biome types. We compared our approach with traditional methods to calculate warming tolerance (using solely macroclimatic data).
Results
We found no latitudinal trend in the warming tolerance of lizards calculated from body temperature, but there was a weak negative correlation with altitude. We found associations between hours of activity and latitude and altitude. Desert species showed narrower warming tolerance than tropical and temperate species. Desert species and temperate species had reduced hours of activity when compared to tropical species. When warming tolerance was calculated from macroclimatic data, however, it was positively correlated with latitude and altitude, and species from tropical forested biomes showed narrow warming tolerances.
Main Conclusions
Vulnerability metrics calculated from macroclimatic data can produce divergent outcomes to those observed from fine-scale climatic data. Our work indicates that the ability of desert and temperate lizard species to cope with heat stress by thermoregulating is more constrained than that of tropical species. Integrative assessments of ectotherms' vulnerability to climate change can highlight species and regions that should be prioritised for conservation management.
1 INTRODUCTION
Climate change directly impacts organism ecology and survival (Pecl et al., 2017). Shifts in distributions, alterations in phenology and collapse of biological communities have been documented for species around the globe (Lenoir et al., 2020; Sunday et al., 2012; Urban et al., 2016). This may ultimately lead to population declines and to unprecedentedly high extinction rates (Urban et al., 2016). Although some species may benefit from increasing temperatures, for many ectotherms temperatures in several regions are predicted to exceed their physiological thermal maximum, and consequently affect their ecological activities (e.g. foraging, reproduction) and survival (Sinervo et al., 2010; Sunday et al., 2014). Understanding the vulnerability of ectotherms to climate change is key to mitigating the impacts of rising temperatures on their conservation (Williams et al., 2008).
Vulnerability to warming is commonly estimated using metrics based on the risk of environmental temperatures exceeding physiological thermal traits (Clusella-Trullas et al., 2021; Deutsch et al., 2008; Sunday et al., 2014). For example, the warming tolerance quantifies the difference between the physiological tolerance to heat (critical temperature maximum, CTmax) and environmental temperatures. High warming tolerance thus indicates a low risk of overheating, while low values indicate that animals cannot withstand temperatures only a little higher than those they already experience (Clusella-Trullas et al., 2021; Deutsch et al., 2008). Vulnerability to climate change can also be quantified by the duration of exposure to thermal stresses, for example, proportion of time with temperatures above CTmax (Garcia et al., 2019). If such temperatures prevail for long periods, ectotherms may be forced to stay inactive to avoid overheating (Ceia-Hasse et al., 2014). Decrease in hours of activity, because of overheating risks, has been suggested as a cause of current lizard population declines (Kearney, 2013; Kubisch et al., 2016; Sinervo et al., 2010). Such declines are due to decreased foraging opportunities imposed by constraints in activity, which also reduces reproductive success, and leads to population collapse (Caetano et al., 2020; Kearney, 2013; Pontes-da-Silva et al., 2018; Rezende et al., 2014; Rezende et al., 2020; Sinervo et al., 2010).
Typically, vulnerability metrics such as warming tolerance, or hours of activity, are calculated based on coarse-resolution climatic data, such as temperatures at several kilometres scale (e.g. of a 2 km2 grid) (Clusella-Trullas et al., 2011; Clusella-Trullas et al., 2021; Diamond et al., 2012). However, climatic variables measured at weather stations can differ substantially from the conditions that organisms actually experience (Anderson, White, et al., 2022; Barton et al., 2019; Garcia et al., 2019; Klinges & Scheffers, 2021; Pincebourde & Suppo, 2016; Storlie et al., 2014; Woods et al., 2015). Local factors and processes occurring at spatiotemporal scales that are not captured by coarse climatic indices, such as microclimatic conditions and organismal traits (e.g. behaviour, ecology), determine ectotherm body temperatures (Anderson, White, et al., 2022; Gunderson & Leal, 2012, 2015; Suggitt et al., 2018). Body temperature, not air temperature (especially averaged across coarse climatic data), sets the threshold for activity and survival (Buckley et al., 2013; Gunderson & Leal, 2015; Kearney, 2013; Kearney et al., 2012; Sunday et al., 2014). Ectotherms behaviourally thermoregulate and select different thermal conditions (shade, sun, burrow, hot substrate), which may alter their body temperature offsetting exposure to harmful temperatures (Garcia et al., 2019; Huey et al., 2012; Logan et al., 2013; Paaijmans et al., 2013).
Ecological aspects of ectotherms can affect their body temperatures, and hence their vulnerability to climate change, but these aspects (e.g. activity period, substrate affinity) are barely explored. For example, activity period can greatly impact body temperature (Meiri et al., 2013). Diurnal and nocturnal species experience different thermal conditions. Nocturnal species are naturally exposed to colder temperatures than diurnal species (Autumn et al., 1994; Meiri et al., 2013; Vidan et al., 2017) and may face fewer thermal heating stresses than diurnal species (Chukwuka et al., 2020; Kearney & Predavec, 2000). Additionally, within the same habitat, different substrates will cause animals to experience different conditions (Gunderson & Leal, 2012; Kaspari et al., 2015; Scheffers et al., 2014). Arboreal species will experience conditions and have access to thermal refuges that are not available to terrestrial species (Algar et al., 2018), and vice versa. Microhabitat selection will thus affect exposure to heat stresses and hence vulnerability to hot temperatures (Kearney et al., 2009; Logan et al., 2013). However, investigations targeting the vulnerability of ectotherms to climate change have relied on coarse environmental descriptions, which do not consider thermal variability and key characteristics of the animals (i.e. activity period, behaviour) (e.g. Clusella-Trullas et al., 2011; Diamond et al., 2012). Animals are generally assumed to be exposed constantly to general atmospheric conditions. However, most ectotherms can avoid stressfully hot temperatures (Kearney et al., 2009). This is often the case for nocturnal and fossorial species that are not even exposed to the hottest temperatures of the day, or to direct solar radiation. An approach that captures differences in activity period and substrate affinity is thus necessary to better evaluate the vulnerability of ectotherms to climate change.
Lizards are a group of ectotherms whose thermal physiology, ecology and vulnerability to climate change are well studied (Böhm, Cook, et al., 2016; Böhm, Williams, et al., 2016; Huey et al., 2009; Meiri, 2018). Despite climate change being a significant threat to their persistence (Sinervo et al., 2010), global assessments of their extinction risk have often overlooked some key factors affecting their vulnerability (e.g. behaviour, ecology) (Böhm et al., 2013; Böhm, Williams, et al., 2016; Meiri & Chapple, 2016). Tropical forest lizards and desert lizards have been predicted to be more vulnerable to rising temperatures because they already live in environmental conditions that are close to their thermal limits (Gunderson & Leal, 2012; Pontes-da-Silva et al., 2018; Sinervo et al., 2010). By contrast, species from open tropical habitats, and high latitudes could benefit from warmer temperatures due to the increased thermal quality of their habitats (Diele-Viegas et al., 2018; Logan et al., 2013). This could make them less vulnerable to climate change and benefit them by increasing the activity time (Deutsch et al., 2008). However, such predictions may be inaccurate because behaviour, diel rhythms, thermoregulatory opportunities and microclimatic conditions are seldom explicitly considered in studies of lizard vulnerability to climate change (Huey et al., 2009; Logan et al., 2013). Indeed, Diele-Viegas et al. (2020) recently showed that lizards are similarly vulnerable to climate change regardless of their geographical realm.
Using high-resolution hourly climatic data to simulate body temperatures, while accounting for microclimatic effects and behaviour, we quantified warming tolerance and hours of activity for lizards globally between 1980 and 2019. We gathered thermal physiological and ecological data from the literature to parametrise biophysical models and estimate vulnerability metrics based on predicted body temperatures. We evaluated which habitat characteristics (latitude, altitude and biomes) are associated with vulnerability to warming. We tested whether tropical and desert species, which inhabit hot environments with temperatures close to their thermal limits (Huey et al., 2009), are more vulnerable to climate change than species from temperate regions. That is, we investigated geographical trends of warming tolerance and hours of activity to assess the risk of lizards incurring detrimental effects derived from heat stress. We also predicted that tropical low elevation species have lower warming tolerance (e.g. Clusella-Trullas et al., 2011; Huey et al., 2009), whereas species from high latitudes, and temperate and desert areas, would show a lower number of hours of activity (Ceia-Hasse et al., 2014; Sinervo et al., 2010). Finally, to compare our approach with traditional methods to assess lizards’ vulnerability to climate change (i.e. using solely macroclimatic data), we also quantified warming tolerance from air temperatures extracted from macroclimatic datasets.
2 MATERIALS AND METHODS
2.1 Data collection
We conducted a literature survey to collect data on the thermal preference and critical thermal limits of lizards. Thermal preference (Tpref) is the body temperatures that an animal selects in a thermal gradient without abiotic and biotic constraints (Huey et al., 2012; Taylor et al., 2021). The critical thermal maximum (CTmax) indicates the body temperatures at which the animal loses its capacity to perform ecological tasks, usually quantified as the onset of spams or loss of righting response (Lutterschmidt & Hutchison, 1997; Taylor et al., 2021).
We built upon the dataset compiled by Clusella-Trullas et al. (2011) and updated it through a literature search for post-2011 studies. We expanded this dataset by searching Google Scholar and Web of Science for the following word combinations: “thermal preference,” “preferred temperature,” “thermoregulatory behaviour,” “selected temperature” and “thermal choice,” and terms: “lizards,” “reptiles,” and “squamate.” We collected data on lizard critical thermal maxima starting from published datasets (Bennett et al., 2018; Diele-Viegas et al., 2018). We then expanded and added studies published after 2018. We also searched the following search engines for the following the terms: “thermal physiology,” “thermal tolerance,” “heat tolerance,” “thermal limits,” “critical temperature,” together with “lizards” and “reptiles.”
We only used thermal physiological data that matched the following criteria: (i) data were from adults to eliminate ontogenetic effects on physiological measurements; (ii) individuals were not submitted to acclimation treatments that lasted more than 3 weeks; (iii) animals were wild-caught; (iv) animals were not exposed to chemical compounds; and (v) animals were not fasting for more than a week before the experiments. If the animals did not meet these criteria, they were not included in our dataset.
If multiple studies reported data for the same species, or if the studies short-acclimated (less than 14 days) the animals to different temperatures (e.g. Corn, 1971), we selected the study or acclimatisation procedure with the highest sample size. If a study reported data separately for males and females, we used the arithmetic mean of the two sexes. If a study reported data for different seasons we selected the data that matched the species' activity period, or if the species is active year-round we selected the season with a higher sample size. For studies that reported the data graphically, or the location as a map image, we use a web-based tool to extract the data from those figures (WebPlotDigitizer 4.1; https://automeris.io/WebPlotDigitizer).
We recorded the locality that the animals were collected from, and the lizards' body mass. If the mass was not reported, we estimated it based on the snout–vent length using allometric equations (Meiri, 2010; Meiri et al., 2013). We classified species activity periods (diurnal, cathemeral and nocturnal) and substrate preferences (e.g. arboreal, terrestrial) following Meiri (2018). Taxonomy follows the Reptile Database (Uetz et al., 2020). We assigned the biome (according to Olson et al., 2001) each species originated from using ArcGIS 10.8, and the coordinates of the place it was captured/observed in.
2.2 Microclimatic and biophysical modelling
We used microclimatic modelling (‘NicheMapR’ 3.1.0; Kearney & Porter, 2020) to simulate the microclimatic conditions of the lizards in our datasets (as standardisation, we used the coordinates extracted from studies that quantified CTmax). From microclimatic inputs, biophysical modelling was used to simulate the physiological states of ectotherms in their habitat and then compute body temperatures and number of activity hours.
2.3 Microclimatic modelling
‘NicheMapR’ includes a microclimate model (function micro_ncep) that integrates historical 6-hourly macro-climatic datasets from the National Center for Environmental Predictions and terrain adjustments (Kearney et al., 2020). The function micro_ncep is connected to the package ‘microclima’ 2.0.0 (Maclean et al., 2018), which models the mechanistic processes that govern fine-scale variation in temperature, arising from variations in radiation, wind speed, altitude, surface albedo, cold air drainage, as well topographic and vegetation effects on wind speed and radiation (i.e. downscale the climatic data). As a result, the micro_ncep function generates a time series of microclimatic variables of air temperature, humidity, wind speed, soil temperature, soil moisture and radiation conditions. By accounting for topographic effects (amount of shade via terrain slope) in association with the package ‘elevatr’ 0.4.2 (Hollister et al., 2021), which is connected to the Amazon Web Services Open Data, ‘NicheMapR’ can produce data of near-surface temperatures.
We ran the micro_ncep function to simulate microclimatic conditions with locally estimated slope and aspect, with the soil moisture routine turned on (Kearney & Maino, 2018) and with soil properties drawn from the SoilGrids dataset (Hengl et al., 2017). Simulations were run from 1980 to 2019 (350, 640 h = 14,610 days). We set a 30-m resolution for the terrain corrections extracted from the digital elevation data. We set the minimum amount of shade as 0% and a maximum of 90%, assuming that every lizard will have the opportunity to access shady refuges (see below). Simulations ran at reference heights of 1 cm above the ground for terrestrial and saxicolous species and at 1.5 m for exclusively arboreal species (see details below). This allowed us to simulate more accurately species-specific conditions related to interspecific differences in microclimates due to microhabitat preference (Algar et al., 2018; Anderson, White, et al., 2022). To model microclimatic conditions, many site-specific variables are unavailable. We thus used default settings for other microclimatic parameters in ‘NicheMapR’.
2.4 Biophysical modelling
We simulated the energetic and mass balance of lizards with thermoregulatory behaviour using the ectotherm function in ‘NicheMapR’ (Kearney & Porter, 2020). We controlled thermoregulatory behaviour by parametrizing the models with thermal physiological and ecological data collected from the literature (Kearney & Porter, 2020). The ectotherm model can produce highly accurate predictions of body temperature and activity period for lizards, and this approach has been applied in several instances (Anderson, White, et al., 2022; Kearney, 2013; Sunday et al., 2014).
Models were parametrised using species-specific data of body masses, thermal physiology (thermal preference and upper thermal limits), activity periods and substrate affinity, to estimate hourly body temperatures and hours of activity. All species modelled were allowed to seek shade to thermoregulate (parameter seek_shade = 1) by selecting conditions ranging from the full sun (i.e. 0% of shade) to full shade conditions (i.e. 90% of shade). Exclusively arboreal species were allowed to climb trees (parameter climb), but not to burrow (parameter burrow). Non-exclusively arboreal species were allowed to burrow and climb. Terrestrial, saxicolous and fossorial species were allowed to burrow, but not climb trees, to thermoregulate. We calculated active body temperatures of nocturnal lizards for nighttime periods, and diurnal species for daytime temperatures. Crepuscular species had their body temperatures calculated for nighttime periods, as they are unlikely to be active during the day.
We used preferred temperatures collected from the literature to set the thermal preference of the models. The simulated lizards attempted to maintain their body temperature at preferred levels by shuttling between shady and open conditions, burrowing, or climbing trees. At the beginning of their activity period, the lizards emerged from their retreats to thermoregulate and seek to maintain optimum temperatures (i.e. keep body temperature within preferred conditions). The parameters T_F_min and T_F_max control the body temperatures at which the animals will start activity (e.g. foraging) and cease it, respectively. We set these parameters as the thermal preference range (mean minimum and maximum) reported across individuals in the studies recorded for Tpref. If the studies did not report the preferred range, we set these parameters as two times the standard deviation (SD) of Tpref (i.e. T_F_min = −2 × SD, T_F_max = +2 × SD). If SD was not available, we calculated it from the standard error and sample size. For 4 of 90 species, these statistics were unavailable. We set SD for them as 1.95°C, the mean of SD across the 86 species with data. In all, 53 species (58.8%) had their Tpref range estimated. The parameters that control for leaving retreat and basking (T_RB_min and T_B_min) were set as for T_F_min. Hence, our model implicitly assumes that as soon as the animals emerge from their retreats they are already active. Finally, we used the CTmax extracted from the literature to set the upper thermal limit of the models. For details about the parametrisation (Table S1). In sum, we simulated lizards emerging from their retreat according to their activity period (e.g. diurnal) at temperatures that allow activity (Kearney, 2013; Sinervo et al., 2010). The thermoregulatory repertoire depended on their substrate affinity and the temperatures for starting/ceasing activity were contingent on their thermal physiology.
2.5 Vulnerability metrics
From the output of the biophysical modelling, ‘NicheMapR’ provided hourly body temperatures and the number of hours of activity. We used warming tolerance as a measure of thermal stress. We view warming tolerance as highly conservative as it is defined as temperatures above maximum critical temperatures, that is, temperatures above which organisms cannot function (Clusella-Trullas et al., 2021). Even at temperatures below CTmax, but close to them (i.e. above thermal optima but below the maxima), organismal function is hindered and hence indicate a risk of overheating. To avoid misestimations due to computed body temperatures of non-active lizards (i.e. when the lizards are sheltered and not exposed to heat stress), we calculated warming tolerance only for body temperatures during activity. Warming tolerance was calculated as the difference between CTmax and hourly body temperature, which means that values close to zero indicate lizards are near to reaching their thermal limits. For comparative purposes, warming tolerance was yearly averaged, totalising 40 observations of warming tolerance for each species (from 1980 to 2019).
Hours of activity can be defined as the time the animals spend during their ecological activities (e.g. foraging). We extracted the yearly hours of activity as the sum of the total number of hours the animals were modelled to be active per year. Hours of activity was a function of the thermal physiology (i.e. parameters in the model) and microclimatic conditions. Additionally, hours of activity were computed according to the lizard's activity period (i.e. temperatures are daytime for diurnal lizards, and nighttime for nocturnal). These data were retrieved from the model output which indicate the number of hours that microclimatic conditions, and hence the body temperature of the lizards, are suitable for activity without heat stress.
To compare the warming tolerances calculated from lizards’ body temperatures and from macroclimate data (i.e. without transformation), we also calculated warming tolerance as the difference between CTmax and hourly air temperatures extracted from the NCEP data. We averaged warming tolerance per year, totalising 40 observations of the warming tolerance for each species (from 1980 to 2019). This is the traditional approach to measure ectotherm vulnerability to warming and it has been widely used (e.g. Clusella-Trullas et al., 2011).
2.6 Phylogenetic analyses
We evaluated geographical trends in the warming tolerance and number of hours of activity of lizards using Phylogenetic General Mixed Effect Models (PGLMM) in ‘phyr’ R package 1.0.3 (Li et al., 2020). We pruned the phylogenetic tree of Zheng and Wiens (2016) to account for the covariance among species in our models. Caparaoni itaiquara, Egernia striolata, Loxopholis osvaldoi, Loxopholis percarinatum and Phymaturus zapalensis were not present in the phylogenetic tree and were then excluded from the analyses. Additionally, Phrynocephalus vlangalii was not included in the analyses because the body temperatures predicted for this species were extreme (e.g. mean body temperature of 2°C), which was likely due to the cold conditions of high-altitude mountains in temperature regions (Wu et al., 2018).
We used PGLMM to test whether warming tolerance (both estimated from body temperature and macroclimatic data) and hours of activity (log-transformed) were associated with the geographical position (log-transformed altitude, and absolute latitude as fixed effects) of the species. To account for the repeated measures across years, we set the year that warming tolerance or hours of activity were calculated as a random factor in our models.
Warming tolerance and activity hours may have been influenced by the Tpref data used to parametrise the biophysical models (measured vs. estimated). We compared the estimated and measured warming tolerance and activity hours and found no significant differences (PGLMM Z score = −1.173, p = 0.082) in warming tolerance (measured: mean = 11.7°C, SD = 3.29; estimated: mean = 11.5°C, SD = 3.06). However, activity hours were higher for measured (mean = 2750 h, SD = 1539) than for estimated Tpref range (mean = 1813, SD = 1395; PGLMM Z score = −18.173, p < 0.001). Moreover, for measured Tpref range, warming tolerance and activity hours were correlated (R2 = 0.280, t = 10.452, df = 1278, p-value <0.001), but not for species with estimated Tpref range (R2 = 0.027; t = 1.2323, df = 2078, p-value = 0.218). Hence, to account for potential biases in our results, we included how thermal preference range was calculated (estimated or measured) as a covariate in the PGLMM models. Finally, we tested for interactions between thermal preference types (estimated or measured) with latitude and altitude. As no interactions were statistically significant (p > 0.1 for all models), interactions were not included in the final models.
We evaluated whether warming tolerance and hours of activity are associated with biomes using PGLMM. Biomes were treated as fixed factors and year as a random factor. Biomes with five or fewer species were not considered in the analyses (Montane Grasslands & Shrublands, Temperate Conifer Forests, n = 2; Temperate Grasslands, Savannas & Shrublands, n = 2; Tropical and Subtropical Coniferous Forests, n = 3; and Tropical and Subtropical Dry Broadleaf Forests, n = 5).
Finally, we evaluated how the warming tolerance estimated from macroclimatic data is associated with latitude, altitude and biome using PGLMM as described above. We calculated R2 for PGLMM models using the package ‘rr2’ 1.0.2 (Ives, 2019).
3 RESULTS
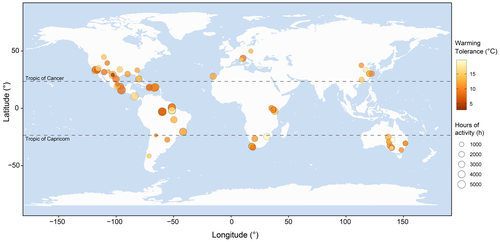
We considered the 84 species in the phylogenetic tree in the analyses (Figure 1). The mean yearly warming tolerance was 11.57°C (range: 2.96–19.65), that is, species could warm by 11.57°C on average before reaching their upper critical temperature. The mean yearly hours of activity was 2169.02 h (range: 158.05–7073.65), and the mean predicted body temperature was 29.81°C (range: 18.21–37.91).
3.1 Warming tolerance and activity hours calculated from modelled body temperatures
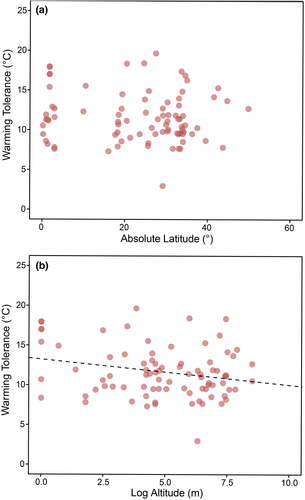
We found no associations of warming tolerance with absolute latitude (PGLMM coefficient: −0.019 ± 0.025 SE, Z = −0.773, p = 0.439; partial R2 = 0.013; Figure 2a). However, we found that warming tolerance correlated negatively with altitude (PGLMM coefficient: −0.350 ± 0.152 SE, Z = −2.301, p = 0.021; partial R2 = 0.062; Figure 2b). The covariate Year explained very little variation (0.006 ± 0.077% of variance), and the full model R2 was 0.995. The way thermal preference range was calculated had no significant effects on the model (PGLMM coefficient: 0.424 ± 0.722 SE, Z = 0.587, p = 0.556).
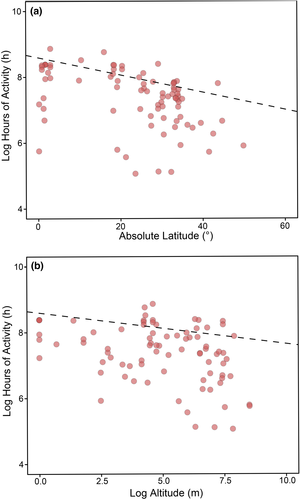
Species from low latitudes and altitudes exhibited more hours of activity than species from high latitudes and altitudes (PGLMM coefficient: −0.026 ± 0.007 SE, Z = −3.525, p < 0.001, partial R2 = 0.188 for latitude; −0.09 ± 0.04 SE, Z = −2.31, p = 0.020, partial R2 = 0.139 for altitude; Figure 3). The way thermal preference range was calculated had no significant effects on the model (PGLMM coefficient: −0.208 ± 0.191 SE, Z = −1.087, p = 0.276). The full model R2 was 0.994.
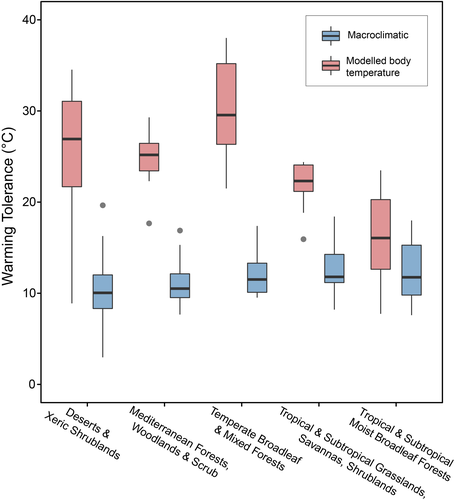
The PGLMM model showed differences in the warming tolerance among biomes (full model R2 = 0.95; partial R2 = 0.086). Deserts and Xeric Shrublands species showed lower warming tolerance (PGLMM intercept: 10.383 ± 0.959 SE, Z = 10.820, p < 0.001; n = 15) than Tropical and Subtropical Grasslands, Savannas and Shrublands (coefficient: 2.749 ± 1.402 SE, Z = 1.945, p = 0.051; n = 8), and Tropical and Subtropical Moist Broadleaf Forests (PGLMM coefficient: 2.262 ± 1.062 SE, Z = 2.129, p = 0.033; n = 22). However, Mediterranean Forests, Woodlands and Scrub (PGLMM coefficient: 0.459 ± 1.120 SE, Z = 0.409, p = 0.681; n = 16) and Temperate Broadleaf and Mixed Forests (PGLMM coefficient: 1.323 ± 1.265 SE, Z = 1.046, p = 0.295; n = 10) showed similar warming tolerances to species desert species. There was no significant effect of the way Tpref range was estimated (PGLMM coefficient: −0.031 ± 0.740 SE, Z = −0.042, p = 0.966).
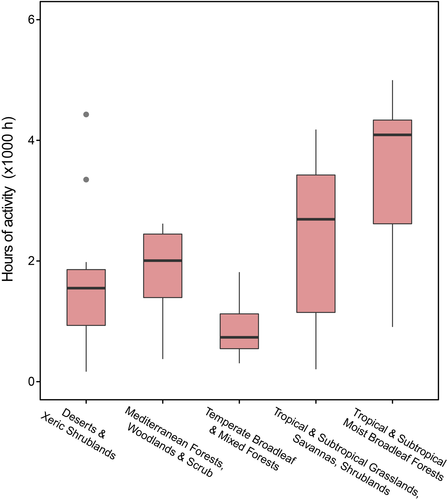
The PGLMM model showed differences in the activity hours among biomes (full model R2 = 0.945; partial R2 = 0.353; Figure 4). Deserts and Xeric Shrublands species showed lower activity hours (PGLMM intercept: 7.277 ± 0.222 SE, Z = 32.706, p < 0.001) than Tropical and Subtropical Moist Broadleaf Forests (coefficient: 0898 ± 0.223 SE, Z = 4.012, p = 0.047) and Tropical and Subtropical Grasslands, Savannas and Shrublands (PGLMM coefficient: 0.0732 ± 0.300 SE, Z = 2.438, p < 0.001). Mediterranean Forests, Woodlands & Scrub (PGLMM coefficient: 0.215 ± 0.248 SE, Z = 0.867, p = 0.385) and Temperate Broadleaf and Mixed Forests (PGLMM coefficient: −0.445 ± 0.278 SE, Z = −1.601, p = 0.109) showed similar warming tolerances to species desert species. There was no significant effect of the Tpref range estimation (PGLMM coefficient: −0.259 ± 0.169 SE, Z = −1.536, p = 0.124).
3.2 Warming tolerance calculated from macroclimatic data
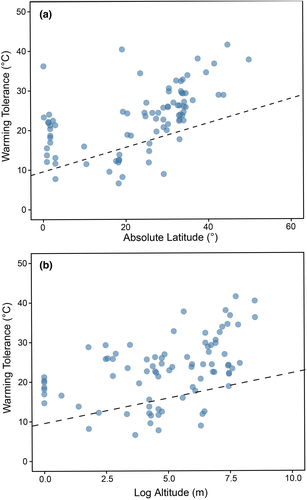
We also evaluated geographical trends in the warming tolerance of lizards when this metric is calculated from macroclimatic data (Figure 5). We found that the warming tolerance calculated from macroclimatic data was positively affected by latitude and altitude. Species from high latitudes (PGLMM coefficient: 0.317 ± 0.051 SE, Z = 6.105, p < 0.001; partial R2 = 0.320) and higher altitudes (PGLMM coefficient: 1.409 ± 0.296 SE, Z = 4.752, p < 0.001; partial R2 = 0.228) tend to have higher warming tolerances.
Warming tolerance calculated from macroclimate data differed among biomes (Figure 6). Deserts and Xeric Shrublands species showed higher warming tolerance (PGLMM intercept: 26.146 ± 1.177 SE, Z = 22.203, p < 0.001) than Temperate Broadleaf and Mixed Forests (coefficient: 4.138 ± 1.860 SE, Z = 2.224, p = 0.026), Tropical and Subtropical Grasslands, Savannas and Shrublands (PGLMM coefficient: −4.398 ± 0.995 SE, Z = −2.204, p = 0.027) and Tropical and Subtropical Moist Broadleaf Forests (PGLMM coefficient: −10.268 ± 1.525 SE, Z = −6.729, p < 0.001). Mediterranean Forests, Woodlands and Scrub (PGLMM coefficient: −1.175 ± 1.637 SE, Z = −0.714, p = 0.474) had similar warming tolerances to desert species.
4 DISCUSSION
By integrating thermal physiology and ecology to predict the body temperature of lizards, we calculated key vulnerability metrics to climate change during current climatic scenarios (i.e. from 1980 to 2019). We observed a weak altitudinal trend, and no effect of latitude on warming tolerance. Additionally, hours of activity were negatively correlated with altitude and latitude. We found evidence for the idea that warming tolerance and activity hours differ among species from different biomes. Species from Mediterranean, temperate and especially desert biomes are likely to be more vulnerable to climate change than tropical and subtropical forested species. These patterns contradict analyses using macroclimatic data (i.e. warming tolerance calculated from air temperatures), which do not incorporate key microclimatic and ecological aspects that affect body temperature.
First, we highlight that our body temperatures estimation depended on the microclimatic conditions modelled. As the microclimatic data required to accurately model the habitat at a local scale are very specific (e.g. soil type, reflectance, albedo), and are not available at global scales, we had to use default parameters in the microclimatic modelling. Moreover, macrophysiological analyses involving climatic modelling are sensitive to the macroclimate data used as input (Anderson, White, et al., 2022); hence, results using different macroclimatic data may have divergent outcomes. Finally, we had to estimate the thermal preference range to parametrise our models. This may under or overestimate the activity window of the lizards, as these parameters control when the animals can thermoregulate (Kearney & Porter, 2020). Our results, therefore, have to be interpreted with care. As more detailed thermal physiological (e.g. voluntary thermal maximum) and microclimatic data become available, our approach can be updated to provide stronger and broader inferences.
One striking finding from our study was that we did not find latitudinal trends in the warming tolerance of lizards calculate from modelled body temperatures. These results contradicted previous studies (and our macroclimatic analyses) using coarse climatic data that found tropical species to be more vulnerable and perhaps already experiencing body temperatures beyond their upper thermal limits (Clusella-Trullas et al., 2011; Diamond et al., 2012; Huey et al., 2009). These contradictory results reveal nuances derived from macroclimatic perspectives (Anderson, White, et al., 2022; Logan et al., 2013; Sears et al., 2011; Vasseur et al., 2014). Macroclimatic variables are usually measured at heights, or conditions, that are irrelevant for many animals (Kearney & Porter, 2009; Kearney et al., 2012; Klinges & Scheffers, 2021). The geographical patterns observed for warming tolerance calculated from macroclimate data are driven by increments in the difference between thermal maximums and cold temperatures at high latitudes and altitudes. However, the patterns observed for warming tolerance calculated from body temperatures maybe be related to microclimatic conditions and to lizards’ aspects. At microclimatic conditions, air temperatures at the ground level can be warmer than temperatures measured higher above the ground (Klinges & Scheffers, 2021), owing to solar radiation that is not captured by air temperature measurements. Ultimately, the body temperature of ectotherms will differ from air temperatures at macroclimatic scales (Kearney et al., 2012). Hence, calculating warming tolerances from macroclimatic data can produce different outcomes to predictions using fine-scale methods (Suggitt et al., 2018; Sunday et al., 2014).
We found geographical trends in hours of activity and warming tolerance. We found that high-latitude species have fewer hours of activity when compared to tropical species. We also found that species from high elevations have more restricted activity hours (Kubisch et al., 2016), and exhibited a weak tendency to have lower warming tolerances than lowland species. In current climatic scenarios, these patterns might be caused by cold temperatures, which drive limited thermoregulatory opportunities, and sometimes increased body temperatures, at highlands and high latitudes (Anderson, Alton, et al., 2022; Domínguez-Godoy et al., 2020; Hertz et al., 1993; Kubisch et al., 2016; Vickers et al., 2011; Wu et al., 2018). Lizards in these environments (highlands and temperate zones) exhibited reduced hours of activity when compared to lowland and tropical species (Kubisch et al., 2016). Future air temperatures, however, will likely increase, which will allow lizards in cold regions to increase their hours of activity (Gunderson & Leal, 2015; Kearney, 2013). Investigating how climate change scenarios will affect the activity of high-latitude and high elevation lizards is an interesting topic for future studies.
By comparing vulnerability to climate change across biomes, we found that desert, Mediterranean and some temperate species have narrower warming tolerance and fewer activity hours compared to tropical and subtropical species (Diele-Viegas et al., 2020; Gerick et al., 2014; Vasseur et al., 2014). In temperate regions (i.e. high latitudes), activity is seasonally constrained and the reduced hours of activity can be related to summer temperatures, whereas during the winter temperatures are too cold and lizards are inactive (Anderson, Alton, et al., 2022; Domínguez-Guerrero et al., 2021). In desert regions, hot temperatures throughout the day can preclude lizards from performing ecological activities (Ceia-Hasse et al., 2014). As desert habitats have less available shade than in other biomes, desert species cannot as readily shift between shaded patches to control their body temperatures and avoid heat stress (Grant, 1990; Huey & Pianka, 1977; Huey & Slatkin, 1976; Pianka & Huey, 1978). As a result, desert species will have less time to be active and have narrower differences between realised body temperatures and upper thermal limits (Sinervo et al., 2010).
In contrast to desert and temperate species, tropical and subtropical species appeared to be thermally safer than previous thought (Diamond et al., 2012; Huey et al., 2009). Tropical and subtropical forested biomes provide a rich mosaic of shady patches and shelters; hence, species can actively select thermal refuges to avoid heat stress (Logan et al., 2013). Shelter availability when temperatures are too hot (Kearney et al., 2009; Scheffers et al., 2014), and the movement between shade patches (which is largely available in tropical forests), may allow extended time for activity (Caetano et al., 2020; Gunderson & Leal, 2012; Sears et al., 2016). However, for forested-region species, a reduction in vegetation cover might increase exposure to temperatures that exceed their (low) thermal optima and maxima (Laurent et al., 2020; Tuff, Tuff, & Davies, 2016). This signalises the high dependence of forested species on vegetation cover to avoid heat stress (Caetano et al., 2020; Logan et al., 2013; Pontes-da-Silva et al., 2018).
Our approach is based on thermal traits estimated for a single population per species, assuming no intraspecific variation in their thermal phenotypes. Intraspecific variation in CTmax, however, can be substantial (Duffy et al., 2021; Herrando-Pérez et al., 2019; Herrando-Pérez et al., 2020). As recently demonstrated for Iberian lizards, for example, such variation can range up to 3°C (Herrando-Pérez et al., 2019; Herrando-Pérez et al., 2020), a factor among many others (e.g. sample size, geographical bias, plasticity) that can cause our predictions to either over- or underestimate true conditions (Duffy et al., 2021; Gunderson & Stillman, 2015; Seebacher et al., 2015; White et al., 2021). Thus, our results should not be generalised to all populations of a species, since thermal physiology and microclimatic conditions vary across geographical ranges.
Our study shows that the patterns of vulnerability to climate change from metrics calculated from macroclimatic data (i.e. temperatures at weather station scales) differ from those observed for metrics estimated from microclimatic data. As our modelling approach integrated some key processes that presumable make estimation more realistic, such as ecology and thermal physiology, we could capture processes occurring at local scales that influence body temperature. We showed that hot temperatures are a potential threat to lizards worldwide and our findings highlight that taxa from different types of environments might face the detrimental effects of warming. The extent to which ectotherms can be buffered from overheating in future climatic scenarios remains to be further explored.
ACKNOWLEDGEMENTS
We thank to Marco Camaiti, Sergio Nolazco, Laura Avellaneda, Ettore Carmelenghi and Mike Kearney for comments in early drafts of the manuscript. Funding was provided by the Australian Research Council (FT200100108 to DGC). Animal ethics approvals and collecting permits were not necessary to conduct this study. Open access publishing facilitated by Monash University, as part of the Wiley - Monash University agreement via the Council of Australian University Librarians.
CONFLICT OF INTEREST
The authors declare no conflict of interest.
Open Research
DATA AVAILABILITY STATEMENT
The R scripts used to conduct the biophysical modelling, the data used to parametrise the models, and the metadata of this study are available in Monash University Bridges data repository (https://doi.org/10.26180/17957864.v2).
REFERENCES
BIOSKETCH
Rodolfo O. Anderson has a background in ecophysiology and is interested in understanding the factors underlying the distribution of ectotherms.
Author Contributions: Rodolfo O. Anderson, Shai Meiri and David G. Chapple designed the study. Rodolfo O. Anderson and Shai Meiri. collected the data. Rodolfo O. Anderson analysed the data. Rodolfo O. Anderson wrote the first version of the manuscript. All authors contributed to and approved the final version.


