Evidence for a second gene for primary microcephaly at MCPH5 on chromosome 1
Abstract
Primary microcephaly has been mapped to five loci on different chromosomes. We present here the fine mapping of one of the loci, MCPH5, to a region of only 0.58 Mb located at the 1q31.3-1q32.1 junction. A genome scan was performed on five families from the Netherlands and Jordania, with 14 patients affected by microcephaly. A maximum LOD score of 4.78 was found for marker D1S1660 at the MCPH5 locus. Haplotype analysis suggests that the gene causing microcephaly is located between markers D1S3469 and D1S1660, which exludes the previously reported ASPM gene.
Microcephaly, defined as a head circumference >3 standard deviations below the age-related mean, can be the result of many different disorders affecting neurodevelopment. Primary microcephaly, or “true microcephaly”, is an autosomal recessive disorder resulting in a markedly reduced cerebral cortex (with a total weight of the brain of typically 430 g compared to 1450 g in unaffected males), but with a relatively well preserved gyral pattern and only mild-to-moderate mental retardation (McCreary et al. 1996).
A region on chromosome 1 was suggested to contain a gene for microcephaly in the early '80s. High-resolution banding techniques were used in the analysis of a microcephalic boy with a reciprocal translocation to pinpoint the region to the 1q31-1q32.1 junction (Perez-Castillo et al. 1984). Modern methods using genome-wide scans and homozygosity mapping with microsatellite markers have confirmed that microcephaly is genetically linked to this region (Jamieson et al. 2000; Pattison et al. 2000) and also identified four additional candidate regions: MCPH1 at 8p22-pter (Jackson et al. 1998), MCPH2 at 19q13 (Roberts et al. 1999), MCPH3 at 9q34 (Moynihan et al. 2000) and MCPH4 at 15q15-q21 (Jamieson et al. 1999). Identifying the genes causing microcephaly will give clues to how the brain is formed during embryogenesis and could also provide evidence as to how the human brain has reached its current size through evolution. The two independent studies mapping microcephaly to 1q31 defined a minimum common region to 7.8 Mb between markers GATA135F02 and D1S1678, a region containing nearly 100 annotated genes. In a recent study, mutations in the ASPM gene located in this region were found to cause microcephaly in four families of Pakistani origin (Bond et al. 2002). A gene for microcephaly has also been identified at the MCPH1 locus (Jackson et al. 2002). Here we present evidence for a second causative gene at the MCPH5 locus, based on haplotype analysis of 14 cases from the Netherlands and Jordania which excludes the ASPM gene.
MATERIAL AND METHODS
Subjects
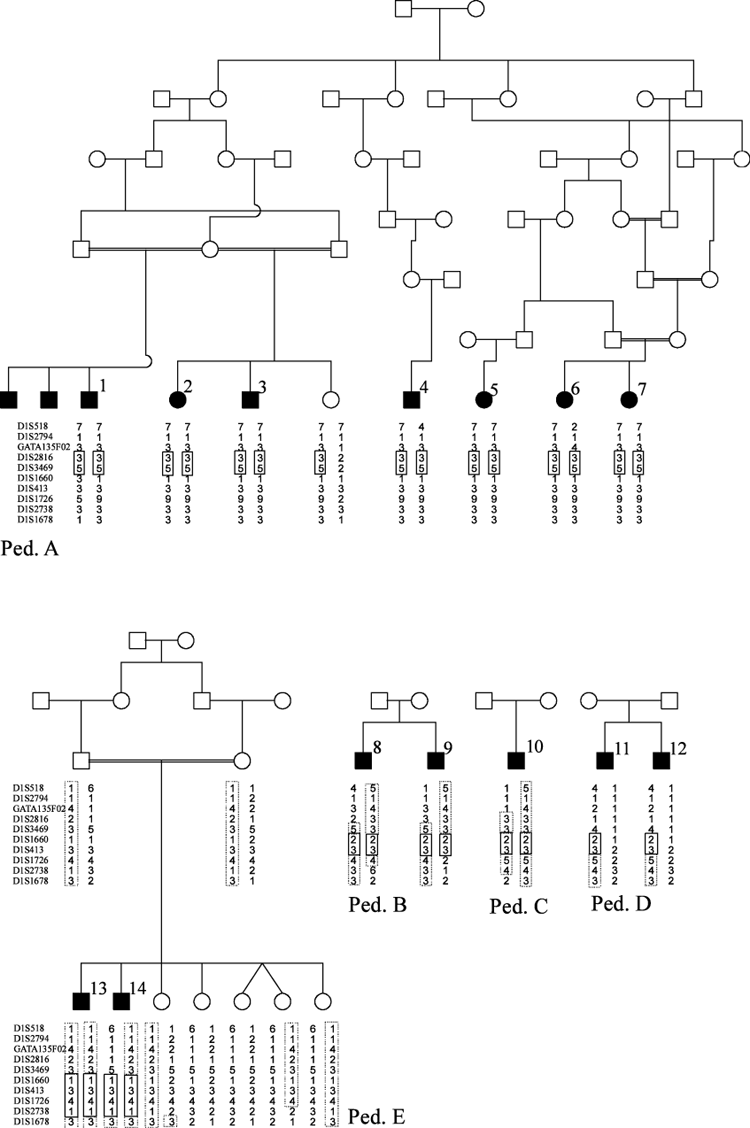
The patients had been diagnosed as affected by primary microcephaly. Subjects 1–7 have common ancestors at the beginning of the 19th century as shown in pedigree A in Fig. 1. Subjects 1–3 are previously described (Bosch 1959, ped. 7). Cases 8–12 belong to three families for which the genealogy is unknown, but most of them originate from the same region in Holland. Patients 13 and 14 are the result of a marriage between two first-cousins from Jordania. The study was approved by the Research Ethics Commitee at Uppsala University (No. 234/90).

Pedigree structure and genotypes for the five families. Identical regions are boxed for each family. In pedigree B-D, possible common haplotypes are indicated with dotted boxes. In pedigree E, dotted boxes shows how the common parental haplotype is inherited.
Genotyping
Genomic DNA was isolated from EDTA-blood using standard procedures, and a genome scan was done using a modified a CHLC/Weber-set 6 of fluorescently labeled primers to amplify microsatellite markers roughly 10 cM apart. Electrophoresis was performed on an ABI 3700 capillary instrument and the results were analysed using Genescan 3.5 and Genotyper 3.7 (Applied Biosystems). Additional markers around D1S1660 were typed with the same methods to confirm linkage and define a minimal common region for each family.
Statistical analysis
Pairwise linkage analysis was performed using MLINK within the Fastlink 3.0P (Cottingham et al. 1993) package for MS-DOS under Windows NT 4.0, based on the Linkage 5.1 program (Lathrop et al. 1984). Maxloop was set to 7 to allow for the consanguity loops in the pedigrees. LOD scores were calculated assuming autosomal recessive mode of inheritance and full penetrance with a disease allele frequency of 0.001. Marker allele frequencies were calculated from individuals from different European countries (>100 chromosomes).
RESULTS
LOD score analysis show strong evidence for linkage to the MCPH5 region at 1q31 with a maximum combined Zmax for marker D1S1660 (4.78 at θ=0.03). LOD scores are shown in Table 1. Pedigree A alone has the power to confirm linkage, while the results from the other families are compatible with linkage.
| D1S3469 θ: | 0 | 0,01 | 0,05 | 0,1 | 0,2 | 0,3 | |
| ped. A | 3,39 | 3,3 | 2,95 | 2,51 | 1,64 | 0,87 | Zmax=3,64 |
| ped. B+D | 0,89 | 0,86 | 0,76 | 0,62 | 0,38 | 0,18 | θmax=0,03 |
| ped. E | −∞ | −0,71 | −0,14 | 0 | 0,02 | −0,04 | |
| D1S1660 | |||||||
| ped. A | 1,95 | 2,58 | 2,87 | 2,72 | 2,11 | 1,34 | Zmax=4,78 |
| ped. B+D | 0,94 | 0,91 | 0,8 | 0,66 | 0,4 | 0,19 | θmax=0,03 |
| ped. E | 1,16 | 1,14 | 1,04 | 0,92 | 0,66 | 0,41 | |
| D1S1726 | |||||||
| ped. A | 2,6 | 3,22 | 3,48 | 3,29 | 2,57 | 1,68 | Zmax=3,58 |
| ped. B+D | −∞ | −0,78 | −0,18 | 0 | 0,08 | 0,05 | θmax=0,065 |
| ped. E | 0,31 | 0,3 | 0,25 | 0,2 | 0,11 | 0,04 |
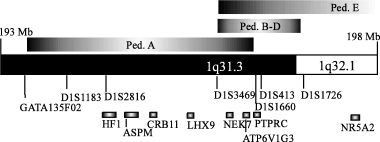
Haplotype analysis of pedigree A narrows the possible region for the gene to less than 3 Mb between markers GATA135F02 and D1S1660 through recombinations in patient 1 and 6 (Fig. 1). The other three families from the Netherlands do not share the same haplotype as pedigree A, but pedigree B and C do share a haplotype defined by markers D1S1660 and D1S413. The brothers in pedigree D are not homozygous in this region, but they have the same genotype for all typed markers. The data are compatible with one haplotype and mutation in ped. A, another haplotype in ped. B, C and on one of the chromosomes in ped. D and a third haplotype in ped. D, making the patients in ped. D compound heterozygotes. The overall interpretation of the data from the Dutch families is that the gene is located above marker D1S1660, because of a recombination in patient 1, and below marker D1S3469 based on a sharing of haplotypes for only markers D1S1660 and D1S413, leaving only a 0.58 Mb interval between D1S1660 and D1S3469 (Fig. 2).

The homozygous regions for pedigree A, B–D and E aligned to the 1q31-1q32 region. The positions of all typed markers and some of the annotated genes is shown. The region for pedigree E extends to marker D1S1678 at 201 Mb.
The largest homozygous region for the affected members of the Jordanian family were found at MCPH5. Homozygosity was not seen for markers at MCPH1-4. Fine mapping and haplotype analysis revealed that the parents carry a haplotype which segregates with disease, as shown in pedigree E. Patient 13 is homozygous for 79 cM from marker D1S1595 to D1S549, while patient 14 has undergone recombination after marker D1S3469, leaving a common homozygous region of 28 cM in the affected boys. The father is not informative for markers D1S1660 to D1S1726. A recombination is seen in one of the healthy siblings before marker D1S1678. These results suggests that the gene is located between D1S3469 and D1S1678, which agrees with the interpretation of the data from the Dutch families.
DISCUSSION
The clinical variations between families with primary microcephaly, as well as the complexity of human brain development, suggest that the disease can be caused by several genes, which was confirmed by the identification of five different loci after linkage analysis in affected families. However, a locus such as MCPH5, previously mapped to a region of more than eight megabases, might include more than one gene needed for normal brain development. This could possibly cause confusion when trying to fine map a causative gene using families linked to the same region but with different haplotypes. If the families analysed here indeed carry mutations in the same gene, it can be concluded that it is contained in a region of only 580 kb defined by markers D1S3469 and D1S1660, excluding the ASPM gene (Fig. 2). This region contains two known genes. The ATP6V1G3, encoding a subunit of vacuolar ATPas, is expressed in the kidney in a tissue specific manner (Smith et al. 2002). The second gene is NEK7, a kinase structurally related to the mitotic regulator NIMA in A. nidulans. The murine homologues Nek6 and Nek7 has been shown to be tightly bound to another NIMA-like kinase, Nercc1, which is needed for the mitotic organisation of chromosomes. Disruption of this interaction can lead to mitotic halt (Roig et al. 2002). ASPM, which was recently reported to carry mutations in some Pakistani families with microcephaly, has been suggested to be involved in regulation of mitotic spindle orientation i.e. a mechanism related to that of NEK7. Both Nek7 and Nek6 are expressed during embryogenesis, with restriction to the nervous system. Human NEK7 shares 97% and 77% sequence identity with mouse Nek7 and Nek6, and its pattern of expression and involvement in mitosis make it a possible candidate for causing microcephaly. It can be noted that NEK6 is located at 9q34, in the MCPH3 locus.
Acknowledgements
This study was supported by the Swedish Research Council (09747 and 12493). We thank the physicians at the institute for mentally retarded in the Netherlands for collecting samples, and Benjamin Bakall and Martin Dreilich for support.


