Genetic diversity in Tanzanian Arabica coffee using random amplified polymorphic DNA (RAPD) markers
Abstract
DNA from Coffea arabica leaves was used for RAPD analysis and a total of 144 leaf samples collected from 16 provenances in five regions of Tanzania were analysed. Ten arbitrary 10 mer primers were employed in the analysis and they produced a total of 86 fragments. Fragment sizes ranged from 100–1400 bp. The resulting dissimilarity matrix revealed values ranging from 0.11 to 1, while the average was 0.66. The cophenetic matrix and the original dissimilarity matrix showed a significant correlation of 78 %. Mean dissimilarity values within provenances showed a fairly uniform trend despite the large range from 0.31 to 0.65. The dendrogram based on genetic distances but showed two clusters with grouping of provenances similar to the dendrogram generated by Jaccard's coefficient. Bootstrap analysis showed low values, despite this, the resulting dendrogram grouped all provenances according to their geographical origin. The standard genetic distances were fairly uniform implying a narrow genetic base in the cultivated Arabica coffee.
Coffea belongs to the, mainly tropical, Rubiaceae family, which contains some 640 genera and 10000 species. It is a biologically and morphologically diverse family consisting of varied life forms ranging from tiny herbs, epiphytes, lianas, shrubs to tall trees. It also has varied reproductive traits with various kinds of flowers having different pollination systems (Bremer 1996).
The genus Coffea consists of about 90 species, the majority of which are found in tropical Africa, from the Congo basin to the highlands of Ethiopia (Willson 1999). In Madagascar, the Rubiaceae happens to be the biggest family of woody plants, second only to Orchidaceae in total number. It contains approximately 95 genera, 32 of which are found nowhere else in the world, and nearly 800 species.
Commercially, the most important species are Coffea canephora Pierre and Coffea arabica L. The former, which is a diploid (2n=2x=22), is self-incompatible while the latter; the only tetraploid (2n=4x=44) in the genus Coffea, is self-fertile. Coffea arabica is the most widely cultivated species in Tanzania, being grown in the Kilimanjaro, Arusha, Tanga, Mbeya, Morogoro and Ruvuma regions, while C. canephora is cultivated mostly in the north western region of Kagera and to some extent in Morogoro region.
Some coffee species, e.g. C. zanguebariae and C. mufindiensis, are natives of Tanzania but C. arabica was introduced in 1877 by Catholic missionaries from Réunion, formerly known as Bourbon (Kieran 1966). Up to early 1900, more introductions were made from Aden, Ethiopia, Java, India and Jamaica. Commercial coffee planting started in the north eastern highlands of Kilimanjaro, but it later spread to the other regions with similar climate. Given the several introductions, some characteristics of agronomic interest, for example, resistance to coffee berry disease (CBD) have been observed in some local coffee populations (KILAMBO, Tanzania Coffee Research Institute, Box 3004, Moshi). Knowledge of the structure of genetic diversity will enhance the use of the available genetic resources in addressing some of the biological constraints in coffee production.
A variety of molecular techniques have been used in studying the genetic diversity of coffee. Use of six isoenzyme systems on C. arabica accessions from Kenya and Ethiopia failed to reveal polymorphism, the results contrasted to the level of morphological variation detected in the same germplasm thus suggesting isoenzymes as being inappropriate for determining diversity in C. arabica (Louarn 1978).
Random amplified polymorphic DNA (RAPD) markers generated by arbitrary primers have been used to detect genetic diversity and selective gene introgression in Coffea arabica (Orozco-Castillo et al. 1994). The resulting dendrograms from RAPD profiles were consistent with the known history and evolution of Coffea arabica. RAPD markers have also been used successfully to analyse the genetic diversity among cultivated and sub-spontaneous accessions of Coffea arabica (Lashermes et al. 1996). Anthony et al. (2001) conducted a study of genetic diversity of wild coffee (Coffea arabica L.) using RAPD markers. From the results it was possible to separate the Ethiopian materials from the Typica and Bourbon accessions which were included in the study, and classify the collected Ethiopian materials into four groups.
Aga et al. (2003) used RAPD analysis to assess genetic diversity of the Ethiopian C. arabica with the objective of getting information to be used as a guideline for in situ conservation. They were able to identify four populations of interest, although they suggested further analysis with a larger sample size using co-dominant marker systems before the final recommendations for in situ conservation.
In this study, RAPD markers were used to evaluate genetic diversity in Tanzanian cultivated Arabica coffee collected from five different regions. The results are expected to provide an insight into the degree of genetic variation, identify local populations that might be of interest to include in the national breeding programme and provide guidance on the need for introductions for overall improvement of coffee.
MATERIAL AND METHODS
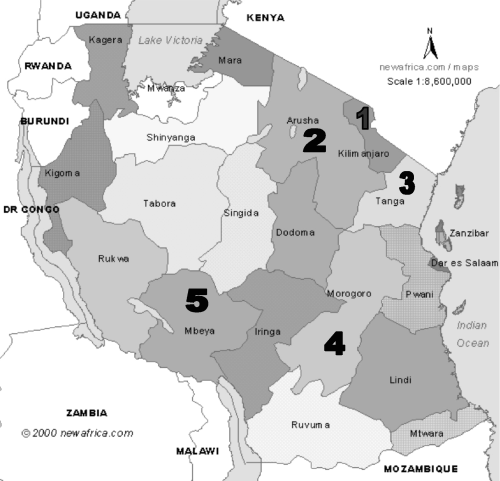
Coffee leaf samples were collected from five regions: Kilimanjaro, Arusha, Tanga, Morogoro and Mbeya (Fig. 1). Guided by a transect, young tender leaves were collected from old coffee trees. Leaves were taken from a tree at every 100–400 m depending on the size of the farm. The samples were preserved in a portable fridge soon after harvesting and later stored at −80°C to await DNA extraction. The number of samples and their locations are shown in Table 1.

The five regions of Tanzania where coffee leaf samples were collected.
| Region | District | Location | Number of samples |
|---|---|---|---|
| Kilimanjaro | Moshi Rural | Kilema- RC Parish (Ki) | 9 |
| Moshi Rural | Kibohehe (Kb) | 9 | |
| Moshi Rural | Kifumbu (Kif) | 9 | |
| Moshi Rural | Keiti (Ke) | 9 | |
| Moshi Rural | Chombo (Ch) | 9 | |
| Arusha | Arumeru | Tengeru Farm (Te) | 9 |
| Arumeru | Nkoanenkoli (Nk) | 9 | |
| Tanga | Lushoto | Gare (Ga) | 9 |
| Lushoto | Bazo (Ba) | 9 | |
| Lushoto | Maweni (Ma) | 9 | |
| Lushoto | Ziwai (Zi) | 9 | |
| Mbeya | Tukuyu | Bwenda (Bw) | 9 |
| Tukuyu | Bugoba Masebe (Bg) | 9 | |
| Ileje | Ileje (Ij) | 9 | |
| Mbozi | Shiwanda (Sh) | 9 | |
| Morogoro | Mororgoro Rural | Luale (Lu) | 9 |
Isolation of genomic DNA
DNA was extracted from frozen young leaves by a modified CTAB procedure as described by Aga et al. (2003). DNA concentration was determined by fluorescent spectrophotometry (Hitachi model F-2000), using the dye Hoechst 33258 (Steen et al. 1993). The quality of the DNA was checked on a 1 % agarose gel.
Amplification of coffee genomic DNA
One hundred 10-mer single strand DNA primers (Operon Technologies, Ca, USA) were screened on two individuals from each provenance to identify primers that exhibited polymorphism and gave reproducible results. From these ten were selected (Table 2).
| Primer | Sequence |
|---|---|
| A-07 | GAAACGGGTG |
| A-15 | TTCCGAACCC |
| B-02 | TGATCCCTGG |
| C-07 | GTCCCGACGA |
| C-08 | TGGACCGGTG |
| C-10 | TGTCTGGGTG |
| C-15 | GACGGATCAG |
| C-18 | TGAGTGGGTG |
| I-20 | AAAGTGCGGG |
| N-18 | GGTGAGGTCA |
PCR reactions were performed in a final volume of 20 μl using a GENE Amp PCR System 9700 thermocycler (Hitachi Ltd. Japan), containing 50 ng of genomic DNA, 0.75 ng/μl of primer, 100 μM dNTPs, 2 mM MgCl2, PCR buffer (75 mM Tris-HCl; pH 8.8, 20 mM (NH4)2SO4, 0.01 % (v/v) of Tween 20) and 1 unit Taq polymerase (ABgene House, Surrey, U.K.). Amplification was carried out with one cycle of initial strand separation at 94°C for 3 min followed by 45 cycles of 1 min at 94°C, 1 min at 37°C and 2 min at 72°C. The last cycle was followed by an additional extension at 72°C for 10 min. The PCR products were separated on a 1.5 % agarose gel at 90 volts for 2 h. DNA fragments were visualised by UV light after staining the gel with 0.5 μg/ml ethidium bromide.
Data analysis

Analysis was limited to nine individuals from each of the 16 provenances, 144 accessions in total. This was necessitated by the MAPRF6-DDAT software's capacity and also to have an equal number of accessions for each provenance. Using NTSYS software, a dissimilarity matrix was calculated utilising Jaccard's (1908) coefficient. The matrix was converted to a dissimilarity matrix corresponding to the complement (dissimilarity=1−similarity). The within and between-provenance values were calculated from the resulting matrix (Table 3). Cluster analysis based on the dissimilarity matrix, was performed using unweighted pair-group method arithmetic averages (UPGMA), (Sneath and Sokal 1973), of the NTSYS_PC version 1.8 (Rohlf 1973). A dendrogram was generated using the SAHN clustering program. A cophenetic matrix was computed from the obtained tree matrix and compared to the original dissimilarity matrix. Fragment frequencies were used to generate a matrix for bootstrap analysis with 1000 replications. Average heterozygosity for each population, standard genetic distances (Nei 1972) and a dendrogram showing bootstrap values were obtained from this analysis.
| Kb | Ki | Kif | Ke | Ch | Nk | Te | Ba | Zi | Ga | Ma | Bw | Ij | Sh | Bg | Lu | |
|---|---|---|---|---|---|---|---|---|---|---|---|---|---|---|---|---|
| Kb | 0.45 | |||||||||||||||
| Ki | 0.63 | 0.56 | ||||||||||||||
| Kif | 0.70 | 0.69 | 0.51 | |||||||||||||
| Ke | 0.63 | 0.68 | 0.60 | 0.48 | ||||||||||||
| Ch | 0.74 | 0.71 | 0.66 | 0.663 | 0.65 | |||||||||||
| Nk | 0.65 | 0.69 | 0.7 | 0.64 | 0.73 | 0.47 | ||||||||||
| Te | 0.63 | 0.63 | 0.7 | 0.65 | 0.71 | 0.54 | 0.40 | |||||||||
| Ba | 0.61 | 0.65 | 0.63 | 0.64 | 0.69 | 0.53 | 0.48 | 0.31 | ||||||||
| Zi | 0.68 | 0.74 | 0.67 | 0.68 | 0.74 | 0.61 | 0.59 | 0.52 | 0.43 | |||||||
| Ga | 0.68 | 0.77 | 0.69 | 0.68 | 0.77 | 0.60 | 0.63 | 0.53 | 0.58 | 0.51 | ||||||
| Ma | 0.72 | 0.81 | 0.75 | 0.68 | 0.79 | 0.67 | 0.68 | 0.65 | 0.68 | 0.65 | 0.53 | |||||
| Bw | 0.75 | 0.74 | 0.75 | 0.72 | 0.77 | 0.68 | 0.67 | 0.63 | 0.70 | 0.71 | 0.73 | 0.51 | ||||
| Ij | 0.76 | 0.78 | 0.72 | 0.68 | 0.7 | 0.7 | 0.69 | 0.68 | 0.70 | 0.71 | 0.73 | 0.69 | 0.52 | |||
| Sh | 0.71 | 0.76 | 0.74 | 0.70 | 0.74 | 0.68 | 0.68 | 0.66 | 0.69 | 0.72 | 0.76 | 0.67 | 0.65 | 0.43 | ||
| Bg | 0.76 | 0.76 | 0.71 | 0.66 | 0.70 | 0.68 | 0.69 | 0.62 | 0.68 | 0.69 | 0.71 | 0.67 | 0.63 | 0.65 | 0.46 | |
| Lu | 0.65 | 0.67 | 0.65 | 0.63 | 0.72 | 0.56 | 0.55 | 0.52 | 0.62 | 0.64 | 0.67 | 0.68 | 0.72 | 0.66 | 0.67 | 0.32 |
RESULTS
Genetic diversity
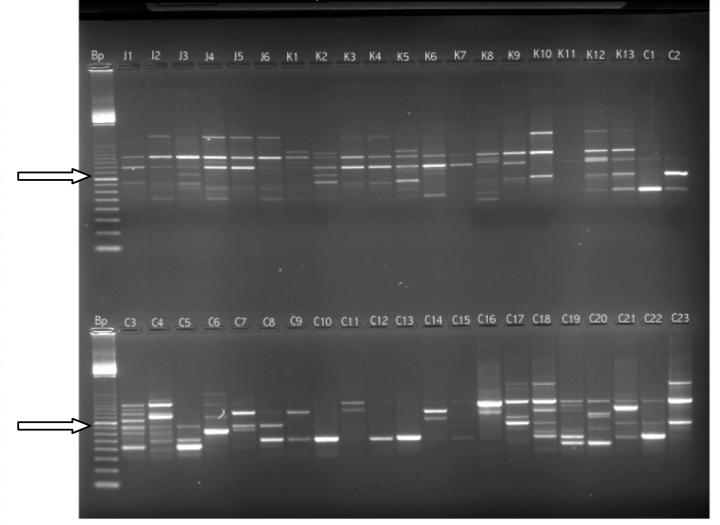
Of the one hundred 10-mer primers tested for their capacity to differentiate among a sub-set of 32 randomly chosen coffee accessions, the best ten primers that detected polymorphism between accessions and gave reproducible banding patterns were chosen. The 10 primers produced a total of 86 fragments. Fragment sizes ranged from 100–1400 bp. Examples of polymorphisms shown by primer OP-C15 is shown in Fig. 2.

RAPD profiles of Gare (J), Maweni (I) and Bwenda (C) provenances using primer OP-C15. The first lane (Bp) is size marker where the arrow shows the 800 bp fragment.
The resulting dissimilarity matrix revealed values ranging from 0.11 to 1, while the average was 0.66. The cophenetic matrix and the original dissimilarity matrix showed a significant correlation of 78 %. The mean between-provenance dissimilarity values ranged from 0.48, between Bazo and Tengeru, to 0.81, between Maweni and Kilema (Table 3). Mean dissimilarity values within provenances showed a fairly uniform trend despite the large range from 0.31 for Bazo, to 0.65 for Chombo. The overall average dissimilarity values were 0.47 and 0.67, within and between-provenances respectively. Taking averages of dissimilarity values on regional basis shows Kilimanjaro has 0.53, Arusha, 0.43, Tanga 0.45 and Mbeya, 0.48.
The generated dendrogram of all 144 accessions (not shown) showed five clusters. The first had Kibohehe and Kilema provenances (Kilimanjaro), the second had accessions from Nkoanenkoli (Arusha), Bazo (Tanga), Gare (Tanga), Tengeru (Arusha), Luale (Morogoro), Maweni (Tanga), and Ziwai (Tanga). The third had Kifumbu, Keiti and Chombo all from Kilimanjaro while the fourth cluster had accessions from Ileje, Bugoba Masebe, Shiwanda, and Bwenda, all from Mbeya region. The last cluster had few individuals from seven provenances. The majority of accessions from Kilimanjaro region, were split into two small clusters, those from Arusha, Tanga and Morogoro regions clustered together while, accessions from Mbeya formed there own cluster. The fifth cluster included a few individuals from Gare, Kibohehe, Ileje, Maweni, Chombo, Nkoanenkoli and Kifumbu provenances. Principal coordinate analysis (PCA) of which the plot of the first three coordinates explained 40 % of the variation was performed, a similar pattern of distribution of the provenances was observed.
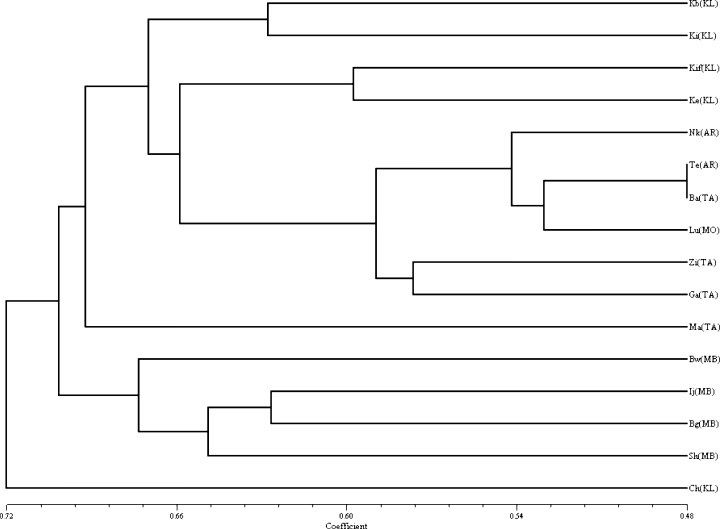
A dendrogram generated from the between-provenance matrix showed two main clusters (Fig. 3). Kilimanjaro provenances (Kibohehe, Kilema, Kifumbu, and Keiti) were in the first two sub-clusters of the first cluster, while Arusha, Morogoro and Tanga provenances (Nkoanenkoli, Tengeru, Bazo, Luale, Ziwai and Gare) occupied the third and fourth sub-clusters. Maweni provenance stood alone then followed the second cluster, which had Mbeya provenances (Bwenda, Ileje, Bugoba Masebe and Shiwanda). Chombo provenance from Kilimanjaro appeared at the lower end of the dendrogram.

Dendrogram of cultivated Arabica coffee from five regions of Tanzania based on between-provenance dissimilarity matrix using Jaccard's (1908) coefficient. KL – Kilimanjaro; AR – Arusha; TA – TAnga; Mo – Morogoro; MB – Mbeya.
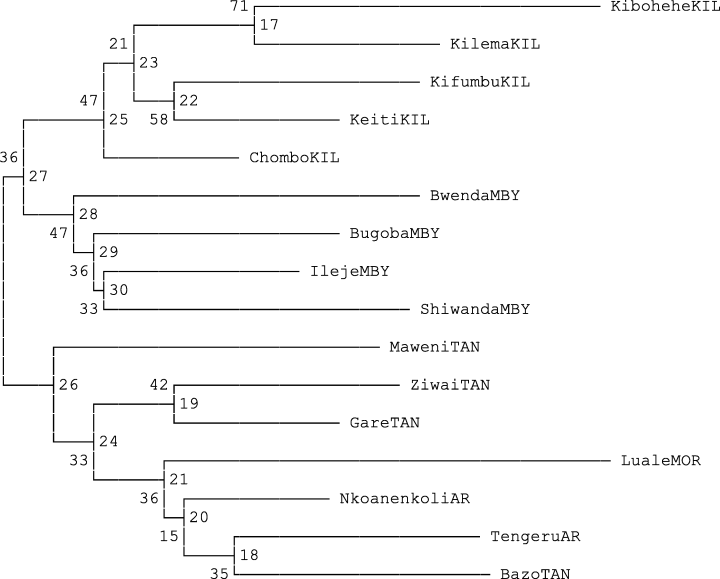
The bootstrap analysis gave heterozygosity values of 0.14 (Shiwanda) to 0.24 (Maweni) (Table 4). The standard genetic distances (Nei 1972), ranged from 0.11 between Ileje and Bugoba to 0.37 between Kibohehe and Bwenda with a mean of 0.23 (Table 5). The dendrogram based on Nei et al. (1983) genetic distances, showed two clusters with grouping of provenances similar to the one generated by Jaccard's (1908) coefficient (Fig. 4). The only exception being, Chombo was connected to a sub-cluster with other Kilimanjaro provenances. All of the bootstrap values but two, (Kibohehe-Kilema) 71 and (Kifumbu-Keiti) 58 were below fifty. Heterozygosity values for Kilimanjaro, Arusha, from two Tanga and one Mbeya provenance were ≥0.2.
| Region | Population | Average heterozygosity |
|---|---|---|
| Kilimanjaro | Kibohehe | 0.22 |
| Kilimanjaro | Kilema | 0.21 |
| Kilimanjaro | Kifumbu | 0.21 |
| Kilimanjaro | Keiti | 0.20 |
| Kilimanjaro | Chombo | 0.19 |
| Arusha | Nkoanenkoli | 0.22 |
| Arusha | Tengeru | 0.20 |
| Tanga | Bazo | 0.16 |
| Tanga | Ziwai | 0.18 |
| Tanga | Gare | 0.22 |
| Tanga | Maweni | 0.24 |
| Mbeya | Bwenda | 0.21 |
| Mbeya | Ileje | 0.16 |
| Mbeya | Shiwanda | 0.14 |
| Mbeya | Bugoba | 0.16 |
| Morogoro | Luale | 0.16 |
| Kib | KI | Kif | Ke | Ch | Nk | Te | Ba | Zi | Ga | Ma | Bw | Ij | Sh | Bg | |
|---|---|---|---|---|---|---|---|---|---|---|---|---|---|---|---|
| Ki | 0.160 | ||||||||||||||
| Kif | 0.288 | 0.169 | |||||||||||||
| Ke | 0.208 | 0.171 | 0.124 | ||||||||||||
| Ch | 0.257 | 0.114 | 0.108 | 0.119 | |||||||||||
| Nk | 0.256 | 0.213 | 0.265 | 0.190 | 0.209 | ||||||||||
| Te | 0.268 | 0.191 | 0.312 | 0.254 | 0.241 | 0.136 | |||||||||
| Ba | 0.279 | 0.253 | 0.260 | 0.284 | 0.261 | 0.159 | 0.147 | ||||||||
| Zi | 0.279 | 0.257 | 0.210 | 0.235 | 0.200 | 0.168 | 0.196 | 0.158 | |||||||
| Ga | 0.251 | 0.282 | 0.212 | 0.211 | 0.216 | 0.138 | 0.213 | 0.138 | 0.115 | ||||||
| Ma | 0.313 | 0.348 | 0.300 | 0.217 | 0.248 | 0.217 | 0.288 | 0.285 | 0.225 | 0.165 | |||||
| Bw | 0.370 | 0.237 | 0.283 | 0.248 | 0.207 | 0.242 | 0.276 | 0.260 | 0.254 | 0.231 | 0.267 | ||||
| Ij | 0.321 | 0.230 | 0.195 | 0.173 | 0.097 | 0.213 | 0.248 | 0.286 | 0.204 | 0.197 | 0.212 | 0.168 | |||
| Sh | 0.285 | 0.246 | 0.260 | 0.234 | 0.169 | 0.230 | 0.284 | 0.297 | 0.232 | 0.260 | 0.297 | 0.188 | 0.135 | ||
| Bg | 0.346 | 0.240 | 0.216 | 0.185 | 0.134 | 0.218 | 0.286 | 0.239 | 0.217 | 0.196 | 0.221 | 0.175 | 0.111 | 0.159 | |
| Lu | 0.340 | 0.300 | 0.284 | 0.268 | 0.288 | 0.196 | 0.223 | 0.216 | 0.261 | 0.270 | 0.317 | 0.324 | 0.325 | 0.289 | 0.292 |

Neighbour-joining dendrogram based on Nei et al. (1983) distances.
DISCUSSION
The RAPD polymorphism observed in this study is higher than observed in other studies because a large number of accessions were used and all strong visualized fragments were scored. In studies by Orozco-Castillo et al. (1994) and Lashermes et al. (1996), only a few accessions were used. Anthony et al. (2001) on the other hand used 119 accessions but only well-amplified fragments were scored.
The history of coffee cultivation has seen massive reduction in diversity (Lashermes et al. 1996; Anthony et al. 2002) This coupled by the fact that coffee is self-pollinating and selection by farmers causes further reduction in diversity. Tanzania has had coffee introductions from the centre of coffee genetic diversity i.e. Ethiopia, and from both Typica and Bourbon base populations. It is difficult to say with certainty where each of the introductions was planted since records have not been maintained. Furthermore, there were cases of replanting with better varieties in incidences of severe disease/pest pressure or low yields on the existing varieties.
Results show Kilimanjaro, Arusha, Tanga and Morogoro being in different sub-clusters in the first cluster (Fig. 3). The first commercial coffee planting started in Kilimanjaro region and the seed originated from materials introduced via Bagamoyo, the same varieties were probably distributed to neighbouring regions of Arusha, Tanga and as far apart as Morogoro. The genetic distances between provenances were fairly uniform suggesting limited variation (Table 5). Carvalho (1988) points out that the encountered variation which has resulted in so many cultivars, is generally believed to be more the result of spontaneous mutations of major genes conditioning plant, fruit and seed characters than of residual heterozygosity. The high dissimilarity value for Kilimanjaro is attributed mostly to the Chombo provenance. Chombo farm is part of a collection of large-scale coffee estates in Uru, Moshi rural district. It is possible that individual farmers could have introduced new coffee cultivars in the quest of improving production, no wonder the higher dissimilarity value for Chombo provenance. The diversity structure tested by bootstrap analysis showed low values but it managed to group all provenances according to their regions of origin.
We suggest that the fairly uniform standard genetic distances could be due to the reproductive biology of coffee, selection, and the narrow genetic base of the cultivated Arabica coffee. Both dendrograms show accessions from the same location or region clustering together. Similar trends have been observed in other studies (Anthony et al. 2001, 2002). They attributed the low genetic diversity in C. arabica to its allotetraploid origin, reproductive biology and evolution (Lashermes et al. 1995, 1999). The results demonstrate that RAPD markers were able to determine variability in the Tanzanian cultivated C. arabica accessions. Coffee accessions clustered according to geographical locations. Thus, for rapid improvement in breeding work, we suggest widening of the existing genetic base by having more introductions especially from the centre of diversity (Anthony et al. 2001), initiate hybridisation programmes to create variability and use of diploid species as a source of desirable genes (Lashermes et al. 1995, 1999).


