Cyclophilin A and Nuclear Factor of Activated T Cells Are Essential in Cyclosporine-Mediated Suppression of Polyomavirus BK Replication
[Correction made after online publication May 29, 2012: author affiliations have been updated.]
Abstract
Immunosuppressants have impacts on the development of polyomavirus-associated nephropathy. We previously demonstrated that cyclosporin A (CsA) suppressed polyomavirus BK (BKV) replication. The role of cyclophilin A (CypA) and nuclear factor of activated T cells (NFAT) in CsA-imposed suppression of BKV replication was determined in this study. Results demonstrated that knockdown of CypA but not CypB significantly reduced BKV large T antigen (TAg) expression and BKV titer. Overexpression of CypA reversed CypA siRNA-induced inhibition in BKV TAg expression. In addition, CypA overexpression attenuated the suppressive effect of CsA on TAg expression, suggesting CypA implicated in CsA-mediated anti-BKV effect. Knockdown of NFATc3 abrogated TAg expression, while overexpression of NFATc3 promoted TAg expression and augmented BKV promoter activity. NFATc3 binding to the BKV promoter was verified by chromatin immunoprecipitation assay and electrophoretic mobility shift assay. Renal histology also displayed an increase in NFATc3 expression in tubulointerstitium of BKV-associated nephropathy. Furthermore, overexpression of NFATc3 rescued CsA-mediated inhibition of BKV load and TAg expression. A CsA analog, NIM811, which cannot block NFAT functionality, failed to suppress TAg expression. In conclusion, CypA and NFAT are indispensable in BKV replication. CsA inhibits BKV replication through CypA and NFAT, which may be potential targets of anti-BKV treatment.
Abbreviations:
-
- BKV
-
- polyomavirus BK
-
- PVAN
-
- polyomavirus-associated nephropathy
-
- CMV
-
- cytomegalovirus
-
- CsA
-
- cyclosporin A
-
- CypA
-
- cyclophilin A
-
- HCV
-
- hepatitis C virus
-
- HIV
-
- human immunodeficiency virus
-
- TAg
-
- large T antigen
-
- NCCR
-
- noncoding control region
-
- NFAT
-
- nuclear factor of activated T cells
Introduction
Polyomavirus BK (BKV) reactivation in renal transplant patients is a critical problem (1,2). It has been reported that 5–10% of the subjects develop polyomavirus-associated nephropathy (PVAN) (3) and up to 50% of the patients with PVAN eventually lose their allograft within 2–3 years (4). Tacrolimus and mycophenolate are associated with a higher incidence of PVAN compared with other immunosuppressants (5, 6). Cyclosporin A (CsA), a calcineurin inhibitor, has been commonly used for the prevention of allograft rejection after organ transplantation due to its selective function in inhibiting T cell immunity. In addition to immunosuppression, CsA can also inhibit replication of various viruses, including human immunodeficiency virus (HIV) type I, vaccinia virus, herpes simplex virus, hepatitis C virurs (HCV) and cytomegalovirus (CMV) (7–12). It has been reported that CsA can inhibit BKV replication in green monkey kidney cells (Vero E6 cells) (13). Similarly, we previously demonstrated that CsA suppressed BKV replication and its noncoding control region (NCCR) promoter activity in cultured human renal proximal tubular cells (14). Nevertheless, the mechanisms by which CsA inhibits BKV replication remain elusive.
Cyclophilin A (CypA) was isolated as a CsA-specific binding protein by Handschumacher et al. in 1984 (15). To date, seven major cyclophilin (Cyp) members including CypA, CypB, CypC, CypD, CypE, Cyp40 and CypNK have been identified in humans (16). CsA binds to cyclophilins to form a complex and subsequently inhibits phosphatase activity that is required for calcineurin activation. Through inhibition of calcineurin activation, CsA induces phosphorylation of nuclear factor of activated T cells (NFAT), which prevents translocation of NFAT from the cytoplasm into the nucleus, thereby blocking NFAT activity (17,18). Five NFAT family members have been identified to date. Of these, NFATc1 (NFAT2), NFATc2 (NFAT1), NFATc3 (NFAT4) and NFATc4 (NFAT3) are dephosphorylated and activated by calcineurin, while they are phosphorylated and inactivated by CsA (19,20).
Cyp and NFAT, two CsA mediators, have been shown to play important roles in CsA-induced suppression of different viral replication. For example, CsA inhibits mouse CMV and HCV replications via a CypA-dependent pathway (11,21). In addition, NFAT can enhance HIV-1 replication in primary human CD4 T cells (22). In this study, we demonstrated that CypA and NFATc3 are essential for CsA-mediated suppression of BKV replication. This study may provide a new therapeutic target for the treatment of BKV infection.
Materials and Methods
Materials and cell culture
Mouse anti-SV40 TAg antibody, which can also recognize BKV TAg, was purchased from Calbiochem (La Jolla, CA, USA). Anti-BKV VP1 antibody was the gift of Abnova Co. (Taipei, Taiwan). Antiflag antibody and CsA were purchased from Sigma (Sigma Chemical Company Ltd., Poole, UK). CypA, CypB and NFATc3 siRNA were obtained from Dharmacon Inc. (Lafayette, CO, USA). Goat anti-NFATc3 antibody was purchased from R&D Systems (Minneapolis, MN, USA) and rabbit anti-NFATc4 antibodies were purchased from Santa Cruz Biotech, Inc. (Santa Cruz, CA, USA).
Immortalized human renal proximal tubular cells, HK-2, were cultured as described previously (23).
Flag-epitope (DYKDDDDK) cDNA was attached to the full-length coding sequences of CypA, CypB, NFATc3 and NFATc4, which are obtained by qPCR from human genomic DNA using the standard technique (24).
Real-time quantitative polymerase chain reaction (qPCR)
qPCR was performed as described previously (25). Briefly, total RNA was isolated from cells and reverse-transcribed to DNA. qPCR was performed according to the manufacturer's instructions using an ABI-Prism 7700 with SYBR Green I (PE-Applied Biosystems, Cheshire, UK, Britain). Primers used to assay BKV TAg and glyceraldehyde-3-phosphate dehydrogenase (GAPDH) transcript levels (BKV TAg: 5-CTGTCCCTAAAACCCTGCAA-3 and 5- GCCTTTCCTTCCATTCAACA -3; GAPDH: 5-TTCCAGGAGCGAGATCCCT-3 and 3-CACCCATGACGAACATGGG-5) were constructed to be compatible with a single reverse transcription-PCR thermal profile (95°C for 10 min, 40 cycles of 95°C for 30 s and 60°C for 1 min). Experimental results are presented as the transcript level of the analyzed genes relative to GAPDH transcript level.
To determine viral load, BKV and cellular DNA were extracted from cell lysate using a QIAamp® DNA Mini Kit (Qiagen, Hilden, Germany). qPCR was performed as described above. The BKV DNA was normalized by analyzing samples in parallel by the quantitative PCR for the cellular tubulin β2A DNA using the commercial primers and probes (Hs00742533_s1*, probe: GTCCTCAAGCATGGTCTTTCTACTT; Applied Biosystems).
Gene silencing by short interfering RNA (siRNA)
RNA interference was used to reduce CypA, CypB and NFATc3 expressions. Briefly, 0.5–1.5 μg of siRNA against CypA, CypB, NFATc3 or control siRNA was diluted in the serum-free medium to give a final volume of 100 μL. Subsequently, RNAiFectI transfection reagent was mixed with diluted siRNA at ratio from 6:1 to 3:1. Following incubation for 15 min at room temperature, the mixture was added to the culture medium.
Luciferase assay
The NCCR of the BKV and BKV TAg were constructed as described previously (14). The BKV NCCR in early and late orientation was used in this study. Luciferase assays utilized the Dual-Luciferase Report Assay (Promega, Madison, WI, USA) applied according to the manufacturer's recommendations. Luciferase activity was measured using a luminometer (MLX micro titer plate luminometer, Dynex Ltd., Chantilly, VA, USA) and examined on duplicates of each sample. Experimental results were presented as firefly luciferase activity normalized to Renilla luciferase activity.
Western blot analysis
Total cellular protein extraction was performed as described previously (26). Protein samples mixed with reducing SDS sample buffer were resolved on a 10% SDS-PAGE and then electroblotted. Nonspecific binding was blocked with a 5% nonfat milk solution. The membrane was then incubated with primary antibody overnight at 4°C followed by incubation with a horseradish peroxidase (HRP) conjugated secondary antibody. Proteins were visualized using enhanced chemiluminescence (Amersham Biosciences, Amersham, UK). Protein bands of Western blot analysis were quantified using Quantity One software (BioRad). The density of each protein band was normalized with that of tubulin.
Chromatin immunoprecipitation
DNA was cross-linked with 1% formaldehyde at 37°C for 10 min and cells were then resuspended in a SDS lysis buffer. Cell lysate was sonicated and supernatants were diluted 10-fold in a ChIP diluation buffer and precleared with salmon sperm DNA/protein A agarose 50% slurry (Millipore, Billerica, MA, USA). Following brief centrifugation, the supernatant fraction was immunoprecipitated with rabbit anti-NFATc3 or anti-NFATc4 overnight. After the addition of protein A agarose slurry, samples were incubated for 1 h at 4°C. Pellet agarose was washed once with wash buffer I (Millipore, Billerica, USA) and buffer II (Millipore, Billerica, MA, USA). DNA was eluted in 1% SDS, 0.1 M NaHCO3 at room temperature for 1 h. Following proteinase K digestion, DNA was recovered with phenol/chloroform extraction and ethanol precipitation. After the addition of glycogen, DNA was amplified by qPCR using SYBR Green Master Mix as described above. Primers were designed for the BKV NCCR as follows: forward 5′-GCAAAAATTGCAAAAGAATAGG-3′ and reverse 5′-TTCCAGTCCAGGTTTTACCAA-3′.
Electrophoretic mobility shift assay
Electrophoretic mobility shift assay (EMSA) was employed for the analysis of NCCR DNA binding ability by the purified recombinant NFATc3 and NFATc4 protein. Briefly, the pGEX vector for expression in BL21 (DE3) Escherichia coli (Merck) was used to produce the GST-tagged recombinant proteins. Proteins were over-expressed through induction with 0.2 mM Isopropyl β-D-1-thiogalactopyranoside (IPTG) at 16°C for 10 h. Both of the recombinant NFATc3 and NFATc4 were purified through affinity chromatography. For NFAT-DNA binding followed by EMSA, essentially a 20 μL reaction comprised of purified protein, 32p-labelled double-stranded DNA (BKV NCCR) and 125 μg/uL poly dI-dC buffered in 12 mM HEPES pH 7.8, 75 mM KCl, 1 mM EDTA, 4 mM GTP and 12.5% glycerol was incubated at room temperature for 1 h. The protein–DNA mixtures were subsequently loaded onto a 6% DNA Retardation Gel (Invitrogen) alongside “no protein” and “no DNA” controls, and migrated in a 0.5 × TBE running buffer for 1.5 h. Competition experiments were performed with 100-fold excess of the respective unlabelled probes.
Viral progeny
Viral progeny is measured as described by Moriyama et al. (27). Briefly, infected cells were extracted and lysates were undiluted or diluted to 1: 10 or 1:100 and then seeded on cells in 8-well chamber slides for 72 h. Cells were then fixed with 3% paraformaldehyde and permeabilized with 0.2% Triton in PBS. Subsequently, cells were incubated with the mouse anti-SV40 TAg antibody overnight and then incubated with FITC-conjugated antibody at for 1 h. Slides were finally mounted using the Vectashield mounting medium (Vector Laboratories) containing 4′,6′-diamidino-2-phenylindole (dapi) (Molecular Probes, California, USA) to stain nuclei. The fluorescence-forming unit was calculated according to the protocol (27).
Immunohistochemistry
Under permission of the ethics committee of our hospital, residual renal biopsy specimens obtained from 2 PVAN patients were analyzed for deposition of NFATc3 and TAg expressions. Normal tissue away from the edge of renal cell carcinoma (RCC) obtained from one RCC patient undergoing nephrectomy was used as a negative control. Kidney specimens were fixed with 4% paraformaldehyde and embedded in paraffin. Following deparaffinization, sections were then immersed in 3% H2O2 in methanol and blocked with 5% bovine albumin/PBS for 20 min. Following incubation with anti-NFATc3 or anti-SV40 TAg for 1 h, sections were treated with relevant biotin-conjugated antibodies and the NFATc3 or TAg immunostaining was then displayed using a Vectastain ABC kit (Vector Laboratories).
Statistical analysis
All the data were presented as means ± SEM. Statistical analysis was performed using the unpaired Student's t-test. A value of p<0.05 was considered to represent a significant difference.
Results
Inhibition of CypA but not CypB expression reduced BKV replication
To determine whether CypA is required in BKV (TU strain) replication, endogenous CypA expression was knocked down by gene silencing. Inhibition of CypA expression by CypA siRNA was confirmed by Western blot analysis which showed a significant decrease in CypA protein expression (Figure 1A). Blockade of CypA expression led to a reduction in BKV TAg expression (Figure 1A). Similarly, inhibition of CypA expression resulted in a decrease in the level of TAg transcripts as determined by qPCR (Figure 1B).
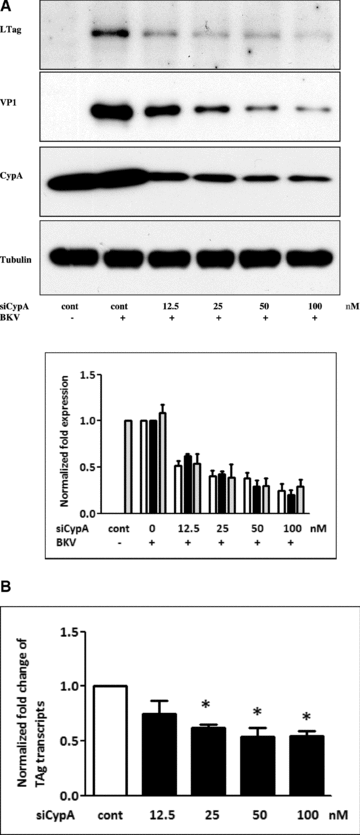
Inhibition of CypA reduced BKV TAg expression. HK-2 cells were transfected with siCypA at different concentrations (12.5–100 nM) overnight. Cells were then infected with the BKV (1.0 × 10⁶ copies/mL) for further 72 h under serum-free condition. Cells transfected with scramble siRNA as the control (100 nM). Cell lysate was subjected to Western blot analysis to determine BKV TAg expression (A) or qPCR to assess the levels of BKV TAg transcripts (B). The density of each protein band (TAg: white bar, VP1: black bar, CypA: gray bar) was normalized with that of tubulin and the fold changes compared to the control were displayed in the lower panel. One representative result of Western blot analysis from three individual replicate experiments is shown. Results of qPCR are expressed as the relative fold increase of TAg transcripts over that of the control, which is arbitrarily set to one (*p < 0.05).
To assess whether CypA knockdown-mediated inhibition of BKV replication could be rescued by reintroduction of CypA into cells, endogenous CypA expression was suppressed using CypA siRNA followed by CypA overexpression. Following inhibition of CypA expression, BKV TAg expression was suppressed while BKV TAg expression was enhanced after the reintroduction of CypA into cells (Figure 2A). Similarly, the results of qPCR also confirmed that the reintroduction of CypA into cells led to an increase in the level of TAg transcripts (Figure 2B) and viral load (Figure 2C). To measure the infectious progeny, viral lysates were collected at the end of the experiments and seeded on the new cells for 72 h. The result confirmed that knockdown of CypA reduced BKV load and the reintroduction of exogenous CypA restored this inhibition (Figure 2D).
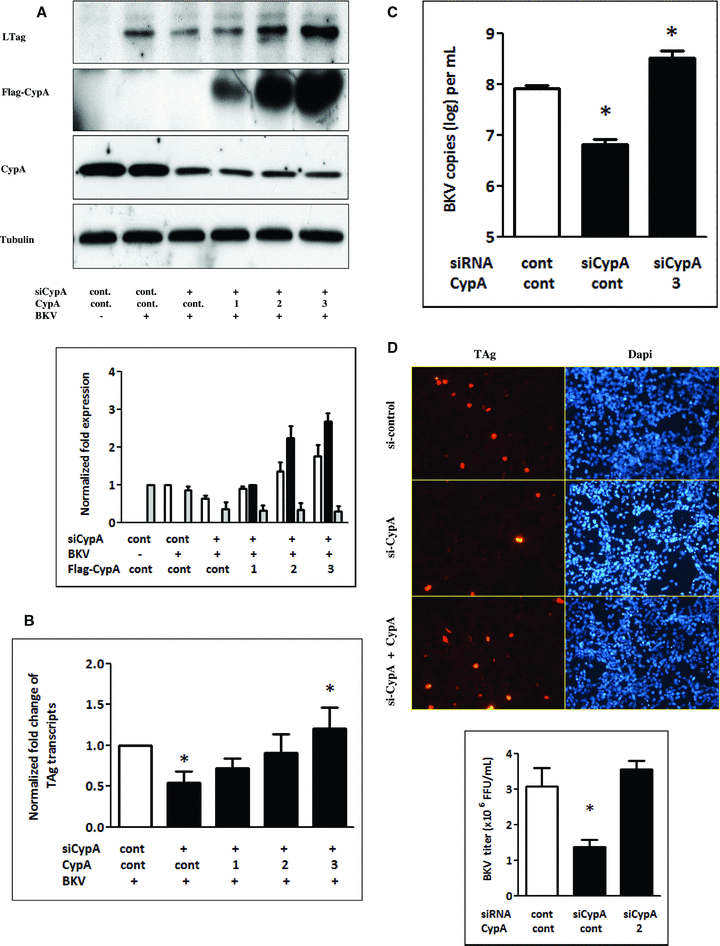
CypA knockdown-induced suppression of BKV TAg expression was rescued by reintroduction of CypA. Cells were transfected with CypA siRNA (50 nM) or scramble siRNA (control) overnight and washed with medium followed by transfection with different concentrations (1–3 μg/mL) of plasmids expressing flag-tagged CypA or an empty control vector. Cells were then infected with the BKV (1.0 × 10⁶ copies/mL) for further 72 h. Cell lysate was subjected to Western blot analysis to determine BKV TAg expression (A) or qPCR to assess the levels of BKV TAg transcripts (B) and viral load. (C) The density of each protein band (TAg: white bar, Flag-tagged CypA: black bar, endogenous CypA: gray bar) was normalized with that of tubulin and the fold changes compared to the control were displayed in the lower panel. For unknown reasons, the flag-tagged CypA expression was unable to be detected by anti-CypA antibody. Results of qPCR are expressed as the relative fold increase of TAg transcripts over that of the control, which is arbitrarily set to one. (*p < 0.05 vs. control). (D) At the end of the experiments performed under the above condition, viral lysates were collected and seeded on the new cells for 72 h. Intracellular viral load was then determined by counting the TAg immunostaining-positive cells (upper panel) to calculate fluorescence-forming units (FFU) as described in the Materials and Methods section.
In addition to CypA, it has been reported that CypB is also required for viral replication (28, 29). To establish whether CypB participates in BKV replication, endogenous CypB expression was inhibited by CypB siRNA. Western blot analysis showed that, in contrast to CypA, knockdown of CypB slightly increased BKV TAg expression (Figure 3A). Similarly, inhibition of CypB expression slightly enhanced the level of TAg transcripts (Figure 3B) and viral load (Figure 3C). These results suggest an indispensable role of CypA but not CypB in BKV replication.
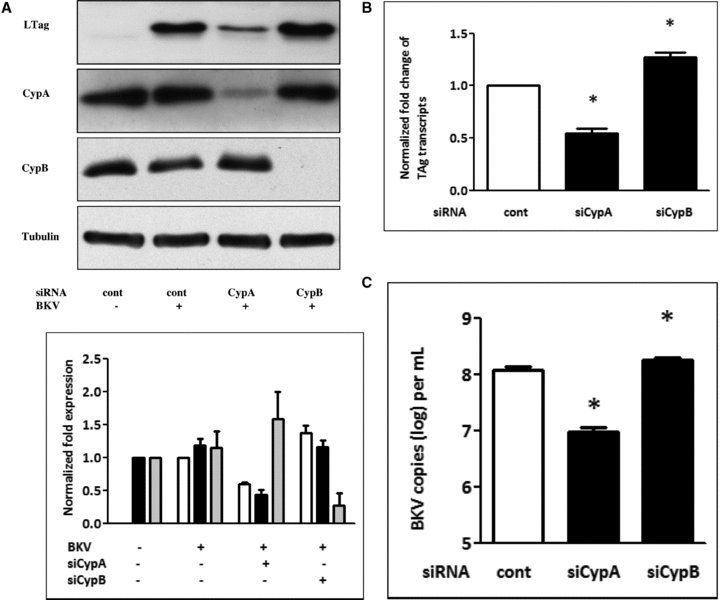
Inhibition of CypA but not CypB reduced BKV TAg expression. Cells were transfected with siCypA or siCypB (50 nM) overnight. Cells were then infected with the BKV (1.0 × 10⁶ copies/mL) for further 72 h under serum-free condition. Cells transfected with scramble siRNA as the control. Cell lysate was subjected to Western blot analysis to determine BKV TAg expression (A) or qPCR to assess the levels of BKV TAg transcripts (B) and viral load (C). The density of each protein band (TAg: white bar, CypA: black bar, CypB: gray bar) was normalized with that of tubulin and the fold changes compared to the control were displayed in the lower panel. Results of qPCR are expressed as the relative fold increase of TAg transcripts over that of the control, which is arbitrarily set to one (*p < 0.05).
CypA overexpression attenuated CsA-mediated suppression of BKV replication
To assess whether CypA is crucial in CsA-mediated inhibition of BKV replication, cells were transfected with the CypA-expressing plasmids followed by administration of CsA for 72 h. In accordance with our previous study (14), administration of CsA (1 μg/mL) resulted in a reduction in BKV TAg expression. Importantly, overexpression of CypA significantly attenuated CsA-mediated inhibition in BKV TAg expression compared with transfection of the control vector (Figure 4). At high CypA expression levels, CypA overexpression even surpassed the CsA-mediated inhibitory effect and led to a significant enhancement in BKV TAg expression.
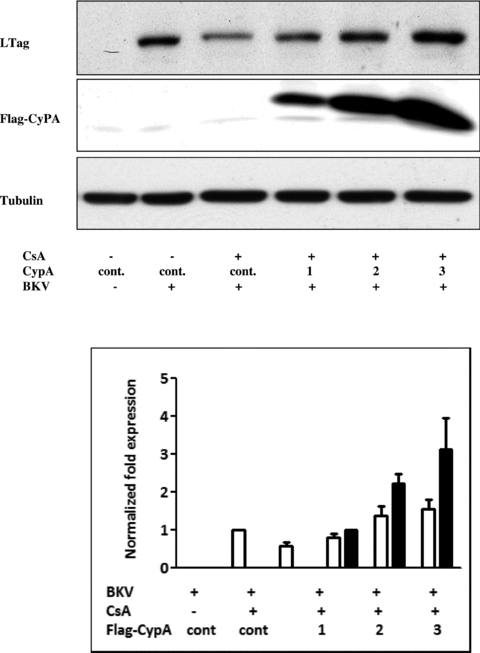
The suppressive effect of CsA on BKV TAg expression was attenuated by overexpression of CypA. Cells were transfected with different concentrations (1–3 μg/mL) of plasmids expressing flag-tagged CypA or an empty control vector. Cells were then infected with the BKV (1.0 × 10⁶ copies/mL) in the presence or absence of CsA (1 μg/mL) under serum-free condition for 72 h. Cell lysate was subjected to Western blot analysis to determine BKV TAg expression (A) or BKV DNA copies (B). The density of each protein band (TAg: white bar, flag-tagged CypA: black bar) was normalized with that of tubulin and the fold changes compared to the control were displayed in the lower panel. One experiment representative of three individual replicate experiments is shown.
NFAT is crucial for BKV replication
Since NFAT is a major downstream transcription factor of the cyclophilin/calcineurin complex (30), we therefore assessed whether NFAT plays a role in BKV replication. Results demonstrated that NFATc3 and NFATc4 were prominently expressed in HK-2 cells, whereas NFATc1 and NFATc2 were weakly detected in cells (data not shown). To clarify the effect of NFATc3 and NFATc4 on BKV replication, NFATc3 or NFATc4 was overexpressed overnight, followed by addition of BKV to cells. The result demonstrated that overexpression of NFATc3 enhanced BKV TAg expression (Figure 5A). Similarly, NFATc4 overexpression also facilitated BKV TAg expression (Figure 5B). These results indicate that there is a stimulatory effect of NFATc3 and NFATc4 on BKV replication.

NFAT overexpression enhanced BKV TAg and the BKV NCCR activity. (A and B) Cells were transfected with plasmids expressing NFATc3 (A) or NFATc4 (B) overnight and then infected with the BKV (1.0 × 10⁶ copies/mL) for further 72 h. Cell lysate was subjected to Western blot analysis to determine BKV TAg expression. The density of each protein band (TAg: white bar, flag-tagged NFATc3 or NFATc4: black bar; total NFATc3 or NFATc4: gray bar) was normalized with that of tubulin and the fold changes compared to the control were displayed in the lower panel. (C and D) The NCCR firefly luciferase reporter vector (1 μg/mL) in early (C) or late orientation (D), the Renilla luciferase vector (1 μg/mL), the plasmids expressing NFATc3 (3 μg/mL) (gray bar) or NFATc4 (3 μg/mL) (black bar) or the control vector (white bar) were cotransfected into HK-2 cells overnight. Cells were grown under serum-free condition for further 48 h. Luciferase assays were then performed on duplicate samples and the firefly luciferase activity was normalized to that of Renilla luciferase activity. The results were obtained from four independent experiments (*p < 0.05).
BKV NCCR is the main regulatory region of BKV replication. To assess whether NFAT can regulate BKV NCCR, plasmids expressing NFATc3 or NFATc4 and the BKV NCCR luciferase reporter in early or late orientation were cotransfected in cells. NFATc3 or NFATc4 overexpression led to an increase in promoter activity of the BKV NCCR luciferase reporter in early orientation, reaching a 2.9- or 3.4-fold increase respectively when compared with that of the mock transfection (Figure 5C). Similarly, the activity of the late NCCR promoter reporter was increased 2.5- or 2.7-fold, respectively, by NFATc3 or NFATc4 overexpression (Figure 5D).
To assess whether NFAT can bind to the BKV promoter, cells were transfected with the plasmids expressing BKV NCCR (Figure 6A) or infected with BKV (Figure 6B) for 48 h and chromatin was then immunoprecipitated with anti-NFATc3 or anti-NFATc4 antibody followed by qPCR to quantify the binding of the viral promoter to NFATc3 or NFATc4. Results of the ChIP assay demonstrated that the levels of the BKV promoter DNA binding to NFATc3 and NFATc4 were increased 2.1- and 1.9-fold, respectively, by transfection with the plasmids expressing BKV NCCR or increased 1.6- and 1.5-fold respectively by BKV infection when compared to that of the DNA immunoprecipitated with a nonspecific IgG antibody (Figures 6A and B). To support the results of the ChIP assay, we performed EMSA by in vitro mixture of recombinant NFATc3 or NFATc4 proteins and 32p-labelled double-stranded DNA (BKV NCCR) prior to gel shift analysis. Results clearly demonstrated an increase in binding of NFATc3- (Figure 6C) and NFATc4 (Figure 6D) with BKV NCCR.
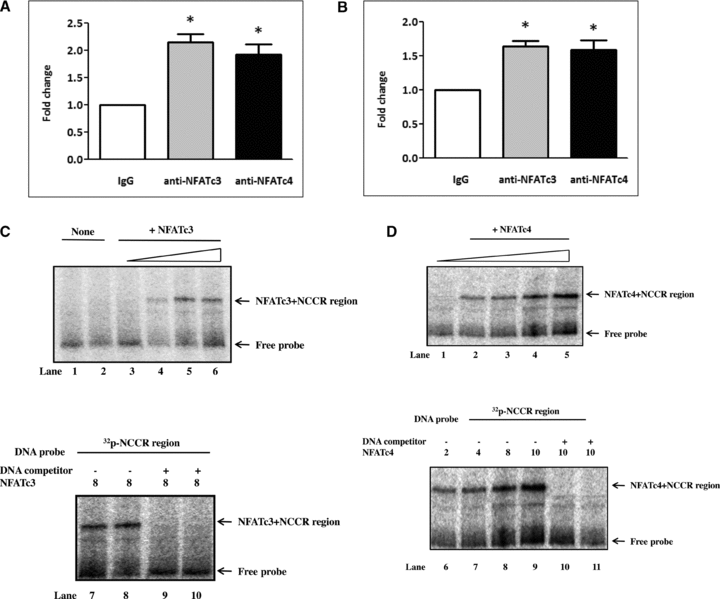
NFAT binds to the BKV promoter. (A and B) Cells were transfected with the plasmids expressing the BKV NCCR (A) or infected with BKV (1.0 × 10⁶ copies/mL) (B) for 48 h. Cells were then subjected to the ChIP assay described in the Materials and Methods section. Immunoprecipitated DNA by anti-NFATc3 (gray bar), anti-NFATc4 (black bar) or a nonspecific IgG antibody (white bar) was quantified by qPCR using primers detecting the BKV NCCR. Results are expressed as the relative fold increase of the NFATc3 or NFATc4-associated DNA over that of the nonspecific IgG control, which is arbitrarily set to one. All data are represented as mean ± SE from four independent experiments (*p < 0.05). (C and D) Interaction of NFATc3, NFATc4 with BKV noncoding control region was assessed by EMSA. Binding complexes were separated using 6% nondenaturing PAGE as described in the Materials and Methods section. Labeled double-stranded oligonucleotides, NCCR, were mixed with purified recombinant NFATc3 (C) in the final concentration of 0, 2, 4, 8 μg/μL (lanes 3 and 6) and recombinant NFATc4 in the final concentration of 0, 2, 4, 8, 10 μg/μL (D: lanes 1 and 5). GST protein was used for a negative control shown as ‘none’ (C: lanes 1 and 2). In the parallel experiments, NCCR oligonucleotides were mixed with 8 μg/μL of purified recombinant NFATc3 or NFATc4 in the presence (C: lanes 9 and 10; D: lanes 10 and 11) or absence (C: lanes 7 and 8; D: lanes 6 and 9) of 100× unlabeled NCCR oligonucleotides as competitors.
To further verify the role of NFAT in BKV replication, NFATc3 expression was suppressed by NFATc3 siRNA and cells were then infected with BKV. Western blot analysis showed that knockdown of NFATc3 expression reduced BKV TAg expressions (Figure 7A). Similarly, knockdown of NFATc3 by siRNA also reduced the promoter activity of the BKV NCCR luciferase reporter (Figure 7B). These data confirm that NFAT are essential for BKV replication.
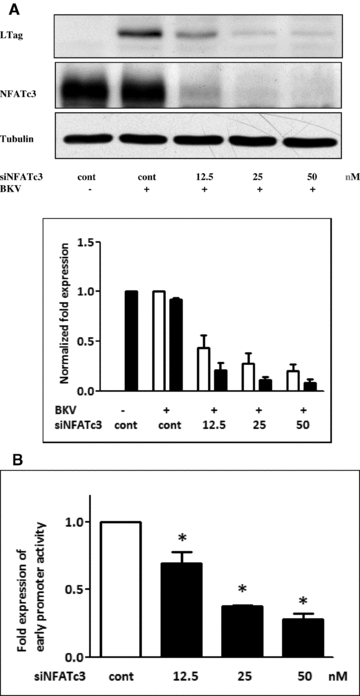
Inhibition of NFATc3 reduced BKV TAg expression. (A) Cells were transfected with NFATc3 siRNA at different concentrations (12.5–50 nM) overnight. Cells were then infected with the BKV (1.0 × 10⁶ copies/mL) for further 72 h under serum-free condition. Cells were transfected with scramble siRNA as the control (50 nM). Cell lysate was subjected to Western blot analysis to determine BKV TAg expression. The density of each protein band (TAg: white bar, NFATc3: black bar) was normalized with that of tubulin and the fold changes compared to the control were displayed in the lower panel. One representative result of Western blot analysis from three individual replicate experiments is shown. (B) Cells were transfected with NFATc3 siRNA at different concentrations (12.5–50 nM) or scramble siRNA overnight. The NCCR firefly luciferase reporter plasmid and the Renilla luciferase plasmid were cotransfected into HK-2 cells for further 48 h. The firefly luciferase activity was normalized to that of Renilla luciferase activity. The results were obtained from three independent experiments (*p <0.05 vs. the control).
CsA-mediated inhibition of BKV replication was rescued by NFAT overexpression
CsA inhibits calcineurin activity and causes NFAT phosphorylation that inactivates NFATs and prevents subsequent nuclear translocation to trigger transcription of target genes in immune cells (31). To appreciate whether CsA can cause NFATc3 phosphorylation and then inactivate NFATc3 in HK-2 cells, CsA was added to HK-2 cells for 24 h. NIM811, a CsA derivative, which cannot inhibit calcineurin activity and cause NFAT activation, was used as a control. The results revealed that the administration of CsA led to slow migration of NFATc3, indicating phosphorylation and inactivation of NFATc3 activity by CsA (Figure 8A). In contrast, the addition of NIM811 did not result in slow migration of NFATc3, implying the lack of an inhibitory effect on NFATc3 activity. Interestingly, while CsA suppressed BKV TAg expression, NIM811 did not alter BKV TAg expression (Figure 8A). This result suggests that NFATc3 activity is implicated in CsA-mediated suppression of BKV replication.


The suppressive effect of CsA on BKV TAg expression was attenuated by overexpression of NFATs. (A) Cells were infected with the BKV (1.0 × 10⁶ copies/mL) in the presence or absence of CsA (0.5–2 μg/mL) or NIM811 (0.5–2 μg/mL) for 72 h. Cell lysate was subjected to Western blot analysis to determine NFATc3 and BKV TAg expression. (B and C) Cells were transfected with different concentrations (1–2 μg/mL) of plasmids expressing flag-tagged NFATc3 (B) or NFATc4 (C) or an empty control vector overnight. Cells were then infected with the BKV (1.0 × 10⁶ copies/mL) in the presence or absence of CsA (1 μg/mL) under serum-free condition for 72 h. Cell lysate was subjected to Western blot analysis to determine BKV TAg expression or to qPCR for viral load (D). The density of each protein band (TAg: white bar, VP1: black bar, Flag-NFATc3/c4: gray bar) was normalized with that of tubulin and the fold-changes compared to the control were displayed in the lower panel. One experiment representative of three individual replicate experiments is shown. (E) The NCCR early promoter firefly luciferase reporter (1 μg/mL), the Renilla luciferase vector (1 μg/mL), the plasmids expressing NFATc3 (3 μg/mL) (gray bar) or NFATc4 (3 μg/mL) (black bar) or the control vector (white bar) were cotransfected into HK-2 cells overnight. Cells were incubated in the presence or absence of CsA (1 μg/mL) for further 48 h. The firefly luciferase activity was normalized to that of Renilla luciferase activity. The results were obtained from four independent experiments. (*p <0.05 vs. the control, #p<0.05 vs. the CsA group).
To verify the crucial role of NFATc3 in CsA-imposed suppression of BKV replication, NFATc3 was overexpressed in the presence of CsA. Western blot analysis showed that NFATc3 or NFATc4 overexpression diminished the inhibitory effect of CsA on BKV TAg expressions, while overexpression of the control vector did not reverse CsA-mediated inhibition of BKV TAg expression (Figures 8B and C) and viral load (Figure 8D). In addition, NFATc3 or NFATc4 overexpression even surpassed the CsA-induced reduction in the BKV early promoter activity (Figure 8E). These results suggest that NFAT is essential mediators in CsA-mediated suppression of BKV replication.
NFAT expression is increased in PVAN
Since NFAT is crucial for BKV replication, NFATc3/NFATc4 expression in renal biopsy specimen obtained from two patients with PVAN was assessed. Results of immunohistochemistry revealed that NFATc3/NFATc4 staining was prominently increased in the cytoplasm and nuclei of renal tubules and interstitial lymphocytes in the kidney of PVAN (Figures 9B and F; NFATc4 staining: not shown) when compared with that of the normal control (Figures 9A and E). PVAN was confirmed as BKV TAg expression was detected in the tubules (Figures 9D and G).

NFATc3 expression is increased in PVAN. NFATc3 expression (B and F, brown staining) and BKV TAg expression (D and G, dark brown staining) in the renal biopsy specimen obtained from PVAN patients were assessed by immunohistochemistry described in the Materials and Methods section. A negative control of the same specimen was performed using only the secondary antibody with omission of the primary antibody (anti-NFATc3) (C). Normal tissues cut from residual kidney specimen obtained from a nephrectomized patient with renal cell carcinoma were used as the control and stained for NFATc3 expression (A and E). Magnification: ABCD 400×, EFG 1000×.
Discussion
In this study, we demonstrate the importance of cyclophilin in regulation of both BKV early and late replication in HK-2 cells as knockdown of CypA-inhibited BKV LTag and VP1 expression. While CypA knockdown substantially suppressed BKV LTag and VP1 expressions, knockdown of CypB did not prominently affect BKV LTag and VP1 expression. Cyclophilins have been identified to play a crucial role in HIV and HCV replication (7,28,32–35). Watashi et al. have found that inhibition of either CypA or CypB expression suppresses HCV replication (12,28). In contrast, Yang et al. have recently revealed that knockdown of CypA, but not of CypB and CypC expression reduces HCV replication (35). Our study suggests that CypA is the principle cyclophilin member for regulation of BKV replication in renal proximal tubular cells.
We demonstrated that knockdown of NFATc3 abrogated BKV TAg expression and reduced the BKV early promoter activity. In addition, overexpression of either NFATc3 or NFATc4 promoted BKV TAg expression and augmented BKV NCCR early and late promoter activity. Furthermore, NFATc3 and NFATc4 binding to the BKV promoter was verified by the ChIP assay and EMSA. Our results substantiate a critical role of NFAT for BKV TU strain replication. Interestingly, Jordan et al. recently discovered three NFAT binding sites on the promoter of the BKV Dunlop strain (36). They demonstrate that overexpression of NFATc3 or NFATc4 in Vero cells augments the viral promoter activity. Mutational analysis reveals that these binding sites are essential for regulation of BKV transcription. The essential role of NFAT in viral replication has been reported in other viruses. Romanchikova et al. showed that NFATc1 and NFATc2 binding to HIV LTR enhanced HIV replication (37). Manley et al. have shown that NFATc3 is indispensable in JC virus (JCV) infection in glial cells as inhibition of NFATc3 by a NFAT peptide inhibitor reduced JCV promoter activity (38). In this study, renal histology of PVAN displayed an increase of NFATc3/c4 expression in renal tubules and lymphocytes. We speculate that increased NFATc3 expression in renal tubules may augment BKV replication and enhance the development of PVAN.
Previously we have shown that CsA can suppress BKV replication as the addition of CsA to the BKV-infected cells reduces BKV LTag expression (14). In this study, we further demonstrated that overexpression of CypA attenuated the suppressive effect of CsA on BKV TAg expression, which suggests anti-BKV effect of CsA requires inhibition of CypA activity. Several studies have demonstrated the essential role of cyclophilins in CsA-imposed inhibition of viral replication. Nakagawa et al. show that inhibition of HCV replication by CsA is through blockade of the activities of cyclophilins including CypA, CypB and CypC (29). Yang et al. also identified that CypA plays an essential role in CsA-resistant HCV infection (35). CypA is also a critical mediator in CsA-associated suppression of HIV, as the inhibitory effect of CsA on HIV replication results from CsA-induced disruption of the interaction between HIV Gag polyprotein and CypA (7). In accordance with these findings from other viruses, our results also suggest that CypA is critical for CsA-mediated suppression of BKV replication.
In this study, CsA, which caused phosphorylation of NFAT and inhibited NFAT activation, similar to the finding in COS-7 cells (39), suppressed BKV replication. In contrast, NIM811, which did not affect phosphorylation of NFAT and block NFAT functionality, failed to suppress BKV replication. Importantly, the overexpression of NFATc3 or NFATc4 attenuated the CsA-mediated inhibitory effect on BKV TAg expression. Moreover, NFATc3 or NFATc4 overexpression even surpassed the CsA-imposed reduction in the BKV early promoter activity. These findings indicate that NFAT is essential for the CsA-associated anti-BKV effect. It has been documented that CsA substantially interferes with the transcriptional activity of HIV mediated by NFAT in human CD4 T cells (22). Manely et al. report that CsA suppresses human polyomavirus JC (JCV) replication through blockade of NFAT4 activation (38). They identify a NFAT binding site as an enhancer in the early region of the JCV promoter, which is also conserved in the BKV promoter (38). In contrast, Jordan et al. identify three NFAT binding sites (GGAAA) in the triplicate P regions of the BKV Dunlop promoter and two of these are potential repressors (36). The BKV archetype strain also has three NFAT binding sites in the P, Q and R regions. Compared to the BKV archetype stain, the BKV TU strain has the rearranged NCCR containing the intact P- and Q-regions followed by a partial depletion of the R region and a duplication of a partial P–Q–R region (40). However, we also find three NFAT binding sites in the P, Q and R regions of the BKV TU promoter. Interestingly, despite the rearrangement of BKV NCCR, BKV archetype, Dunlop and TU strains all have three NFAT binding sites. Just which NFAT binding sites are the main regulatory sites in CsA-mediated suppression of BKV replication requires further elucidation.
The proposed mechanism regarding how CsA suppresses BKV replication is summarized in Figure 10. CypA is required in CsA-imposed inhibition of BKV replication since CypA overexpression can rescue this inhibitory response. In addition, NFATc3/c4, the calcineurin downstream mediator, can bind to the BKV NCCR to promoter viral replication. CsA, which blocks calcineurin activity, causes inhibition of dephosphorylation of NFAT, thus inhibiting NFAT functionality and preventing NFAT-mediated enhancement of BKV replication. Nevertheless, unlike CsA, knockdown of the CypA expression did not affect dephosphorylation of NFATc3 and the binding of NFATc3 to the BKV NCCR was not altered by administration of CypA siRNA (data not shown), suggesting an NFAT-independent role of CypA in BKV replication. Whether CsA also affects the CypA-dependent but NFAT-independent pathway (dash line in Figure 10) to regulate BKV replication requires further elucidation.

Schematic summary depicts a proposed mechanism of the inhibitory effect of CsA on BKV replication. NFATc3/c4, the calcineurin downstream mediator, can bind to the BKV NCCR to promoter viral replication. Administration of CsA blocks endogenous CypA/CaN function and leads to inhibition of dephosphorylation of NFAT, thus inhibiting NFAT functionality and preventing NFAT-mediated enhancement of BKV replication; CaN = calcineurin; CsA = cyclosporin; CypA = cyclophilin A; NFAT= nuclear factor of activated T cells.
Several studies have demonstrated that tacrolimus, mycophenolic acid or steroids substantially increases the risk of BKV replication when compared with CsA (41–44) but it is the net immunosuppressive status of the host that determines the development of PVAN. Although CsA can suppress BKV replication in the in vitro culture, the rationality of shifting to CsA-based immunosuppressants in renal transplant patients with PVAN still remains controversial due to side effects including nephrotoxicity and development of renal fibrosis (45). Since calcineurin/cyclophilin has functional diversity in regulating cell bio-functions and dephophorylates not only NFAT but also many intracellular proteins (17), CsA therefore blocks NFAT functionality as well as other important cell biological activities (46). Specific therapeutic agents targeting against CypA and NFAT may provide new potential anti-BKV treatment.
In conclusion, this study demonstrates an essential role of CypA and NFATc3 in BKV replication. CsA suppresses BKV replication through inhibition of CypA and NFAT functionalities.
Acknowledgments
This study was supported by grants (NMRPD190372, NMRPG596042) from the National Science Council of Taiwan and grants (CMRPG381062, CMRPG390921) from the Chung Gang Medical Research Project to Dr. Y.-C.T. and Dr. I.-J.L.
Disclosure
The authors of this manuscript have no conflicts of interest to disclose as described by the American Journal of Transplantation.


