Predictors of Success in Conversion from Calcineurin Inhibitor to Sirolimus in Chronic Allograft Dysfunction
Abstract
Chronic allograft dysfunction (CAD) is a major cause of graft loss in long-term kidney transplant recipients. To identify predictors of successful conversion from calcineurin inhibitor (CNI) to sirolimus (SRL) we investigated 59 renal transplant patients with CAD without histological signs of acute rejection. They received 12–15 mg SRL once, then 4–5 mg/day, target trough level 8–12 ng/mL. CNI dose was reduced by 50% simultaneously, and withdrawn at 1–2 months. Concomitant immunosuppression remained unchanged. After 1 year patient survival was 100% and graft survival 92%. In responders (54%) creatinine improved (2.75 ± 0.75 to 2.22 ± 0.64 mg/dL; p < 0.01). In nonresponders (46%) creatinine deteriorated (3.15 ± 1.02 to 4.44 ± 1.60 mg/dL; p < 0.01). Baseline renal function did not differ, however, baseline proteinuria (519 ± 516 vs. 1532 ± 867 mg/day, p < 0.01), histological grade of chronic allograft nephropathy (CAN) (1.2 ± 0.5 vs. 1.9 ± 0.6; p < 0.01), grade of vascular fibrous intimal thickening (1.2 ± 0.7 vs. 1.7 ± 0.7; p = 0.048) and number of acute rejections before conversion (0.73 ± 0.69 vs. 1.27 ± 0.96; p < 0.05) differed significantly between responders and nonresponders. In a multivariate analysis low proteinuria was the only independent variable. Proteinuria below 800 mg/day has a positive predictive value of 90%. Proteinuria at conversion below 800 mg/day is the only independent predictor for positive outcome in conversion from CNI to SRL in CAD.
Abbreviations
-
- AZA
-
- Azathioprin
-
- CAD
-
- Chronic Allograft Dysfunction
-
- CAN
-
- Chronic Allograft Nephropathy
-
- CNI
-
- Calcineurin inhibitor
-
- CsA
-
- Cyclosporine A
-
- EPO
-
- Erythropoetin
-
- GFR
-
- Glomerular filtration rate
-
- MMF
-
- Mycophenolate Mofetil
-
- SRL
-
- Sirolimus, Rapamycin
-
- Tac
-
- Tacrolimus
Introduction
The use of calcineurin inhibitors (CNI) like Cyclosporine A (CsA) and Tacrolimus (Tac) to prevent rejection has led to a substantial improvement in renal transplant results. However, CNI is also known to play an important role in chronic allograft dysfunction (CAD) (1). CNI toxicity is the most common identifiable factor contributing to CAD, affecting 18% of patients with failing grafts (2,3). In addition, CNI-induced renal insufficiency of native kidneys is an important problem in other solid organ transplant recipients (4,5). Therefore, the use of antiproliferative drugs in combination with a reduction or withdrawal of CNI has become an interesting concept in treating CNI toxicity, leading to deterioration of renal allograft function.
Rapamycin (Sirolimus, SRL) is a macrolide antibiotic produced by Streptomyces hygroscopicus. It possesses immunosuppressive and antiproliferative properties (6) by blocking the proliferative responses of different cell types to growth factors through inhibition of the mTOR signal cascade. Thus, SRL inhibits the IL-2-induced lymphocyte proliferation, as well as the intima proliferation in the vasculature, which is a hallmark of chronic allograft rejection (6,7). These properties and the absence of nephrotoxicity (8,9) make SRL a promising alternative to CNI-based immunosuppression in renal transplant patients.
Multicenter trials have demonstrated the beneficial effects of CsA withdrawal in terms of improved renal function in de novo renal transplant patients initially receiving CsA, SRL and steroids (10,11). Several studies showed beneficial effects, feasibility and safety of CNI withdrawl and introduction of SRL for various reasons in heterogenous groups of chronic renal transplant patients (12–14).
The aim of the present study was to identify those patients who are likely to benefit from conversion from CNI to SRL, and to determine prognostic factors for a successful conversion in a large and uniform cohort of patients showing histological signs of chronic CNI toxicity. Additionally, we analyzed the safety and efficacy of conversion from CNI to SRL in a large prospective cohort of renal allograft patients.
Methods
In two centers all consecutive renal allograft recipients who met the inclusion criteria were converted from CNI-based immunosuppression to SRL-based immunosuppression. All patients gave informed consent and underwent biopsy of the kidney transplant. The inclusion criteria were: (a) gradually decreasing transplant function, (b) histological signs of chronic CNI toxicity, (c) the absence of histological signs of acute rejection and (d) renal transplantation at least 3 months prior to conversion. The biopsies were read by pathologists of local center immediately after they had been performed. The pathologists were not involved in the conversion protocol or in the clinical follow-up. As described by Racusen et al. (15), CNI toxicity was diagnosed if the biopsy showed tubular vacuolization, segmental arteriolopathy, arteriolar myocyte vacuolization and striped or diffuse interstitial fibrosis. Lesions suggestive of chronic allograft nephropathy (CAN) were graded according to the BANFF 97 classification (15). Double contours of capillary loops were interpreted as signs of transplant glomerulopathy according to Racusen et al. (15). Vascular lesions were graded according to Racusen et al. as well (15).
On day 1 SRL was given at a loading dose of 12–15 mg, from day 2 onward SRL was given at a dose of 4–5 mg qd. SRL whole blood trough concentrations were obtained weekly. The dose was adjusted to achieve a therapeutic range of 8–12 ng/mL. Simultaneously, the CNI dose was reduced by 50% on day 1, and then was tapered weekly by 20% as soon as the targeted therapeutic SRL trough concentration had been achieved. The other immunosuppressive medications remained unchanged. In order to reduce drug interaction, SRL was given 4 h after CsA. After complete CNI withdrawal SRL was administered in the morning (Figure 1).
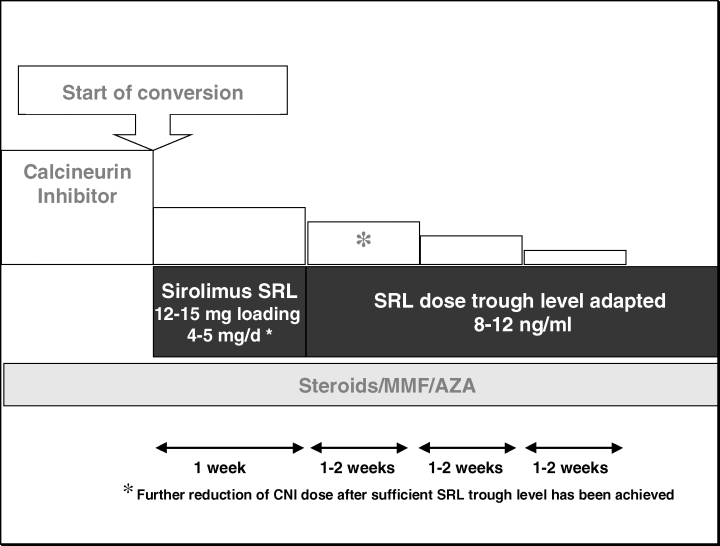
The calcineurin inhibitor Cyclosporine A or Tacrolimus was reduced to 50% of its original doses and then withdrawn over a time period of 4–6 weeks after a Sirolimus trough concentration of 8–12 ng/mL had been reached. Concomitant immunosuppressive medication remained unchanged.
Before conversion, patients were observed for at least 3 months. Patients were prospectively monitored on a regular basis. During the first 2 months follow-up visits were performed weekly, after that patients were monitored monthly unless visits were necessary on a shorter basis for adverse events or other medical reasons. Each follow-up visit included a physical exam, laboratory screening (red and white blood count, thrombocytes, renal and liver function tests, cholesterol, triglycerides), SRL trough concentration, and ultrasound scan of the transplant kidney. Adverse events were recorded during each visit. In case of suspected rejection, a second renal biopsy was performed in addition to the initial biopsy before conversion. SRL blood trough concentrations were measured using a high-performance liquid chromatography assay with double mass spectrometry.
After 12 months stable renal function was defined as a difference in creatinine of less than 0.3 mg/dL compared with creatinine on day of conversion. Responders were defined as patients with stable or improved renal function at the end of the study. In addition, estimated glomerular filtration rate (GFR) was calculated using the formula developed by Cockcroft and Gault (16). Differences between subgroups were tested using the Mann-Whitney test. Data for 1/creatinine was plotted over time for each patient. The slopes of this curve were determined for the time before and after conversion separately. Mean slope of 1/creatinine versus time was calculated using the least squares method (17). Difference in slope before and after conversion was assessed using student's t-test for paired samples. Possible predictors of favorable outcome (age, gender, number of rejections prior to conversion, histological grade of CAN, presence of transplant glomerulopathy, percentage of sclerosed glomeruli, grade of vascular lesions, creatinine and proteinuria at conversion) were assessed by univariate (Chi-square, Mann-Whitney) and multivariate analysis (logistic regression). p < 0.05 was considered to be significant.
Results
A total of 59 renal transplant patients with CAD and histological signs of chronic CNI toxicity were converted from CNI-based to SRL-based immunosuppression (19 female, 40 male), aged 42.9 ± 1.8 (23–79) years. At conversion mean time after transplantation was 88.0 ± 7.2 (3–189) months. The number of rejections before conversion was significantly different between responders (0.73 ± 0.7) and nonresponders (1.27 ± 1.0; p < 0.05). All other demographic data listed in Table 1 did not differ. Immunosuppression before conversion (Table 2) consisted of low-dose corticosteroid and/or mycophenolate mofetil (MMF) or azathioprin (AZA) in combination with CNI (47 patients with CsA, 12 patients with Tac). Mean dose of CsA was 203 ± 7.8 mg/day (Tac 5.0 ± 0.8 mg/day); mean CsA trough concentration was 107 ± 4.0 ng/mL (Tac 5.0 ± 0.76 ng/mL). Five patients were converted less than 1 year after transplantation; all of them received Tac (mean dose 5.6 ± 3.2 mg/day; trough 9.3 ± 1.7 ng/mL).
| Responders (n = 32) | Nonresponders (n = 27) | |
|---|---|---|
| Age (year) | 51.5 ± 14 | 45.0 ± 12 |
| Female/Male | 9/23 | 10/17 |
| Mismatches | 2.67 + 1.8 | 2.40 ± 1.3 |
| Rejections before conversion | 0.73 + 0.7 | 1.27 ± 1.0* |
| Time after transplantation (months) | 80.2 ± 62 | 99.3 ± 47 |
- *p < 0.05 compared with responders. There were no further significant differences between responders and nonresponders for the criteria mentioned in this table.
| Immunosuppression consisted of | Number of patients | Doses |
|---|---|---|
| CNI plus | ||
| Steroids | 22 | 5.3 ± 2 mg/day |
| MMF | 9 | 1.6 ± 0.5 g/day |
| AZA | 4 | 44 ± 13 mg/day |
| Steroids and MMF | 14 | Ster. 5.7 ± 2 mg/day |
| MMF 1.1 ± 0.4 g/day | ||
| Steroids and AZA | 6 | Ster. 5.4 ± 1 mg/day |
| AZA 63 ± 21 mg/day | ||
| No concomitant immunosuppression | 4 | |
After a follow-up period of 12 months patient survival was 100% and graft survival 92%. Four grafts failed (two after 2 months, one after 4 months and one after 6 months) and hemodialysis was initiated. In the patients with failed grafts serum creatinine was 3.6 ± 1.3 mg/dL, estimated creatinine clearance 16.7 ± 12 mL/min, and proteinuria was 1301 ± 766 mg/day at conversion. Two of them had CAN grade 1 and two had grade 2; transplant glomerulopathy was present in two of these patients.
Overall slope of 1/creatinine was −7.5 ± 1.1 × 10⁻³ dL/mg/month before and −3 ± 1.0 × 10⁻³ dL/mg/month after conversion (p < 0.05). Kidney function improved or remained stable in 32 patients (54%); these patients were defined as ‘responders’. Kidney function further deteriorated in 27 patients (46%), these patients were defined as ‘non-responders’. In responders the slope changed from −7.9 ± 1.4 × 10⁻³ dL/mg/month to 2.6 ± 0.78 × 10⁻³ dL/mg/month (p<0.001), whereas in nonresponders it remained unchanged (−7.0 ± 1.4 ± 10−3 dL/mg/month before and −9.7 ± 1.7 × 10⁻³ dL/mg/month after conversion; p = n.s.) (Figure 2).
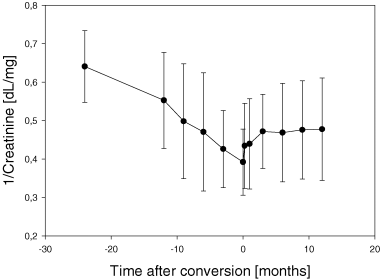
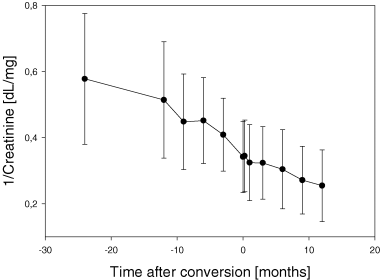
The Slope of 1/serum creatinine before conversion from calcineurin inhibitor-based immunosuppression to Sirolimus clearly shows a gradual time-dependent deterioration of renal function in responders as well as in nonresponders (A and B). However, after conversion renal function stabilized in responders represented by a reversal of slope of 1/serum creatinine from negative to positive in responders (A), whereas renal function further deteriorated in nonresponders, leaving the degree of loss of renal function over time unchanged (B). (A) responders; (B) nonresponders.
In order to identify potential outcome predictors we investigated several factors that might be associated with positive outcomes. Interestingly, renal function at baseline was not predictive for the success of conversion, although responders had slightly better renal function at baseline (responders creatinine 2.75 ± 0.75 mg/dL vs. nonresponders 3.15 ± 1.0 mg/dL, p = n.s.; or calculated GFR 31.3 ± 9 vs. 28.0 ± 12 mL/min, p = n.s.). Baseline proteinuria differed significantly between responders and nonresponders (519 ± 516 mg/day in responders vs. 1532 ± 867 mg/day; p < 0.01). While proteinuria did not increase significantly in responders (519 ± 516 to 729 ± 1014 mg/day; p = n.s.), it further increased in nonresponders despite the already higher baseline (1532 ± 867 to 2714 ± 1780 mg/day; p < 0.01) (Table 3). Histology data are provided in Table 4. Responders had a significantly lower grade of CAN (1.2 ± 0.5 vs. 1.9 ± 0.6; p < 0.01) and a significantly lower grade of vascular fibrous intimal thickening (1.2 ± 0.7 vs. 1.7 ± 0.7; p = 0.048) than nonresponders, while there was no significant difference for the presence of transplant glomerulopathy, percentage of sclerosed glomeruli or arteriolar hyaline thickening in responders and nonresponders.
| Responders (n = 32) | Nonresponders (n = 27) | |
|---|---|---|
| Creatinine at conversion | 2.75 ± 0.75 mg/dL | 3.15 ± 1.02 mg/dL |
| Creatinine after 12 m. | 2.22 ± 0.64 mg/dL* | 4.44 ± 1.60 mg/dL* |
| Calculated GFRat conv. | 31.3 ± 9.4 mL/min | 28.0 ± 12.2 mL/min |
| Calculated GFR after 12 m. | 39.6 ± 15.3 mL/min* | 20.3 ± 8.6 mL/min* |
| Proteinuria at conversion | 519 ± 516 mg/day | 1532 ± 867 mg/day** |
| Proteinuria after 12 m. | 729 ± 1014 mg/day | 2714 ± 1780 mg/day*** |
- *p < 0.01 compared to value at time of conversion.
- **p < 0.01 compared to responders at time of conversion.
- ***p < 0.01 compared to responders after 12 months.
| Responders (n = 32) | Nonresponders (n = 27) | |
|---|---|---|
| No CAN | 1 (3%) | 0 |
| CAN grade 1 | 22 (69%) | 6 (22%) |
| CAN grade 2 | 9 (28%) | 18 (67%) |
| CAN grade 3 | 0 | 3 (11%) |
| Mean grade of CAN | 1.2 ± 0.5 | 1.9 ± 0.6* |
| Presence of transplant glomerulopathy | 5 (16%) | 9 (33%) |
| Sclerosed glomeruli | 18 ± 18% | 35 ± 33% |
| Mean grade of vascular fibrous intimal thickening | 1.2 ± 0.7 | 1.7 ± 0.7** |
| Mean grade of arteriolar | 1.8 ± 0.9 | 2.1 ± 0.1 |
| hyaline thickening | ||
- *p < 0.01 compared to responders.
- **p = 0.048 compared to responders.
No significant difference of blood pressure before and after conversion was observed (140/83 mmHg before and 137/80 mmHg after conversion; p = n.s.), and there was no difference in the number of antihypertensives/patient before and after conversion (2.7 ± 1.6 before and 2.8 ± 1.8 after conversion; p = n.s.).
We performed a multivariate analysis in order to identify independent predictors for outcome. Out of the different variables tested (age, rejections prior to conversion, grade of CAN, grade of vascular fibrous intimal thickening, creatinine and proteinuria at conversion) proteinuria was the only significant independent factor (p = 0.003). The positive predictive value of proteinuria below 800 mg/day at conversion was 90%.
Secondary outcome measures included safety and efficacy of the conversion. Using our conversion scheme with a loading dose and a maintenance dose of 4–5 mg/day we were able to reach the target range in the majority of patients within the first week. Mean SRL trough level was 9.0 ± 5.8 ng/mL after 1 week. As expected, we observed a large variability between patients. Twenty-seven (46%) patients had a SRL blood concentration below 8 ng/mL after 1 week and nine (15%) had a blood concentration above 12 ng/mL after 1 week (Figure 3).
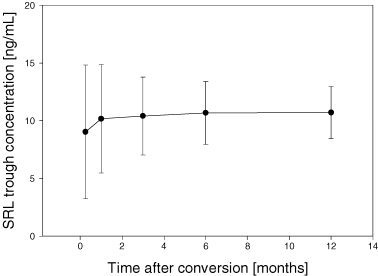
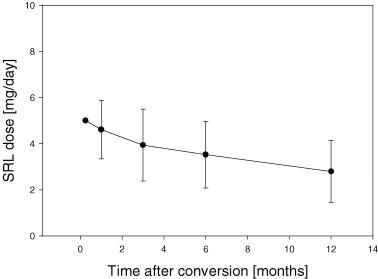
Sirolimus trough concentrations between 8 and 12 ng/mL could be achieved in most of the patients during the first weeks after conversion. The SRL dose needed in order to reach this concentration decreases over time from 5 mg/day at conversion to 2.8 ± 1.3 mg/day after 1 year. (A) SRL trough concentration; (B) SRL dosing.
During follow-up we observed only one biopsy-proven (BANFF Ia) mild rejection episode 7 months after conversion associated with subtherapeutic SRL trough concentration (5.7 ng/mL) at the time of rejection. The rejection could be controlled by steroid pulse therapy and did not result in deterioration of renal function.
No major infections occurred in our cohort. One patient developed bronchiolitis obliterans, the symptoms as well as radiological findings were fully reversible after stopping SRL treatment and introducing MMF. In seven patients SRL therapy had to be discontinued due to other reasons (4× hemodialysis, 1× bad taste of SRL solution, 1× recurrent nephrotic syndrome after withdrawal of CsA, 1× recurrent diarrhea).
The clinically most important adverse event was a significant decline of hemoglobin concentration. The mean hemoglobin concentration at conversion was 11.2 ± 1.4 g/dL versus 10.5 ± 1.4 g/dL after 1 month, p < 0.005. Erythropoetin (EPO) therapy had to be initiated in 38/59 (64%) patients. After initiation of EPO therapy hemoglobin reached baseline values again (10.9 ± 1.5 and 10.9 ± 1.4 g/dL after 6 and 12 months, respectively; p = n.s. compared to value at conversion) (Figure 5). Hypertriglyceridemia (173 ± 86 mg/dL at conversion vs. 233 ± 169 mg/dL after 1 year, p < 0.05; Figure 4A) and hypercholesterolemia (225 ± 43 mg/dL at conversion vs. 248 ± 53 mg/dL after 1 year, p < 0.05; Figure 4B) were also common adverse events. The following adverse events occurred with a frequency >5%: stomatitis (15/59; 25%), epistaxis without need for further intervention (7/59; 12%), thrombocytopenia (4/59; 7%) and diarrhea (4/59; 7%). In the four patients who suffered from diarrhea, no microbial agent could be detected. In three patients, diarrhea did not pose a serious clinical problem, however in one case it led to SRL withdrawal and consecutive recovery. Other SRL-associated adverse events such as exanthema (2/59; 3%), arthralgia (2/59; 3%), leucopenia (1/59; 2%), bronchiolitis obliterans (1/59; 2%), cough (1/59; 2%) or pneumonia (1/59; 2%), occurred with low frequency in this population.
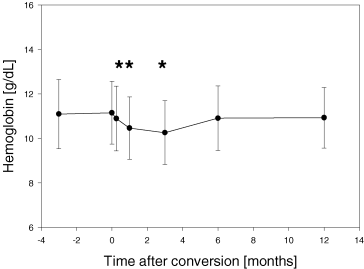
Hemoglobin concentration decreases significantly after conversion to Sirolimus. Erythropoetin treatment is needed in 38/59 patients (64%) in order to achieve pre-conversion hemoglobin concentrations. *p < 0.01 compared with value at conversion.
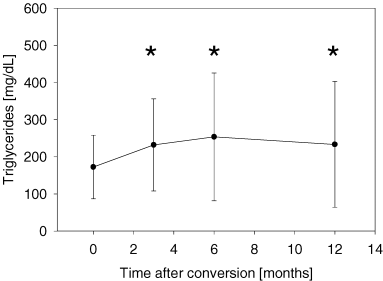
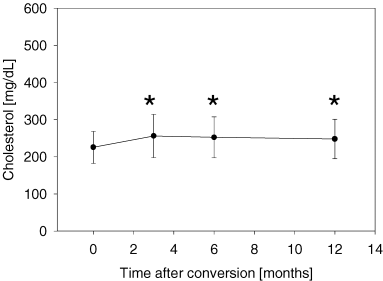
Triglyceride (A) and Cholesterol concentrations (B) increase significantly after conversion to Sirolimus. Seventeen of 59 patients (29%) required a modification of their pre-existing statin dose or initiation of statin therapy. (A) Triglycerides before and after conversion from calcineurin inhibitor-based immunosuppression to Sirolimus. *p < 0.03 compared with value at conversion. (B) Cholesterol before and after conversion from calcineurin inhibitor-based immunosuppression to Sirolimus. *p < 0.01 compared with value at conversion.
Discussion
This is to our knowledge the first study evaluating predictors of successful conversion from CNI-based to SRL-based immunosuppressive regimens in a large cohort of long-term renal transplant patients. In this consecutive cohort of 59 patients with CAD and histological signs of CNI toxicity, conversion to SRL achieved an improvement or stabilization of transplant function in 54% of patients. Interestingly, low proteinuria at time of conversion was the most important predictive factor for a beneficial outcome. In responders the beneficial effect persisted over the whole follow-up period of 1 year. No graft loss occurred in patients responding to conversion. Furthermore, our large prospectively monitored cohort confirms the safety of conversion; only one mild rejection episode was observed more than 6 months after conversion. Besides the well-known side effect of hyperlipidemia anemia is the most prominent side effect in this cohort of patients.
Our own data as well as other studies have shown that many patients benefit from CNI withdrawal and treatment with SRL. In multicenter trials in de novo kidney transplant recipients, initially receiving CsA, SRL and steroids; CsA withdrawal led to an improvement of renal function with no significant differences in rates of rejections and graft survival compared with patients continuing on CsA, SRL and steroids (10,11). In addition, several studies on conversion from CNI-based to SRL-based regimens in chronic kidney transplant patients were published. Promising results of a pilot study on conversion from CNI-based to SRL-based immunosuppression were published by Dominguez and co-workers (12). Twenty patients were converted from a CNI-based regime to a SRL-based protocol for various reasons, including 12 patients with CNI toxicity. A significant improvement of renal function was observed over the rather short follow-up period of 6 months. Egidi and co-workers converted a heterogeneous group of 64 transplant patients (kidney, kidney–pancreas, pancreas and liver) for various reasons (drug nephrotoxicity, hemolytic uremic syndrome and glucose intolerance) using a protocol with abrupt discontinuation of CNI, a SRL loading dose and adding two doses of Daclizumab to the regimen in some patients. They observed a significant improvement in serum creatinine, a resolution of HUS in all patients converted for HUS, and disappearance of glucose intolerance in the majority of patients converted for this reason. Two patients showed acute rejection due to noncompliance (13). Citterlo et al. converted 19 kidney transplant patients with progressive chronic renal allograft dysfunction from CNI to SRL using a protocol of rapid cessation of CNI the evening before introducing SRL without using a SRL loading dose. They observed amelioration or stabilization of renal function in 57% of patients. No acute rejection or major infections occurred (14). According to our own experiences and those made by Citterlo and Amm (18) in a considerable number of conversion patients renal transplant function further deteriorated. So far it had been difficult to identify those patients who would benefit from conversion. Our study is the first one identifying low proteinuria at time of conversion as the only predictive parameter of successful conversion in a multivariate analysis. The degree of structural damage prior to conversion appears to be an important predictor of success in conversion. This is reflected by the lower degree of CAN in responders at the time of conversion. The fact that responders had a lower number of rejections prior to conversion supports this conclusion as well. However, the degree of CAN and the prior number of rejections are not of additional predictive value for successful conversion compared to proteinuria.
Compared to CNI withdrawal studies without introduction of SRL we observed a very low number of rejections during or after conversion (19). In contrast to our data with SRL, CNI dose reduction or withdrawal from a regimen consisting of cyclosporine, prednisone, and AZA is associated with an incidence of acute rejection of 10–40% (20). This risk is lower when MMF is used instead of AZA. However, in a prospective, randomized study to evaluate the discontinuation of cyclosporine using a double therapy of corticosteroids and mycophenolate mofetil CsA withdrawal was still associated with acute rejections in approximately 10–15% of patients (21). In a comparative study, discontinuation of CsA with a double therapy of either AZA or MMF with steroids resulted in a rejection rate of 37% in the AZA group and 12% in the MMF group (22).
Therefore, conversion to SRL in patients with low proteinuria permits a promising treatment with a high probability of success and a high level of safety in terms of number of rejections during and after the conversion process.
The drawback of the study is the rather heterogeneous group of patients in terms of age, time of conversion after transplantation and concomitant immunosuppressive therapy; however, it is a prospective and consecutive group of patients.
This study might be a step toward finding a treatment algorithm for patients with CAD. However, further studies evaluating more homogeneous populations and searching for additional predicting factors are necessary.
Main adverse events were anemia and hyperlipidemia. Anemia improved after EPO therapy. Anemia is likely to be a result of renal insufficiency, the SRL-induced antiproliferative (23) and apoptotic effect on blood cells (24). In addition to this anemia might be an effect of high doses of MMF in some of our patients. Most probably thrombocytopenia and leucopenia might be interpreted in the same way. Kahan and co-workers also reported anemia to be a SRL-specific side effect (25). One patient developed SRL-associated bronchiolitis obliterans. This condition of interstitial pneumonitis associated with the application of SRL had also been seen by Morelon et al. (26) and Dominguez and co-workers (10). Several patients developed arthralgia shortly after conversion, which might be attributed to the influence of SRL on osteoblasts (8) and osteoclast (9). Interestingly buccal ulcers only occurred during the first phase of conversion when patients still received CNI and SRL simultaneously. According to van Gelder and co-workers overimmunosuppression, lack of antiviral prophylaxis and SRL application as a solution might be possible explanations (27).
Most of the adverse events occurred during the conversion. This phase of overlap of CNI and SRL possibly constitutes a phase of overimmunosuppression. Therefore, for future protocols of CNI conversion to SRL we could imagine to shorten the overlap phase, thus, shortening the time span with potential overimmunosuppression. A possible conversion scheme to avoid overimmunosuppression could be the reduction of CNI dose to 50% on day 1, to 25% on day 8 (provided that a sufficient SRL trough concentration has been achieved) and complete withdrawal on day 15. However, this needs to be evaluated in future studies.
We conclude that conversion from CNI to SRL-based immunosuppression in CAD is safe, and proteinuria below 800 mg/day at time of conversion is the best predictor for successful conversion to SRL-based immunosuppression as assessed in a multivariate analysis. In this setting proteinuria at time of conversion seems to be an easily accessible surrogate parameter for the extent of pre-existing structural damage of the kidney.


