ADAPTATION AND MALADAPTATION IN SELFING AND OUTCROSSING SPECIES: NEW MUTATIONS VERSUS STANDING VARIATION
Abstract
Evolution of selfing from outcrossing recurrently occurred in many lineages, especially in flowering plants. Evolution of selfing induces dramatic changes in the population genetics functioning but its consequences on the dynamics of adaptation have been overlooked. We studied a simple one-locus model of adaptation where a population experiences an environmental change at a given time. We first determined the effect of the mating system on the genetic bases and the speed of adaptation, focusing on the dominance of beneficial mutations and the respective part of standing variation and new mutations. Then, we assumed that the environmental change is associated with population decline to determine the effect of the mating system on the probability of population extinction. Extending previous results, we found that adaptation is more efficient and extinction less likely in outcrossers when beneficial mutations are dominant and codominant and when standing variation plays a significant role in adaptation. However, given adaptation does occur, it is usually more rapid in selfers than in outcrossers. Our results bear implications for the evolution of the selfing syndrome, the dynamics of the domestication process, and the dead-end hypothesis that posits that selfing lineages are doomed to extinction on the long run.
Although the majority of eukaryotes reproduce sexually via outcrossing, selfing (at least partial) is common in many groups, especially in angiosperms (Igic and Kohn 2006) but also in animals (Jarne and Auld 2006). In plants, the transition from outcrossing to selfing has been recognized as a major evolutionary trend that recurrently occurred (e.g., Darwin 1876, 1878; Stebbins 1974). Selfing can evolve from outcrossing thanks to two main advantages: reproductive assurance under pollen limitation, such as in pioneering plants colonizing new habitats (Baker 1955), and the twofold transmission of genes (Fisher 1941). Inbreeding depression opposes these advantages and explains the maintenance of outcrossing (reviewed in Charlesworth 2006). However, the increase in homozygosity in selfing populations will lead to the expression and the elimination of many recessive deleterious mutations by selection (Lande and Schemske 1985), which should purge their inbreeding depression. This is the reason why, once self-fertilization has evolved, reversion to outcrossing is, in theory, very unlikely: after purging, inbreeding depression is expected to be too low to overcome the advantages of selfing. Moreover, outcrossing is commonly ensured by complex mechanisms such as self-incompatibility (SI) systems involving pollen–pistil recognition at the molecular level. Breakdown of such systems, allowing evolution of self-fertilization, are thus much more frequent than the evolution of new complex SI systems. Accordingly, unilateral transitions have been documented in several studies (e.g.,Takebayashi and Morrell 2001; Igic et al. 2006; Escobar et al. 2010). Although transitions toward selfing seem to be mainly unidirectional, the vast majority of species are outcrossing. This requires lower diversification (i.e., speciation – extinction) rates in selfing clades (for self-compatibility see Igic et al. 2008), which should be evolutionary dead-ends, as initially suggested by Stebbins (1957). Supporting this view, most selfing lineages are of recent origin (Takebayashi and Morrell 2001) and it has been recently showed in Solanaceae that self-compatible species have higher extinction rates than self-incompatible ones (Goldberg et al. 2010).
Nevertheless, the underlying causes of such an evolutionary dead-end are still unclear. On one hand, selfing reduces effective population size, Ne, by two because of nonindependent gamete sampling during reproduction (Pollak 1987; Nordborg 1997), which reduces the efficacy of selection. On the other hand, selfing also exposes alleles in homozygotes, facilitating selection. Both effects exactly compensate for intermediate dominance, whereas selection is more (resp. less) efficient in selfing than in outcrossing for recessive (resp. dominant) alleles (Caballero and Hill 1992; Charlesworth 1992; Pollak and Sabran 1992). However, Ne is expected to be reduced beyond the twofold automatic effects (1) by genetic hitchhiking effects (Maynard-Smith and Haigh 1974; Charlesworth et al. 1993a), because effective recombination is low in selfers (Nordborg 2000) and (ii) by recurrent bottlenecks that are expected to be more frequent in selfers because a single seed can found a new population (Schoen and Brown 1991; Ingvarsson 2002). If Ne is significantly reduced beyond the twofold threshold, selfing lineages should be prone to the accumulation of deleterious mutations (Glémin 2007). This hypothesis has been tested in several species through molecular phylogenetic approaches, and no signature of relaxed selection in selfers has been found so far (Wright et al. 2002; Cutter et al. 2008; Haudry et al. 2008; Escobar et al. 2010). This suggests that selfing could be of too recent origin and that the accumulation of deleterious mutation would not be the main cause of their extinction, contrary to what is observed in clonal species (reviewed in Glémin and Galtier 2012). Reduced adaptive potential in selfers is the other major—and the first initially proposed—cause underlying the dead-end theory (Stebbins 1957). However, it is still not clear how selfing affects the dynamics of adaptation. Despite ongoing developments, most models of the adaptation process are based on panmictic populations and selfing has only been taken into account in the simplest ones, mainly the adaptation from new mutations at one locus (e.g., Caballero and Hill 1992; Charlesworth 1992; Roze and Rousset 2003; Glémin 2007). However, it is increasingly recognized that standing variation could play a significant role in adaptation (Orr and Betancourt 2001; Hermisson and Pennings 2005; Barrett and Schluter 2008; Pritchard et al. 2010). Interestingly, Stebbins arguments relied on the idea that selfing species have reduced polymorphism, and thus lower adaptive opportunities from standing variation (Stebbins 1957, 1974).
A better understanding of the dynamics of adaptation in selfing species would also be useful in other contexts for which theoretical clarification is needed. For instance, the effect of selfing versus outcrossing on the dynamics of adaptation during the domestication process has been questioned in this particular case: contrary to the arguments of the dead-end hypothesis, selfing could have facilitated adaptation during domestication by favoring the fixation of recessive traits (Zohary and Hopf 2000; Diamond 2002; Glémin and Bataillon 2009). A shift toward selfing is also commonly associated with the evolution of specific traits (the so-called selfing syndrome), such as flower size reduction and lower investment in the male function (reviewed in Sicard and Lenhard 2011), sometimes over a short time scale, as in Capsella rubella (Foxe et al. 2009; Guo et al. 2009), or Leavenworthia alabamica (Busch et al. 2011), although it is not clear if this is simply due to the relaxation of constraints on reproduction or to the adaptation toward a new optimum of resource allocation. Moreover, the genetic bases of selfing syndrome evolution are not well understood, partly because the selfing rate evolves with the evolution of these traits (for instance see discussion in Fishman et al. 2002). Investigating the dynamics of adaptation following the shift in mating systems would help in resolving these issues.
The aim of this article is to predict whether the genetic bases of adaptation vary with mating systems and how selfing may affect the adaptive potential of the species. Especially, can a lack of adaptation doom selfing species to extinction, as assumed by the dead-end hypothesis? Here, we focus on the simplest case of adaptation: the fixation of a beneficial allele at a single locus. We extend previous models (Hermisson and Pennings 2005; Orr and Unckless 2008) by including partial selfing and scenarios specific to selfing species.
General Formulation
We consider a single population of size N, with a selfing rate σ, and nonoverlapping generations. Except when explicitly mentioned, the population size and the selfing rate are assumed to be constant. Following Hermisson and Pennings (2005), we consider that this population experiences an environmental change at some time that changes the selection regime at a given biallelic locus. At this locus, the “wild” allele A mutates with rate u to a new allele, a, which is beneficial after the environmental change. Allele a could be initially present, but not fixed, before the environmental change and was either neutral or deleterious. The three genotypes, AA, Aa, and aa have the relative fitness 1, 1 –hdsd, and 1 –sd before, and 1, 1 +hbsb, and 1 +sb after the environmental change, where sd and sb stand for the deleterious and beneficial selection coefficients and hd and hb for the dominance coefficients. Back mutations are neglected. As we consider a single locus, we assume that, during the adaptation process, there is no interference between mutations because of linkage or epistasis.
 (1)
(1) is Wright's fixation index (Pollak 1987; Caballero and Hill 1992) and α summarizes the hitchhiking and demographic effects of selfing that reduce the effective population size beyond the automatic twofold effect (Glémin 2007). α= 1 for σ= 0 and 0 < α≤ 1 otherwise. For instance, Ne can be reduced because of the recurrent elimination of strongly deleterious mutations, the so-called background selection process (Charlesworth et al. 1993a): considering a focal locus, the effective number of gametes contributing to future generations is reduced because those carrying deleterious alleles cannot remain on the long run. Background selection can thus be strong in selfing species where recombination is ineffective to breakdown the associations with deleterious alleles. Under the background selection model, α can be written as
 (2)
(2)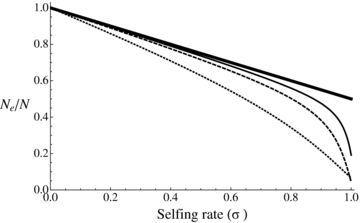
Ne/N ratio as a function of selfing rate under background selection as given by equation (2). Bold line: no background selection. Thin line: U= 0.2, C= 5. Dashed line: U= 0.5, C= 5. Dotted line: U= 0.5, C= 1, H= 0.2, and S= 0.1.
First, we study the genetic bases and the time for adaptation and we assume that the population size remains constant. In the last part, we study the probability of extinction due to a lack of adaptation following the method proposed by Orr and Unckless (2008). We assume that the population exponentially declines after the environmental change and that it either goes extinct or is rescued by the fixation of the appropriate beneficial mutation (see below). We derive analytical approximations, especially by extending previous results obtained for panmictic populations (Hermisson and Pennings 2005; Orr and Unckless 2008) to the case of partially self-fertilizing ones. We thus directly give the results in the main text and the details are dispatched in Supporting information Material. To make the article self-contained, we also summarize useful previous results obtained by other authors. All notations are summarized in Table 1.
| N | Demographic population size. |
| Ne | Effective population size. |
| α | Coefficient summarizing the hitchhiking and demographic effects of selfing that reduce the effective population size beyond the automatic twofold effect. |
| U, H, S, C | Genomic parameters of deleterious mutations for the background selection model: mutation rate, mean dominance coefficient, mean selection coefficient, mean recombination rate. |
| N 0 | Demographic population size before the environmental change in the extinction model. |
| r | Rate of population decline in the extinction model. |
| σ | Selfing rate. |
| F | Wright's fixation index (FIS). |
| u | Mutation rate from A to a. |
| sd, sb | Selection coefficients of the a allele before (deleterious effect) and after (beneficial effect) the environmental change. |
| hd, hb | Dominance coefficients of the a allele before and after the environmental change. |
| he(h) | Effective dominance coefficient. |
| π(h,s,x) | Probability of fixation of an allele starting at frequency x. |
| ρ(h,s,x) | Stationary density function of the frequency of the a allele before the environmental change, conditioned on a being the derived allele. |
| Pnew | Probability of fixation from new mutation. |
 |
Probabilities of fixation from standing variation, from initially neutral, and initially deleterious variation, respectively. |
 |
Threshold dominance coefficient above which Psv is higher in outcrossers than in selfers. |
 |
Average times to fixation, given fixation has occurred, from new mutation and standing variation, respectively. |
| Twait | Average waiting time of appearance of the mutation destined to be fixed. |
| Tadapt | Average time until complete adaptation, that is, until fixation of the beneficial allele either from standing variation or recurrent mutations. |
| Trelax | Average time until fixation of a neutral allele either from initially deleterious standing variation or recurrent mutations. |
 |
Probabilities of extinction, general expression, without standing variation, including initially neutral standing variation, and including initially deleterious standing variation, respectively. |
 |
Threshold dominance coefficient above which  is higher in outcrossers than in selfers. is higher in outcrossers than in selfers. |
Simulations
The analytical predictions were checked against stochastic simulations of a Wright–Fisher model. When population size remains constant, the frequency of each of the three genotypes is followed. Every generation, reproduction occurs with a proportion σ of the population reproducing through selfing, and then selection. The expected frequencies after reproduction and selection are computed. The genotype frequencies of the new generation are drawn from a multinomial distribution with probabilities corresponding to the expected frequencies. When recurrent mutations are taken into account, the number of mutant alleles is drawn from a Poisson distribution with mean 2Npu, where p is the frequency of the A allele, and attributes randomly to AA and Aa genotypes according to their frequency weighted by the number of A alleles they carry (two or one). To compute the probability of fixation from standing genetic variation, simulations are started 6N generations before the environmental change as in (Hermisson and Pennings 2005) to let the population reach mutation–drift or mutation–selection–drift balance (for initially neutral or deleterious mutations, respectively). After 6N generations, new mutational input is stopped and the selection coefficient of the allele a changes from neutral or deleterious (sd) to beneficial (sb). The simulations stop when the a allele is either fixed or lost and the probability of fixation is computed as the proportion of simulations leading to fixation. To compute the total time until adaptation, recurrent mutations are added after the environmental change and the simulations stop when the frequency of the aa genotype reaches one. The time to adaptation was computed as the average time over the simulations.
To simulate extinction and rescue, we used the procedure of Orr and Unckless (2008). In the first environment, the population remains constant with size N0. After the environmental change, the number of individuals of each genotype is followed, not only their frequencies. To simulate drift, we did not use a multinomial sampling but the number of individuals produced by each genotype is drawn from a Poisson distribution according to their absolute fitness, which now depends on the rate r of population decline (Absolute fitness of AA, Aa, and aa: wAA= 1 –r , wAa= 1 +hbsb–r , waa= 1 +sb–r). Note that the demography is thus stochastic, although we used a deterministic approximation for analytical expression (see below). The simulations stop (1) when population size equal to zero, (2) when the a allele is fixed, or (3) when the population size reaches the value of 10N0. We used this last condition to avoid infinite growth because we did not include density dependence. We chose 10N0 instead of N0 because the population size can be a bit higher than N0 through stochastic variations just after the environmental change, especially when N0 is low. Choosing 10N0 ensures that the beneficial mutation has reached high frequency and will not be lost. The proportion of simulations leading to extinction was recorded.
Probability of Fixation of a Beneficial Mutation
In this section, the population size is assumed to remain constant over time.
NEW MUTATIONS
 (3)
(3) (4)
(4) (5)
(5) (6)
(6) (7)
(7)(Caballero and Hill 1992 but see below and Glémin 2012 for the problem with the use of he). As emphasized by Charlesworth (1992), equation (6) shows that Pnew is independent of hb in complete selfers whereas in outcrossers, dominant mutations are more easily fixed than recessive ones, the so-called “Haldane's sieve” (Haldane 1927). For hb=½, Pnew reduces to 2αsb. If there is no additional reduction in Ne beyond its twofold effect (i.e., α= 1), selfing has no effect on the probability of fixation (Fig. 2). These classical results also hold true in subdivided populations, although the sieve is weaker (Roze and Rousset 2003).

Probability of fixation of a single new mutation (in frequency 1/2N) as a function of selfing rate for different dominance coefficient, given by equation (6). Dots correspond to numerical integration of equation (3). N = 20,000, sb= 0.01, no mutational input. From bottom to top: hb= 0.1, 0.3,0.5,0.7,0.9. (A) Without background selection. (B and C) With background selection: U= 0.5, H= 0.2, S= 0.1, and C= 5 (B) or C= 1 (C).
STANDING VARIATION
 (8)
(8) (9)
(9) and Ne is given by (1). R is defined by Hermisson and Pennings (2005) as “the relative selective advantage [that] measures the selective advantage of [a] in the new environment relative to the forces that cause allele frequency changes in the ancestral environment, deleterious selection and drift”. For initially neutral alleles, equation (9) is not very accurate so we preferred the less approximated expression given by Hermisson and Pennings (2005) in their appendix (their equation A9)
 (10)
(10)where Γ(z) is the Gamma function (Abramowitz and Stegun 1970).
As for new mutations, Psv is independent of dominance in complete selfers (Fig. 3). In outcrossers, for initially neutral or weakly deleterious alleles (either recessive or dominant), Psv is higher for dominant alleles, although the relative effect of dominance is weaker than for Pnew. For initially strongly deleterious a alleles and assuming that hb=hd, Psv is mostly independent of dominance in outcrossers, the R ratio in equation (9) tends toward sb/sd (see also Orr and Betancourt 2001): selection is initially lower for recessive alleles but they segregate at a higher frequency before the environmental change. However, equation (9) does not hold for very recessive alleles and Orr and Betancourt (2001) showed that Psv is highest for very recessive alleles, the opposite of Haldane's sieve, because their initial frequency more than compensate the lower selection they experience after the environmental change.
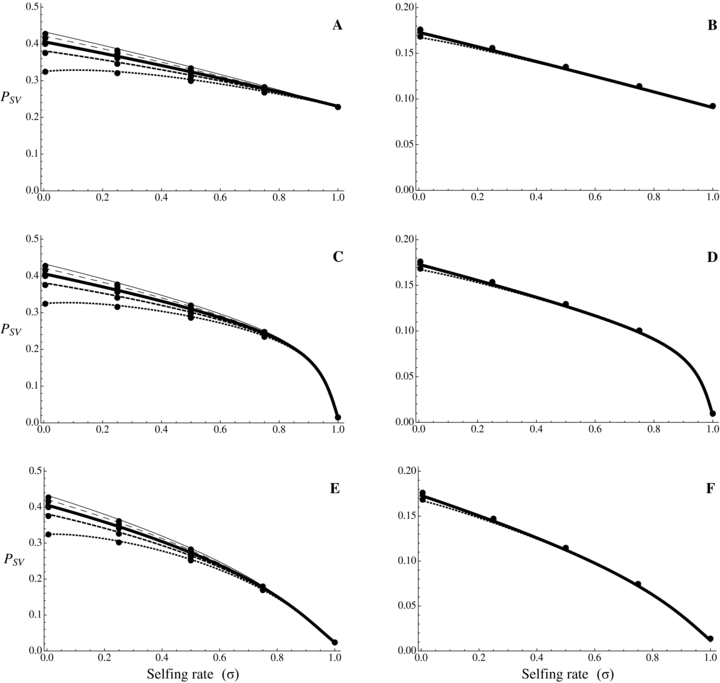
Probability of fixation from standing variation as a function of selfing rate for different dominance coefficients, given by equations (9) and (10). Dots correspond to observed data from 10,000 simulations. Results from numerical integration of equation (8) are indiscernible from the simulation results. N = 20,000, u= 10−6, sb= 0.01. From bottom to top: hb= 0.1, 0.3, 0.5, 0.7, 0.9. (A, C, and E) Initially neutral allele. (B, D, and F) Initially deleterious allele: sd= 0.01, hd=hb. (A and B) Without background selection. (B, D, E, and F) With background selection: U= 0.5, H= 0.2, S= 0.1, and C= 5 (C and D) or C= 1 (E and F).
 . General expressions are given in Supporting information Material 1. For α= 1, strong selection (Nehs >> 1), and an initially deleterious allele we obtained
 (11a)
(11a) (11b)
(11b)where γ≈ 0.577 is the Euler's constant. Even when α= 1,  is low under most conditions and tends toward 0 for strong selection. This suggests that, except for specific conditions (very recessive and weakly advantageous mutations), the probability of fixation from standing variation should be less likely in selfers than in outcrossers. This is due to two effects of selfing: (1) lower levels of polymorphism are maintained in selfers because Ne is reduced and (2) initially deleterious alleles are maintained at lower frequencies because of the purging process.
Time to Fixation and Rate of Adaptation
 (12)
(12) (13)
(13) (14)
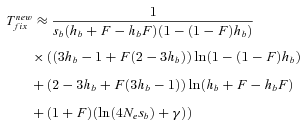
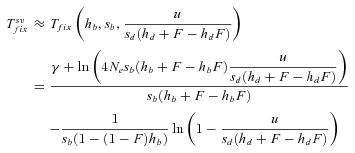
(14) . However, their expression is not very accurate as far as h is far from ½—either close to 0 or 1–and it cannot be simply extended to partial selfing by substituting he to h: the reparameterization of the dominance coefficient is only valid at low allele frequency—low z in equation (3)—which is insufficiently accurate to approximate the fixation time that depends on the whole allele trajectory between 0 and 1. We thus used the more accurate expression obtained by Glémin (2012)
 (15)
(15) (16)
(16) (17)
(17)
 (18)
(18)Note that  ,
,  , and Twait scale in 1/sb and so does Tadapt. The total waiting time, (1 –Psv)Twait, is always lower in outcrossers for dominant beneficial mutations. When Psv is substantial, higher than 0.5, the total waiting time is also lower in outcrossers for mildly recessive allele, especially if Ne is strongly reduced in selfers, α < 1: when Ne is small in selfers, adaptation from standing variation is less likely and the waiting time is longer. On the contrary,
  is always shorter in selfers than in outcrossers because Ne is lower and he(h) is higher (for details see Glémin 2012).
  is also shorter in selfers than in outcrossers, except for highly dominant beneficial mutations and if adaptation from standing variation is substantial. As a result, if α= 1, the total time for adaptation will be shorter in selfers under most conditions. In general, the total time for adaptation will be higher in selfers only if α < 1 (Fig. 4).
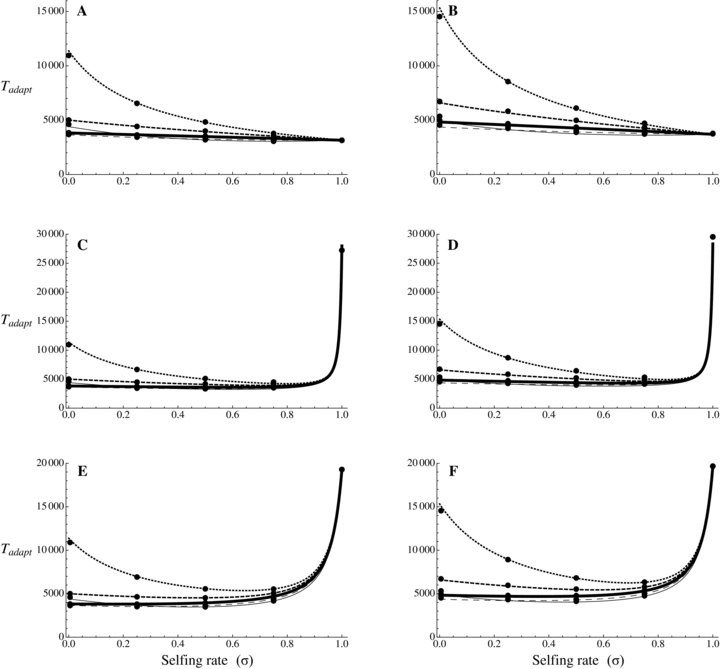
Total time for adaptation as a function of selfing rate for different dominance coefficients, given by equation (13). Dots correspond to observed data from 10,000 simulations. Results from numerical integration of equation (12) are indiscernible from the simulation results. N = 20,000, u= 10−6, sb= 0.01. Dotted line: hb= 0.1, small dashed line: hb= 0.3, thick line: hb= 0.5, large dashed line: hb= 0.7, thin line: hb= 0.9. (A, C, and E) Initially neutral allele. (B, D, F) Initially deleterious allele: sd= 0.01, hd=hb. (A and B) Without background selection. (B, D, E, and F) With background selection: U= 0.5, H= 0.2, S= 0.1, and C= 5 (C and D) or C= 1 (E and F).
Shift in Mating System Associated with the Environmental Change
Shift toward selfing is commonly associated with the evolution of specific traits (the so-called selfing syndrome). Our model allows exploring this scenario by considering the case for which the environmental change is associated with a shift from outcrossing toward selfing. Under this scenario, the probability of fixation from new mutations remains as given by equations (5) and (6). The probability of fixation from standing variation is also given by equation (8), however, ρ(h, s, x) is computed for a panmictic population whereas π(h, s, x) is computed for a selfing one—or more generally two different selfing rates can be used (see Supporting information Material 3 for detailed equations). Similarly, the average time until complete adaptation can be obtained by slight modifications of the terms in equation (13). Twait and  are computed for a selfing population, Psv is modified as explained above and
  is slightly modified: Neu is replaced by Nu for initially neutral mutations and u/(hd+F–hd)sd is replaced by u/hdsd for initially deleterious mutations (see Supporting information Material 3).
Adaptation from standing variation is expected to be higher just after the shift from outcrossing than for population self-fertilizing for a long time. Some numerical examples are given in Table 2. The analysis of this scenario yields to another prediction about the dominance of selected mutations. In contrast to ancient selfers, the dominance of mutations affects the probability of fixation if they are initially deleterious: recessive mutations segregates in higher frequency in the initial outcrossing population and are thus more prone to be fixed after the shift toward selfing.
| Probability of adaptation from SV | Time to fixation of the selfing syndrome1 | ||||||
|---|---|---|---|---|---|---|---|
| Initially | Initially | Relaxed | Initially | Initially | Relaxed | ||
| neutral2 | deleterious2 | selection2 | neutral2 | deleterious2 | selection2 | ||
| u=10−6 | h 3=0.1 | 0.406 | 0.133 | 0.001 | 2654 | 3303 | 1,039,000 |
| h=0.5 | 0.406 | 0.054 | <0.001 | 2654 | 3598 | 1,039,800 | |
| h=0.9 | 0.406 | 0.035 | <0.001 | 2654 | 3673 | 1,039,890 | |
| u=10−7 | h=0.1 | 0.051 | 0.014 | <0.001 | 25,018 | 25,938 | 10,039,000 |
| h=0.5 | 0.051 | 0.006 | <0.001 | 25,018 | 26,166 | 10,039,800 | |
| h=0.9 | 0.051 | 0.004 | <0.001 | 25,018 | 26,219 | 10,039,900 | |
- 1In generations.
- 2Details of the equations used are given in Supporting information Material.
- 3 h=hb=hd.
- N= 20,000, sd=sa= 0.01. σ= 0 in environment 1 and σ= 1 in environment 2.
 (19)
(19)Simple numerical explorations (Table 2) show that the evolution of the selfing syndrome under this scenario takes a very long time compared to the adaptation scenario.
Lack of Adaptation and Extinction
In previous sections, we assumed that the adaptation lag following the environmental change did not challenge the survival of the population. The population size remained constant and given sufficient time, adaptation eventually occurred. However, environmental change may affect demography and challenge population survival, eventually leading to extinction. We focused on a simple model where adaptation or extinction depends on a single biallelic locus, in the line of the rest of the article. Here, the key variable is the waiting time because nonextinction is conditioned by the appearance of the rescuing mutation. Hence, the time to complete fixation does not matter. To quantify the effect of selfing versus outcrossing on the risk of extinction under this framework, we naturally extended the model of Orr and Unckless (2008) by including diploidy and partial selfing. Advantages and limitations of this model have been discussed by these authors. As in Orr and Unckless (2008), we assumed that (1) population deterministically declines with an exponential rate of population decline r (r > 0) from an initial size N0, (2) selection is strong enough and initially acts mainly on heterozygotes in outcrossing populations (Nehe(hb)sb >> 1), and (3) beneficial mutations are sufficiently rare to enjoy independent fate without interacting.
 (20)
(20) (21)
(21) (22)
(22) (23)
(23) is higher in selfers than in outcrossers is given by
 (24)
(24)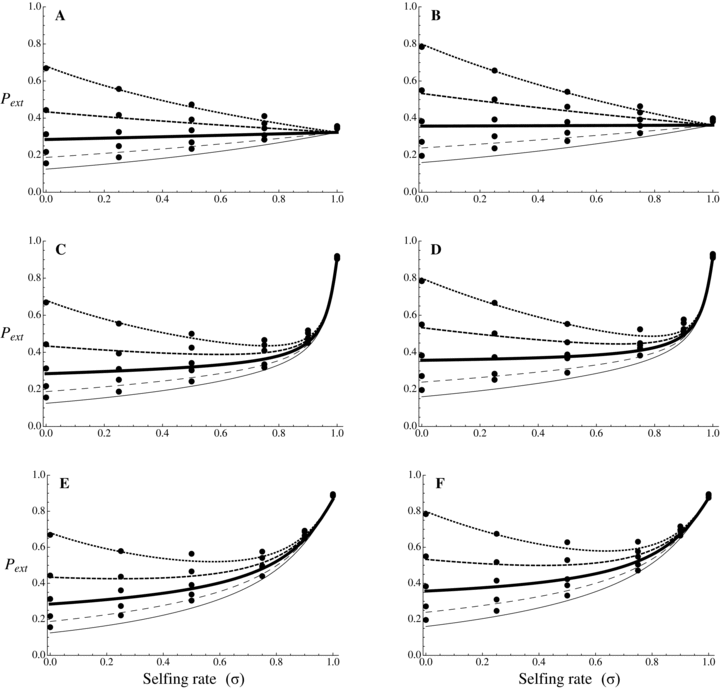
Probability of extinction as a function of selfing rate for different dominance coefficients, given by equations (20) and (21). Dots correspond to observed data from 10,000 simulations. N = 10,000, u= 10−6, sb= 0.05, r= 0.001. Dotted line: hb= 0.1, small dashed line: hb= 0.3, thick line: hb= 0.5, large dashed line: hb= 0.7, thin line: hb= 0.9. (A, C, and E) Initially neutral allele. (B, D, and F) Initially deleterious allele: sd= 0.01, hd=hb. (A and B) Without background selection. (B, D, E, and F) With background selection: U= 0.5, H= 0.2, S= 0.1, and C= 5 (C and D) or C= 1 (E and F).
For α= 1,  is thus higher than 1/2 and the range of mutation parameters for which the probability of extinction is higher in selfers than in outcrossers is quite restricted. When standing variation is taken into account, these conditions are less restrictive and
  is lower than ½ when α= 1 (Fig. 6). To explain higher extinction rates in selfers compared to outcrossers as assumed by the dead-end hypothesis, Ne must be (greatly) reduced beyond the twofold level and/or the role of standing variation in adaptation must be significant and/or beneficial mutations must be dominant on average (Figs. 5, 6).
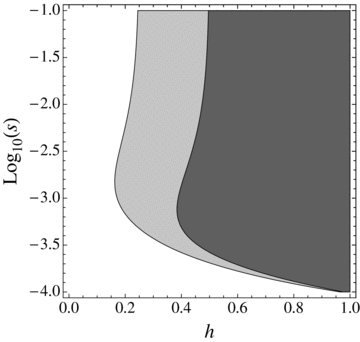
Range of mutation parameters (hb and sb) under which the probability of extinction is higher in a complete selfer than in a complete outcrosser (shaded areas). N= 20,000, u= 10−6, r= 0.0001. Dark gray: α= 1, Light gray: α=½.
Using equations (21)–(23) we can also compute the role of standing variation in preventing extinction, which is simply given by  . Figure 7 shows that standing variation plays a crucial role in preventing extinction when population size rapidly declines (relatively to the effect of the rescuing mutation): under rapid decline, the population can be rescued only if the rescuing mutation is initially available or appears shortly after the population starts to decline. As expected, the role of standing variation is also higher in large populations. Note, however, that this simple result should be considered with caution because rapid population decline should correspond to abrupt environmental change for which adaptation from standing variation is less likely.
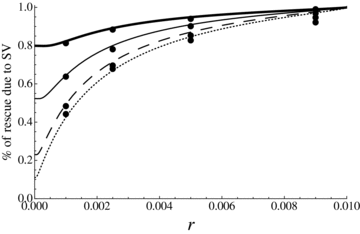
Proportion of population rescue due to standing variation as a function of the population decline rate for different population sizes, in a panmictic population. The y-axis corresponds to the number of cases where population rescue is due to the fixation of preexisting mutations over the total number of rescue. u= 10−6, sb= 0.02, hb= 0.5. From bottom to top, N= 5000, 10,000, 25,000, 50,000.
Discussion
Through a population genetics model, we explored how the selfing rate may affect the dynamics of adaptation. Although very simplistic, this model allows the definition of general trends on the effect of the mating system on the genetic bases and the rate of adaptation. This helps in understanding how selfing species may adapt or fail to adapt to a new environment, in relation to the evolution of adaptive traits in selfers (such those involved in the selfing syndrome) and the hypothesis that selfing is an evolutionary dead-end.
THE GENETIC BASES OF ADAPTATION IN SELFERS AND OUTCROSSERS
It was already well known that the genetic bases of adaptation should differ between selfers and outcrossers regarding dominance of new beneficial mutations. In outcrossers, dominant mutations are more easily fixed than recessive ones (Haldane 1927), whereas in selfers, the dominance is of little importance. As a consequence, the dominance spectrum of fixed mutations reflects the spectrum of newly arising mutations (Charlesworth 1992). Here, we showed that this is less true when adaptation proceed from standing variation (Fig. 3), especially for initially deleterious mutations (see also Orr and Betancourt 2001). Outcrossers and selfers also differ regarding the fraction of adaptation that can be due to new mutations versus standing variation. Under most conditions, independent of dominance, adaptation from standing variation is less likely in selfers than in outcrossers (Fig. 3), which can easily be explained as selfing is expected to reduce polymorphism maintained both at mutation–drift and mutation–selection balance (Charlesworth and Charlesworth 1995).
The analysis of the genetic bases of adaptation in natural populations is still too scarce to test these predictions. However, in domesticated plants, we recently showed that QTL fixed during the domestication process (considered as an adaptation process) tends to be more dominant in outcrossers than in selfers (J. Ronfort and S. Glémin, unpubl. ms.), in agreement with Haldane's sieve occurring on new mutations in outcrossers. Nevertheless, some domestication QTLs are recessive in outcrossers, suggesting that the corresponding alleles likely preexist in wild populations. In maize (an outcrossing species) for instance, several major genes involved in the domestication syndrome, including Tb1, contribute to standing variation in its wild progenitor, Teosinte (Weber et al. 2007). “Maize-like” alleles were already present in wild populations and increases in frequency during domestication (Jaenicke-Despres et al. 2003; Weber et al. 2007). Selection from standing variation during domestication also likely occurred in pearl millet (another outcrossing species) on the Tb1 orthologue (Remigereau et al. 2011) and in artificial selection for flowering time in maize (Durand et al. 2010).
THE RATE OF ADAPTATION IN SELFERS AND OUTCROSSERS
The genetic bases of the adaptation process condition how the mating system affects the rate of adaptation (Fig. 4). The total time required for adaptation until the fixation of the beneficial allele can be decomposed into two parts: the waiting time until the appearance of the beneficial mutation destined to be fixed (which can be null if the mutation is already segregating before the environmental change) and the fixation time of this mutation. The fixation time is always shorter in selfing species (Glémin 2012) but the waiting time strongly depends on the amount of standing variation available and on the dominance of mutations: waiting time is lower in outcrossers than in selfers when the probability of adaptation from standing variation is high and when beneficial mutations are not too recessive. On the contrary, the waiting time can be much shorter in selfers when beneficial mutations are partly recessive, except if Ne is strongly reduced under selfing (α << 1). However, the higher standing variation found in outcrossers does not seem to play a crucial role on the total adaptation time. When the product Neu is high, standing variation contributes significantly to adaptation in outcrossers and reduces the waiting time of the beneficial mutation destined to be fixed, but, when the waiting time is short, the fixation time constitutes an important part of the total adaptation time, which is an advantage for selfers. Overall, selfing slows down adaptation only if Ne is strongly reduced, α << 1 (compare cases with and without background selection on Fig. 4).
The distribution of dominance coefficients of new beneficial mutations is thus crucial to understanding whether selfing should speed up or slow down the rate of adaptation. Unfortunately, such a distribution is very poorly known and no firm conclusions can be drawn from empirical data (reviewed in Orr 2010). Recently, Manna et al. (2011) used Fisher's geometric model and suggested that beneficial mutations should be codominant or dominant on average, as long as adaptation can be well described by stabilizing selection on a set of phenotypic traits and populations are not too far from their optimum. The last assumption corresponds to rather small environmental changes, such that the new optimum does not differ much from the old one. Under these conditions, we thus also expect that a significant part of standing variation initially available in the first environment could be beneficial in the second one. Under rather slow and regular environmental changes, outcrossers should adapt more rapidly than selfers.
When considering strong environmental changes, adaptation from standing variation is less likely: mutations that are beneficial in the new environment are far from the optimum of the first environment, hence strongly deleterious, and are maintained at very low frequencies. The dominance coefficients of such mutations were not considered by Manna et al. (2011) and would require additional theoretical developments. The selection of some domesticated traits could fit this scenario of a strong environmental change. For instance, nondispersing forms were selected in many crops whereas they are strongly deleterious in wild populations. Empirical data on the genetic bases of some of these traits, such as nondispersing alleles, suggest that the domesticated alleles (beneficial in the new environment) tend to be recessive (J. Ronfort and S. Glémin, unpubl. ms.). Under these conditions, selfers should adapt more rapidly than outcrossers. Selfing could have facilitated adaptation during domestication by favoring the fixation of recessive, initially strongly deleterious traits, which could contribute to explaining the bias toward selfing among domesticated species (Zohary and Hopf 2000; Diamond 2002; Glémin and Bataillon 2009).
ADAPTATION TO SELFING AND EVOLUTION OF THE SELFING SYNDROME
The evolution of specific traits is often associated with shift toward selfing (the so-called selfing syndrome, reviewed in Sicard and Lenhard 2011), sometimes over a short time scale. In C. rubella, extensive phenotypic evolution may have occurred over 25,000 years (Foxe et al. 2009; Guo et al. 2009). Such rapid phenotypic changes suggest that they have been triggered by positive selection toward a new optimum of floral resource allocation (Sicard et al. 2011; Slotte et al. 2012) but in other species they could simply result from relaxed selective constraints on reproductive traits. We extended our model to compare these two scenarios. Numerical explorations (Table 2) show that the evolution of the selfing syndrome under the “relaxed constraint” scenario takes a very long time and is thus very unlikely, whereas the timing of selective scenarios are compatible with rapid evolution such as in C. rubella or L. alabamica (Busch et al. 2011). Selfing syndrome traits, even those not directly linked to the increase in selfing rate, are thus expected to evolve under positive selection pressures, as already suggested by empirical studies (Fishman et al. 2002; Goodwillie et al. 2006; Sicard et al. 2011; Slotte et al. 2012).
Our model also gives predictions on the genetic bases of the evolution of the selfing syndrome. Adaptation from standing variation is expected to be higher just after a shift from outcrossing than for a population that has been self-fertilizing for a long time, suggesting that the evolution of the selfing syndrome from standing variation could be rather frequent, except when the transition to selfing is associated with a strong bottleneck. In agreement with this prediction, floral traits associated with the evolution of selfing in Mimulus nasutus (Fishman et al. 2002) and Leptosiphon bicolor (Goodwillie et al. 2006) could have evolved from standing variation available in their outcrossing ancestor. On the contrary, the role of standing variation in the evolution of selfing syndrome traits is likely negligible in C. rubella (Slotte et al. 2012). This can be related to the strong loss of polymorphism associated with the bottleneck experienced by this species (Foxe et al. 2009; Guo et al. 2009).
This model also predicts that the genetic bases of adaptation should evolve during the mating system transition. Initial alleles increasing the selfing rates are more likely to be dominant because they can pass through the Haldane's sieve. Once the selfing rate has increased, alleles selected from standing variation are more likely to be recessive, because they segregate at higher frequencies in the initially outcrossing populations where they are masked. Finally, after the complete shift to selfing, the dominance of new fixed alleles should directly mirror the dominance of arising mutations as initially showed by Charlesworth (1992). Few studies are still available to test these predictions in details, but at least, they do not contradict them. In C. rubella, the self-compatible allele initially allowing the evolution of selfing is dominant as expected, and the C. rubella (selfing) alleles at QTLs determining other floral traits changes that should have evolved later are codominant or slightly recessive (Slotte et al. 2012). In M. nasutus and L. bicolor, both dominant and recessive alleles have been fixed, which could correspond to the different phases of the process although the order of fixation is not known (Fishman et al. 2002; Goodwillie et al. 2006).
MALADAPTATION IN SELFERS AND THE DEAD-END HYPOTHESIS
On the long run, selfing has been proposed to be an evolutionary dead-end (Stebbins 1957). Stebbins initially suggested that selfing species are doomed to extinction because of their low levels of variation resulting in low adaptive potential. However, in the last few decades, population genetics theory mostly focused on the consequences of deleterious mutations on the fate of selfing species (e.g., Charlesworth et al. 1993b; Lynch et al. 1995). Selfing lineages should be prone to the accumulation of deleterious mutations and mutational meltdown could contribute to their extinction. However, this hypothesis received little empirical support so far. Although current relaxed selection has been found in selfing species through the analysis of polymorphism data (e.g., Slotte et al. 2010; Qiu et al. 2011), no signature of long-term accumulation of deleterious mutations has been found in selfing lineages (Wright et al. 2002; Cutter et al. 2008; Haudry et al. 2008; Escobar et al. 2010). To explain this lack of results, it has been proposed that either selfing lineages are of too recent origin to show signature of genomic degradation or that Ne reduction in selfers is not sufficiently strong (α close to one) (Glémin and Galtier 2012).
Alternatively, we analyzed whether a lack of adaptation could contribute to higher extinction rates in selfing lineages. Especially, we were interested in the possibility that selfers could be less adapted than outcrossers even when Ne is not strongly reduced (α close to one). When focusing on the time required for complete adaptation (Fig. 4), selfers appear to be as efficient as and in some cases more efficient than outcrossers, unless Ne is strongly reduced in selfers (α << 1), and standing variation only plays a minor role. This is mainly due to the fact that the fixation time is always shorter in selfers (as discussed above and see Glémin 2012). However, when the extinction dynamics is explicitly taken into account, only the presence or the appearance of the rescuing mutation before extinction does matter. Standing variation thus plays a more important role because initially available mutations and those arising in first generations after the environmental changes contribute the most to rescue (Orr and Unckless 2008). This is especially true when population size decreases rapidly (Fig. 7).
If beneficial mutations are codominant or dominant, on average, as suggested by Manna et al. (2011), and the contribution of standing variation to adaptation is substantial, extinction rates can be higher in selfers than in outcrossers, even if α is close to one. This could occur under frequent, but rather slight, environmental changes for which outcrossers would easily adapt using standing variation whereas selfers would eventually fail to respond to environmental changes. By erasing standing variation, bottleneck episodes would increase extinction rates in selfers without strongly affecting Ne on the long run. This could explain why no or weak signatures of relaxed selection against deleterious mutations have been found through phylogenetic approaches. Alternatively, Ne could be strongly reduced in selfers (α << 1) but selfers could go extinct before having accumulated enough deleterious mutations that are detectable through phylogenetic approaches. The time to extinction due to maladaptation depend on the frequency and intensity of environmental changes. It could be much shorter than the time for extinction due to mutational meltdown, which is short only under obligate selfing and for very small population size (Lynch et al. 1995). Moreover, low rates of outcrossing are sufficient to slow down mutation accumulation (Charlesworth et al. 1993b). Overall, this suggests that extinction of selfing species is more likely due to the lack of adaptive potential than to the accumulation of deleterious mutations. This contrasts with clonal species for which accumulation of deleterious mutations is more easily detectable and more likely to contribute to their extinction (see discussion in Glémin and Galtier 2012). More explicit models including both deleterious and beneficial mutations in changing environments are necessary in the future to address this issue.
Associate Editor: M. Johnston
ACKNOWLEDGMENTS
This publication is the contribution ISEM 2012-096 of the Institut des Sciences de l’Evolution de Montpellier (UMR 5554–CNRS). This work was supported by the French Centre National de la Recherche Scientifique and Agence Nationale de la Recherche (ANR-11-BSV7-013-03).


