Recognition of Human Emotions from Cerebral Blood Flow Changes in the Frontal Region: A Study with Event-Related Near-Infrared Spectroscopy
J Neuroimaging 2011;21:e94-e101.
Abstract
ABSTRACT
BACKGROUNDS AND PURPOSE
The aim of this study is to develop a near-infrared spectroscopy (NIRS)-based system that recognizes pleasant and unpleasant human emotions based on cerebral blood flow (CBF) in order to understand the minds of patients whose brain function is severely impaired. The forehead region is easily accessible to NIRS measurements, whereas the role of the anterior prefrontal cortex (PFC) in the processing of emotion remains to be elucidated.
METHODS
Initially, using event-related NIRS we examined changes in oxygenated hemoglobin (oxy-Hb) as an indicator of regional CBF changes, which reflect brain activity directly related to emotions, but not to cognitive operations in the anterior frontal regions, during viewing affective pictures. The event-related potentials (ERPs), systemic blood pressure, and pulse rate were also measured simultaneously.
RESULTS
The event-related analysis of changes in oxy-Hb for a 6 s-picture presentation period showed that very unpleasant emotion was accompanied by an increase in oxy-Hb in the bilateral ventrolateral PFCs, while very pleasant emotion was accompanied by a decrease in oxy-Hb in the left dorsolateral PFC. There were no significant differences in either ERPs or autonomic nervous system activities between the two emotional states.
CONCLUSION
These findings suggest the possibility of recognizing patients’ emotions from CBF changes.
Introduction
Brain-computer interface (BCI) is increasingly receiving attention as an alternative communication pathway for disabled patients, such as those with amyotrophic lateral sclerosis and locked-in syndrome. Since, however, acquiring BCI-skill requires output-directed and goal-oriented thoughts,1 BCI is known to have little effect on patients with severely impaired cognitive abilities. Under the circumstances, the “mind/brain-human interface,” which is defined as a system that recognizes human emotions, is expected to enhance the quality of life for the patients, because this system enables us to know how the patients feel during medical and/or care procedures. Detection of brain activity associated with emotion processing is one possible approach to developing the “mind/brain-human interface.” Toward this aim, near-infrared spectroscopy (NIRS), which measures cerebral hemoglobin (Hb) concentration changes that reflect changes in regional cerebral blood flow (rCBF) coupled to those in neuronal activity,2–4 appears suitable, because this technique can be used at bedside and allows subjects to be relaxed during measurements. Recently, NIRS has begun to be applied in studies on emotion.5–7 However, NIRS can measure only the lateral surface of the cerebral hemispheres, but not the inferior, medial surfaces of the hemispheres or deep cerebral structures, where emotion processing regions are located. In the lateral surface of the hemispheres, the occipital/visual cortex has been reported to be activated by visually evocative stimuli, whereas the activations in this area are independent of the type of emotions.8–10
The forehead region, which covers the frontopolar cortex and the anterior lateral prefrontal cortex (PFC), are easily accessible for measurements by NIRS. It is understood that the lateral PFC plays a key role in higher-order cognitive functions, while recent functional magnetic resonance imaging (fMRI) studies have reported that the lateral PFC is recruited during the self-regulation of emotion.11,12 Lesion studies have also suggested that the dorsolateral prefrontal cortex (DLPFC) is associated with social cognition processes, including the perception of emotional cues.13 In contrast to the lateral PFC, the frontopolar cortex is not as well understood. This may be due to the difficulty in studying this region electrophysiologically in nonhuman primates and the limited number of neuroanatomical studies available depicting the neuronal connections as well as the intricate cytoarchitecture associated with this region.14 The anatomical extent of the frontopolar cortex is still controversial; however, in this study it is defined as the lateral portion of Brodmann area 10 (BA 10) and the interim areas on the lateral borderline of BA 10.15 The role of this region has received too little consideration, and only a few neuroimaging studies have reported emotion-related changes in the frontopolar activity.16 These neuroimaging studies often use cognitive tasks to elicit emotions and a frontopolar activation during a complex cognitive task has been detected in many functional neuroimaging studies. Thus, task-related activation in the frontopolar cortex could be regarded as emotion-related activation.5
The first step toward developing a NIRS-based “mind/brain-human interface” is to examine whether or not the frontopolar cortex and the anterior lateral PFC are engaged in the processing of emotions. Consequently, an attempt was made to detect emotion-related rCBF changes by using a simple paradigm requiring no complex cognitive processes: just viewing affective pictures. However, emotion tends to be variable even for a short period and easily habituated to the same stimuli (see the experimental design in methods). In addition, the stimuli used for eliciting emotion frequently induce cognitive activities. For example, an affective picture reminds a subject of something and the subject begins to think of it. Such derivative cognitive activities can alter the primarily induced emotion. It is not feasible to distinguish changes in rCBF related to a primarily induced emotion from those related to derivative cognitive activities and/or secondarily induced emotions in neuroimaging studies using a conventional block design. By contrast, it is expected that event-related early changes in rCBF will be more specifically related to the primarily induced emotion. Temporal resolution of NIRS is high enough for measuring event-related hemodynamic responses. In this study, thus, a multichannel NIRS instrument was employed to detect early changes in rCBF related to pleasant and unpleasant emotions. Also examined were event related potentials (ERPs), systemic blood pressure (BP), and pulse rate (PR), all three of which were considered potential biological markers of emotions, simultaneously with NIRS measurements.
Methods
Subjects
Nineteen right-handed healthy undergraduate students participated in the study (8 males, 11 females, ranging in ages from 21 to 25 years).
They had no neurological or psychiatric history. Before each study, written informed consent was obtained from all of the participants. The ethics committee of the Tokyo Institute of Psychiatry approved the study.
Affective Stimuli
To select appropriate stimuli, the emotional valence of 137 pictures from the International Affective Picture System (IAPS)17 and 100 pictures from other photograph collections (Fuji Film Co., Tokyo, Japan) were rated by 33 healthy volunteers (12 males, 21 females, ranging in ages from 20 to 28 years), who were not included among the 19 subjects in the present study. The emotional valence was rated by a digital scale with nine grades from 1 (very negative) to 9 (very positive). Unpleasant, neutral, and pleasant pictures were defined as pictures with a scale range of 1-3, 4-6, and 7-9, respectively. Ninety color pictures in which the subjects’ ratings coincided were selected as stimuli (30 pleasant, 30 neutral, and 30 unpleasant), and six 15-item sets of pleasant, neutral, and unpleasant pictures were produced.
Experimental Design
Subjects were sitting on a chair in a quiet room. The affective pictures were presented on a 37.5-cm × 30-cm liquid crystal display monitor 100-cm away from each subject's face. Each subject was instructed to look at the monitor. A white cross hair was first presented at the center of a gray background for 14 seconds (s) (a resting period) and then an affective picture was shown for 6 s (a stimulation period), which was successively followed by a second resting period. One block consisted of 15 stimulation periods, which were composed of equal numbers of pictures with each emotional valence, and 16 resting periods. Order of presenting pleasant, unpleasant, and neutral pictures was pseudorandomized in each block. Neutral pictures were used for the resting state in a block. A total of six blocks were performed with an interval of 30 seconds (Fig 1). After the end of the sixth block, the subjects rated their valence and their arousal for all 90 of the pictures as experienced at the time of the initial presentation by using the Self-Assessment Manikin (SAM).18 When the rating of valence was inconsistent with the intended one (eg, the pleasant picture being rated as neutral), that trial was excluded from further analysis. The reason the picture presentation time was set at 6 seconds was that in the preliminary study, in which subjects had been instructed to view an affective picture selected from the IAPS for 10 seconds and rate their valence of the picture, it was found that picture-induced pleasant and unpleasant emotions sometimes became extinct and/or changed to different emotions after 6 seconds from the stimulus onset (unpublished data). In addition, the reason why the subjects rated the valence and arousal, which was regarded as a kind of cognitive task, after the end of the sixth block was to avoid the overlap of rCBF changes related to cognitive activity on those related to emotion. The external trigger signals were output to a data acquisition system (BIOPAC MP SYSTEM, BIOPAC Systems Inc., Goleta, CA) where physiological parameters are incorporated, such as an electroencephalogram and a BP, and an NIRS instrument at the onset of each stimulus.
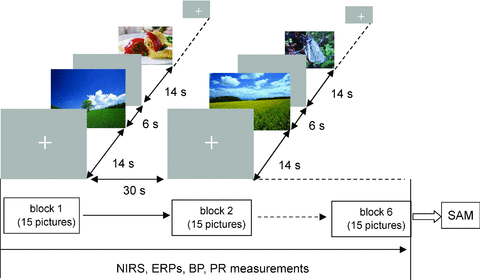
Experimental design.
NIRS data Acquisition and Processing
A multichannel NIRS imaging system (OMM-2000, Shimadzu Co., Kyoto, Japan), which uses three wavelengths (780, 805, and 830 nm), was employed for measurements. Six pairs of illuminating and detecting light guides were placed on the forehead with a separation of 3 cm (Fig 2A). This alignment of light guides measured 16 regions (channels), which covered the BAs 9/10/45/46/47 (Fig 2B). The incident light was emitted from the illuminating light guides in a time-share mode, and NIRS signals were sampled at the rate of 10 Hz. In the present study, changes in oxygenated hemoglobin (oxy-Hb), which is the most sensitive indicator of changes in rCBF,19 were analyzed. Ten data points were averaged for smoothing, providing data every second. NIRS measurement was continuously performed for a couple minutes before the beginning of the first block to the end of the last block. Upon completion of the study, subjects underwent MRI measurement to confirm the brain regions beneath each light guide.
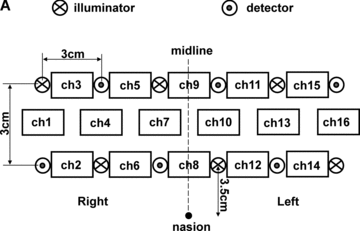
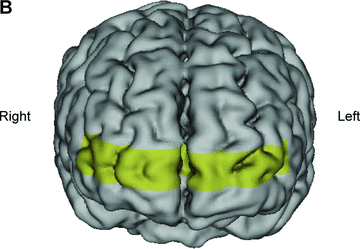
(A) Positions of light guides. Hb changes were measured at 16 regions between each pair of illuminator and detector. We termed these regions as channels (ch), and tentatively decided their nomenclatures as shown in the figure. (B) The brain area beneath the light guides for one subject is shown by a shaded square.
To detect early changes in oxy-Hb related to the processing of primarily induced emotion for individual subjects, changes in oxy-Hb from the value at the stimulus onset (0 s) during a 6-second stimulation period were statistically analyzed by making the following assumption. The changes in oxy-Hb observed at each time (1, 2, 3, 4, 5, and 6 seconds) during this period follow the normal distribution, which have a unique mean, and the variances at each time are equal. Since changes in oxy-Hb also occurred during a resting period, the baseline was different from trial to trial. Thus, the comparison of means among individual time groups was performed by a two-way (time × trial) analysis of variance (ANOVA). It was followed by a post hoc Dunnet two-sided comparison, in which the mean value at each time was compared with that at 1 second using the SPSS 11.0 for Windows (SPSS Inc., Chicago, IL). The direction of emotion-related changes in oxy-Hb was defined as that of changes in oxy-Hb with the largest difference from the value at 1 second.
Unpleasant and pleasant pictures were defined as pictures with a scale range of 1-3 and 7-9, respectively; however, it was conceivable that hemodynamic responses to pleasant and unpleasant pictures varied with each valence rating in the individual scale ranges. In addition, it was also predicted that the numbers of pleasant and unpleasant pictures with each valence rating would differ from subject to subject. These mean that, strictly speaking, each subject was exposed to qualitatively different stimuli. To detect hemodynamic changes more specifically associated with pleasant and unpleasant emotions, we combined all the subjects’ oxy-Hb responses to pictures with a valence rating of 1 (very unpleasant) or 9 (very pleasant), and also performed statistical analyses on these data as mentioned above (random-effects two-way ANOVA, Dunnett's procedure).
For all the statistical analyses performed in the present study, P < 0.01 was chosen as the level of significance.
EEG and other Physiological Data Acquisition
Electroencephalograms were recorded with Ag/AgCl electrodes at the F3, F4, C3, C4, P3, and P4 electrode sites according to the international 10-20 system, referred to linked earlobes. The impedance of electrodes was below 5 kΩ. An electrooculogram (EOG) of the left eye was recorded supra- and infra-orbitally. The EEG and EOG were amplified by a multichannel bioamplifier (BIOTOP 6R12, San-ei, Inc., Osaka, Japan). High- and low-pass filters for the EEG were set to 0.5 and 30 Hz, respectively. The EEG was digitized at 2 ms/point for 600 ms with a pre-stimulus baseline of 100 ms. Waveforms were averaged offline, and trials in which the EEG or EOG exceeded ±75 μV were rejected. The event-related potential (ERP) amplitude was measured relative to the pre-stimulus baseline, and the late positive potential (LPP) component was defined as the largest positive-going peak occurring after the N100-P200-N200 complex between 300 and 550 ms. At least 20 artifact-free trials were obtained for each stimulus condition. The LPP components from the P3 and P4 electrode sites, which were the most typical and artifact free, were selected for further analyses. The amplitude and latency data were analyzed by a random-effects two-way ANOVA for factors of affect (two levels: pleasant and unpleasant) and electrode sites (two levels: P3 and P4).
Blood pressure (BP) and pulse rate (PR) were continuously measured by arterial tonometry (JENTOW-7700, Colin, Komaki, Japan) at the left radial artery. In the analyses of BP and PR, pre- and post-stimulation periods were defined as the period 6 seconds just before and after the stimulus onset. BP and PR were analyzed by a random-effect two-way ANOVA for factors of affect (two levels: pleasant and unpleasant) and time (two levels: pre- and post-stimulation periods). Low-frequency power (LF), high frequency power (HF), and their ratio (LF/HF) were calculated from the PR spectrum by the use of MemCalc/Win (Suwa Trust Ltd., Tokyo, Japan), and these values were also analyzed by a random-effects two-way ANOVA.
Results
Valence and Arousal Ratings Data
The subjects’ ratings of unpleasant and neutral pictures were mostly consistent with the intended valences. However, five subjects rated 10 or more pleasant pictures as neutral, and they were excluded from further analyses. Of the remaining 14 subjects, the numbers of trials, which were excluded from further analysis due to the inconsistent rating of valence, during pleasant, unpleasant, and neutral conditions, were 2.79 ± 2.57 (mean ± SD), 2.93 ± 3.6, and 1.71 ± 2.43, respectively. Ratings of valence from pictures included in further analysis were 8.05 ± 0.80 (pleasant), 1.97 ± 0.85 (unpleasant), and 5.44 ± 0.59 (neutral). Ratings of arousal from unpleasant pictures were higher than those from pleasant pictures (unpleasant, 6.71 ± 0.82; pleasant, 5.54 ± 0.52, P < 0.01). The arousal from neutral pictures was the lowest (3.03 ± 0.74).
NIRS data
Since the emotional valence, which was rated by a digital scale, was fundamentally subjective, data were first analyzed individually. Table 1 summarizes the results of individually analyzing data and shows channels where significant increases or decreases in oxy-Hb were observed. During the presentation of pleasant pictures, 9 of the 14 subjects showed decreases in oxy-Hb at multiple channels (three [1-7] channels, median [range]), whereas no increases in oxy-Hb were observed at any channels of these subjects. Only one subject showed increases in oxy-Hb at the lowest channels (chs 2, 6, 8, 12, and 14) and the right upper channel (ch 3), and no significant changes in oxy-Hb were observed in the remaining four subjects. During the presentation of unpleasant pictures, 7 out of the 14 subjects showed increases in oxy-Hb at multiple channels (five [2-15] channels) without showing decreases in oxy-Hb at any channels. One subject showed no significant changes in oxy-Hb at all the channels, and the remaining six subjects showed decreases in oxy-Hb at multiple channels (7.5 [4-14] channels). The unpleasant emotion caused significant changes in oxy-Hb more quickly than the pleasant emotion: 3.69 ± 1.01 seconds (mean ± SD) and 4.27 ± 1.09 seconds; however, this difference was not statistically significant.
| Subject No. | Pleasant | Unpleasant | ||
|---|---|---|---|---|
| Increases in oxy-Hb | Decreases in oxy-Hb | Increases in oxy-Hb | Decreases in oxy-Hb | |
| 1 | – | 6/10/12 | – | 3/5/9/1 |
| 2 | – | 11-13/16 | 2/4-8/12 | – |
| 3 | – | 7 | 9/11-14 | – |
| 4 | – | 9 | 1/2/14/16 | – |
| 5 | – | 2-5/7/11/15 | – | 2-13/14/15 |
| 6 | – | – | – | 5-7/9 |
| 7 | – | – | – | 2/5/7/9/10/11/15 |
| 8 | – | 3/5/7/9/10 | – | 3/5/7-10/14/16 |
| 9 | – | – | – | – |
| 10 | – | 13/15 | 14/16 | – |
| 11 | – | 5/9/16 | 7/10/12-14 | – |
| 12 | – | 9/11/15 | – | 2-7/9-16 |
| 13 | – | – | 1-3/5-16 | – |
| 14 | 2/3/6/8/12/14 | – | 1-4/6/8/12/14 | – |
- Notes: Brain regions (channels) where emotion-induced changes in oxy-Hb were observed. Numerical numbers denote channel numbers. – denotes that no significant changes were observed at any channels.
To detect hemodynamic changes more specifically associated with pleasant and unpleasant emotions, oxy-Hb responses only to the pictures with a valence rating of 9 (very pleasant) or 1 (very unpleasant) were analyzed. Since, however, the numbers of such pictures in individual subjects were too small to perform an event-related analysis, combining all the subjects’ oxy-Hb responses to pictures with a valence rating of 1 or 9, a total of 131 and 116 trials for unpleasant and pleasant pictures, respectively, were analyzed. The very unpleasant emotions were accompanied by increases in oxy-Hb at channels 1 (P= 0.004) and 14 (P < 0.001) (Fig 3 lower), while the very pleasant emotions were associated with decreases in oxy-Hb at channel 15 (P < 0.001) (Fig 3 upper).
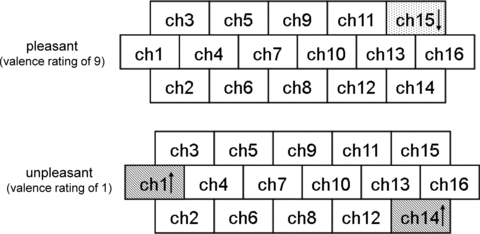
Brain regions (channels) where significant early changes in oxy-Hb were observed during very pleasant (upper) and very unpleasant conditions (lower). Significant increases and decreases in oxy-Hb were observed at channels with upward and downward arrows, respectively.
ERP data
Figure 4 shows grand-average ERP waveforms elicited by pleasant and unpleasant pictures over all the subjects from P3. There were no significant left-right differences in amplitude and latency of the LPP from P3 and P4. The latency and amplitude of the LPP in pleasant and unpleasant conditions were 365.4 ± 23.6 ms (mean ± SD) and 7.03 ± 3.26 μV, and 375.6 ± 30.9 ms and 8.17 ± 4.17 μV, respectively. Although the mean amplitude was higher in unpleasant conditions than in pleasant ones, statistically significant differences were observed in neither the amplitude nor the latency between pleasant and unpleasant conditions.
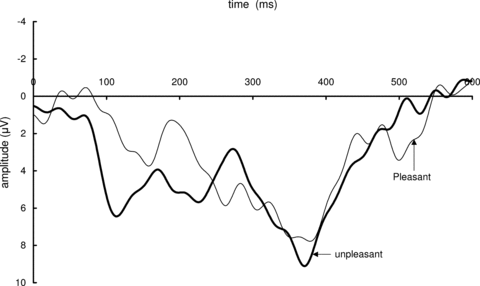
Grand-average event-related potentials over all the subjects for each valence category (unpleasant and pleasant) from P3.
BP and PR data
Pleasant and unpleasant emotions were not accompanied by significant changes in either systolic BP or PR, although a tendency to decrease in PR (P= 0.08) was observed in pleasant and unpleasant conditions (Table 2). HF tended to decrease in both pleasant and unpleasant conditions (P= 0.07), while no significant changes in LF/HF were observed.
| BP (mmHg) | PR (min−1) | HF (ms2) | LF/HF (ms2) | |||||
|---|---|---|---|---|---|---|---|---|
| Pre | Post | Pre | Post | Pre | Post | Pre | Post | |
| Pleasant | 117.3 | 117.5 | 64.8 | 62.8 | 1328.9 | 832.8 | 1.20 | 1.11 |
| (13.2) | (12.2) | (4.3) | (4.2) | (801.8) | (288.6) | (0.68) | (0.88) | |
| Unpleasant | 118.5 | 117.8 | 64.9 | 62.4 | 1265.2 | 1000.1 | 0.88 | 0.99 |
| (13.0) | (12.3) | (4.6) | (4.6) | (777.5) | (830.4) | (0.33) | (0.65) | |
- Mean value (SD).
Discussion
Early Changes in oxy-Hb
Prior to the present study, it was confirmed that picture-induced pleasant and unpleasant emotions continued at least during a 6-second stimulation period. Thus, the changes in oxy-Hb for the stimulation period were considered mainly to reflect changes in rCBF related to the processing of primarily induced emotion.
When pleasant and unpleasant emotions were defined on a scale range of 7-9 and 1-3, respectively, unpleasant emotions were accompanied by the nonlocalized activation of the frontopolar cortex in addition to the lateral PFC in half of the subjects, which was in contrast to the pleasant condition, where the activation was observed in only a single subject. Histological studies in monkeys have revealed that the frontopolar cortex connects with emotion processing regions, such as the amygdala, the anterior thalamic nuclei, and the anterior cingulate, although its connection with the amygdala is sparse.20–22 The connections of the lateral PFC with these regions are almost the same as those of the frontopolar cortex, but its connection with the anterior thalamic nuclei is sparse.21 From an anatomical viewpoint, it is possible that the frontopolar and lateral PFCs are activated by receiving inputs from the emotion processing regions, in which visual stimuli-induced unpleasant emotions are initially processed. Because of the large intersubject variations in hemodynamic responses, however, no oxy-Hb changes that characterized each emotional processing were observed. This might be partly accounted for by the heterogeneous stimuli as described in the Methods section. Another possible explanation was that the sample sizes were small (25-30 trails) for the event-related analysis.
Very unpleasant emotion (valence rating of 1) was accompanied by increases in oxy-Hb at channel 1 and channel 14, which were around the right and left ventrolateral prefrontal cortex (VLPFC), (BA 45/47), and (BA 10/45/46/47), respectively. This meant that the bilateral anterior VLPFCs were activated when a subject felt strong unpleasant emotion. Recent neuroimaging studies have reported that the VLPFC is activated during external (eg, viewing of affective pictures) and/or internal (eg, recalling a situation that induces an emotion) induction of negative emotional states, such as sadness, anxiety, and anger.12,23,24 Whether such activity simply reflects affective processing or other cognitive processing is controversial, though the present study supported the former. More recently, an event-related fMRI study has revealed that the VLPFC is involved in switching attention between stimulus dimensions.25 In addition, it has been proposed by Petrides that the VLPFC is the site where information is initially received from posterior association areas and organization of information held in working memory is performed.26 It is conceivable that the activation of the VLPFCs observed in the present study was attributed to switching attention and/or integrating information about affective stimuli. However, very pleasant emotion was not accompanied by the VLPFC activation, although these cognitive processes are not specific to unpleasant emotion. Thus, it is supposed that the bilateral anterior VLPFCs are involved in the processing of externally induced unpleasant emotions.
In contrast to very unpleasant emotion, very pleasant emotion (valence rating of 9) had no significantly activated areas but was accompanied by a decrease in oxy-Hb at channel 15, which was adjacent to the left DLPFC (BA 46/10). Functional neuroanatomy of pleasant emotions, which was revealed by neuroimaging studies, is more diverse compared to that of unpleasant emotions.27–29 Such diverse findings are partly attributable to the fact that conclusions drawn by these neuroimaging studies are generally specific to a certain experimental design. To solve this problem, function-location meta-analytic techniques have been applied to a number of neuroimaging studies. However, the findings reported in two recent studies with meta-analysis also showed some differences. As for pleasant emotion, Phan et al found that the basal ganglia, including the ventral striatum and putamen, were consistently activated by happiness,10 while Murphy et al found that the activation of the rostral supracallosal anterior cingulated cortex/dorsomedial PFC was associated with both happiness and sadness.30
Unlike many other studies, George et al observed that transient happiness induced by recalling life events and looking at a happy face was associated with significant and widespread reductions in cortical rCBF, especially in the right prefrontal and bilateral temporal-parietal regions.31 The physiological meaning of the reduction of rCBF in these regions was not explained in the above-mentioned paper. However, they supposed that the reductions in activity in the secondary association cortex might be common to both transient happiness and euphoria, and these changes might exist on a continuum, because the euphoria produced by pharmacological agents was accompanied by a reduction of cerebral glucose utilization in the whole brain.32 This can be one possible explanation for the reduction of oxy-Hb during pleasant emotion reported in the present study.
ERP and Physiological Data
Previous ERP studies show that viewing pleasant and unpleasant pictures elicits a larger LPP than viewing neutral pictures,33,34 which is consistent with the hypothesis that affective pictures draw attentional resources.35 The amplitude of the LPP varies with emotional arousal and the larger LPPs are elicited when viewing more arousing emotional pictures.36 Although the arousal ratings of unpleasant pictures are higher than those of the pleasant pictures in the present study, and the amplitude of the LPP elicited by unpleasant pictures is larger than that by pleasant pictures, this amplitude difference was not statistically significant. Thus, it is supposed that the differences in the pattern of early oxy-Hb changes between the two emotional conditions are related to those in emotional processes but not to those in attentional processes.
Affective pictures, which are effective cues to engage emotional response output systems,35 consistently modulate the activity of the autonomic nervous system. In the present study, however, neither a pleasant nor an unpleasant picture altered the activity of the autonomic nervous system, and neither systemic BP nor PR showed significant changes. These findings support the hypothesis that the increases in oxy-Hb observed during the unpleasant conditions were not caused by changes in systemic circulation, but instead reflected the brain activation related to emotion.
Conclusion
The present study has shown the possibility of recognizing pleasant and unpleasant emotions from CBF changes in the lateral PFC. It has also been indicated that the frontopolar cortex is less likely to be the primary site where visual stimuli-induced emotions are processed. Since, however, the frontopolar cortex is interconnected with the DLPFC37 as well as emotion processing regions, emotion-related CBF changes could take place there. Thus, the next step for developing a NIRS-based “mind/brain-human interface” is to explore distinct patters of CBF changes, which can be utilized as an emotion classifier, not only in the lateral PFC but also in the frontopolar cortex by using pattern recognition techniques, such as Support Vector Machine.


