Extending the Quantitative Assessment of Industrial Risks to Earthquake Effects
Abstract
In the general framework of quantitative methods for natural-technological (NaTech) risk analysis, a specific methodology was developed for assessing risks caused by hazardous substances released due to earthquakes. The contribution of accidental scenarios initiated by seismic events to the overall industrial risk was assessed in three case studies derived from the actual plant layout of existing oil refineries. Several specific vulnerability models for different equipment classes were compared and assessed. The effect of differing structural resistances for process equipment on the final risk results was also investigated. The main factors influencing the final risk values resulted from the models for equipment vulnerability and the assumptions for the reference damage states of the process equipment. The analysis of case studies showed that in seismic zones the additional risk deriving from damage caused by earthquakes may be up to more than one order of magnitude higher than that associated to internal failure causes. Critical equipment was determined to be mainly pressurized tanks, even though atmospheric tanks were more vulnerable to containment loss. Failure of minor process equipment having a limited hold-up of hazardous substances (such as pumps) was shown to have limited influence on the final values of the risk increase caused by earthquakes.
1. INTRODUCTION
Earthquakes may cause severe structural damages in industrial facilities, possibly resulting in loss of containment of hazardous substances stored or processed on the site. When the loss is particularly relevant, the seismic action may be the trigger of major industrial accidents, thus increasing the overall severity of the natural events either in terms of economical losses, or in terms of overload of emergency services, which are expected to face heterogeneous impacts on systems, or in terms of people safety if the installations are located in populated areas and keeping into account that population is possibly struggling with the effects of the catastrophic natural event (Lindell & Perry, 1996, 1997; Steinberg et al., 2001; Cruz et al., 2004; Cruz, 2005). As a consequence, quantitative risk assessment (QRA) of industrial installations should consider the probability of occurrence and intensity of possible seismic events, and the escalation of these natural events also in terms of industrial accidental scenarios, for proper prevention and emergency planning (DPC, 1993).
Despite these considerations, the European Community Directives for the prevention of major industrial accidents (e.g., Council Directive 96/82/EC, the “Seveso-II” Directive), do not mention explicitly the possibility of natural events as the trigger of industrial accidents, even if “domino effects,” which can be considered as the consequence of external events, are taken into account. This is possibly due to the conventional—nonnuclear—quantitative risk analysis methodologies on existing industrial installation, which are mainly focused on major accidents due to the loss of control of the process systems and more in general to “internal,” process-related causes (e.g., CCPS, 1989). Furthermore, earthquakes are often considered “rare events” (see, for instance, the Rasmussen Report, 1975, and the Rijnmond Report, 1982), even if there is a large debate on the uncertainties in the prediction of earthquake occurrence. Finally, it is worth mentioning the lack of simplified methodologies for the analysis of a large amount of equipment, as in the case of QRA, which is mainly due to the difficulty of the multidisciplinary effort that is needed for the analysis of interactions among very different phenomena as earthquake, seismic wave, equipment structure response, release of content from damaged equipment, and evolution of accidental scenarios as fires, explosions, dispersions of toxic substances. On the other hand, earthquake design codes are currently adopted for process plants, often derived from nuclear standards (ASCE, 1997; NFPA 59 A, 2006; Eurocode 8, 1998). These codes are overrefined for simple, but intensive QRA analysis and are, however, addressed to assess the structural resistance and to minimize economical losses in the case of an earthquake, whereas less importance is given to loss of containment and to the accidental scenarios that may follow.
In this framework, in previous studies simplified observational models for the definition of equipment vulnerability have been developed (Salzano et al., 2003; Fabbrocino et al., 2005). These models, together with well-known functions for the estimation of earthquake occurrence (Cornell, 1971), may be used to assess the expected frequency of loss of containment (LOC) events induced by earthquakes (Fabbrocino et al., 2005; Cozzani et al., 2007). A specific methodology, based on the assessment of the overall vulnerability due to the possible contemporary accidental scenarios caused by the released hazardous substances, was proposed for the calculation of risk indexes due to LOC events triggered by earthquakes (Cozzani et al., 2007; Antonioni et al., 2007). Even if these achievements make possible the inclusion of the effects of earthquakes in the framework of conventional QRA of industrial plants, the approach is far from being consolidated. In particular, the available models for equipment vulnerability estimation need to be assessed and the effects of the different possible assumptions used in the evaluation of the expected frequency of LOC events on the final risk figures need to be better understood.
In the following, the approach developed for QRA induced by earthquakes was applied to case studies derived from three specific locations in Italy (Milazzo, Roma, and Livorno), which are characterized by the presence of industrial plants having significant inventories of hazardous substances and of densely populated areas in the close surroundings. Several specific vulnerability models for different equipment classes were compared and assessed. The effect on the final risk figures of the different resistance of different equipment classes to seismic events was investigated. Further insights on the natural-technological (NaTech) risk assessment of seismic events triggering major accident releases were obtained comparing the results to those obtained without considering earthquake effects.
2. METHODS
2.1. The Framework
A previous study showed that the quantitative assessment of external hazards and, in particular, of natural hazards, may be carried out introducing a limited number of conceptual modifications in the procedure used for conventional (“internal”) risk assessment (Cozzani et al., 2007). Table I shows that the quantitative assessment of external events requires a limited number of specific activities with respect to those usually carried out in a conventional QRA of a chemical or process plant. In particular, the table points out that the main differences are in the risk identification and in the frequency calculation stages.
| Stage | Step | Type | |
|---|---|---|---|
| 1. Risk identification | 1.1 | Characterization of the external event | Specific |
| 1.2 | Identification of relevant process units | Specific | |
| 2. Frequency calculation | 2.1 | Estimation of the occurrence of the external event | Specific |
| 2.2 | Estimation of the damage probability of each unit (given the impact vector) | Specific | |
| 2.3 | Identification of each possible LOC combination | Specific | |
| 2.4 | Conditional probability calculation for each possible LOC combination | Specific | |
| 3. Consequence assessment | 3.1 | LOC characterization | Conventional |
| 3.2 | Consequence assessment of each reference scenario | Conventional | |
| 4. Risk recomposition | 4.1 | Calculation of vulnerability maps for each possible LOC combination | Specific |
| 4.2 | Calculation of individual risk for each possible LOC combination and for each external event considered | Conventional | |
| 4.3 | Calculation of overall risk indexes | Conventional |
- Note: LOC= Loss of containment.
The starting point of the procedure is the characterization of one or more reference events (Step 1.1) and the estimation of their occurrence (Step 2.1). An impact vector is associated to each reference event, the elements of the vector being the expected occurrence frequency and the severity parameters. Two further issues are present in the procedure: (i) the characterization of damage probability following the external event (Step 2.2), and (ii) the assessment of the multiple simultaneous LOC scenarios that may arise from the impact of a natural event on a wide industrial plant or on an industrial area where several facilities are present (Steps 2.3 and 2.4).
The first issue required the development of specific equipment vulnerability models for the assessment of LOC probability and release magnitude. Observational models based on past accident analysis were developed to approach the problem and will be discussed in the following sections.
The problem of simultaneous scenarios is a further issue that needed to be addressed in the present framework. The analysis of past accidents (Campedel et al., 2008) evidenced that earthquakes may trigger simultaneous LOC events by: (i) “common case failure” of equipment, and by (ii) domino effect. The “common cause failure” of equipment is due to the simultaneous structural damage of several components due to the earthquake. Domino effect consists in the possible further escalation of these primary events to involve other units. In the present approach, only “common cause failure” of equipment is considered, although the further analysis of escalation events may be added to the procedure (Cozzani et al., 2005, 2006).
The frequency of the multiple LOC scenarios was calculated on the basis of the conditional probability of each LOC calculated in Step 2.2. Considering the primary LOC events as independent, the conditional probability of all possible LOC combinations were estimated.
Conventional models for consequence assessment allow the calculation of the consequences for each equipment item considered (Steps 3.1 and 3.2). In the risk recomposition procedure, the overall consequences of the combination of events are then estimated by a combination of the vulnerability maps generated for each LOC scenario (Step 4.1). Conventional procedures are then applied to calculate the final risk indexes (Steps 4.2 and 4.3). Further details on Steps 4.1 to 4.3 of the procedure are provided elsewhere (Cozzani et al., 2005).
A high number of multiple LOC scenarios need to be considered in the risk recomposition procedure (2n-1, where n is the number of LOC events independent from each other considered in the procedure). As discussed in the following, the development of a specific software tool was needed to apply the procedure (Antonioni et al., 2007; Cozzani et al., 2006).
2.2. Earthquake Characterization
The specific features of QRA call for simplified representations of the complex nature of the events that may cause the LOC scenarios. In the present approach, the characterization of the natural event was based on the identification of one or more reference events (Step 1.1 in Table I), on the estimation of the occurrence of the reference events (Step 2.1), and on the simplified representation of the severity (the energy and the intensity of the natural event) by few specific parameters, in order to evaluate the interaction with industrial equipment. In the case of earthquakes, peak ground acceleration (PGA)—and in particular its horizontal component—is particularly useful for the characterization of local ground motion, that is, for the evaluation of intensity (Cornell, 1968). This choice is due to its simplicity of measurement, obtained by a direct reading of the accelerogram at any given location, and indeed, almost all historical databases record this variable. Furthermore, direct conversion from magnitude (the total energy of an earthquake, which is often reported in the literature) to local earthquake intensity is also possible by means of attenuation relations (ATC, 1985; Douglas, 2001).
The probability of occurrence of an earthquake having a given intensity may be estimated by the widely used probabilistic seismic hazard analysis (PSHA) (Cornell, 1968; Bommer, 2002; Field, 2003). The PSHA methodology gives, for any location, the seismic hazard curves in terms of Poissonian probability of exceedance (EP), that is, the probability that the PGA exceeds a specific value α over a given recurrence interval. Generally, EP curves are given with respect to 1-year and 50-year recurrence intervals. For the specific case of industrial risk assessment, the latter value is useful because it is the typical operational lifetime of major equipment such as storage tanks.
 (1)
(1)Fig. 1 shows the results of the calculations for three sites in Italy where the case studies discussed in the following were located. Each plot reports the 50th percentile distribution (median value, μ), and the distributions of 16th and 84th percentile for the EP, which identify the corresponding standard deviation σ.

Fifty-year exceedance probability (EP, Equation (1)) for the sites of the three case studies. (a) Milazzo, (b) Roma, and (c) Livorno. The continuous line represents the median value μ and the dashed lines the standard deviation σ (16th and 84th percentile).
2.3. Equipment Vulnerability Models
Detailed structural analysis may be used to determine the damage of equipment due to any seismic event. However, such an approach is time-consuming and the level of detail may exceed that required in a QRA framework. As an alternative, simplified empirical equipment vulnerability models based on observational data are available. In the development of such tools, the damage classification proposed by HAZUS guidelines (HAZUS, 1997) may be adopted. More specifically, limit states for structural damage (damage state, DS) are defined. For industrial QRA purposes, a DS scale based on three damage states was proposed: DS1, corresponding to minor structural damage; DS2, corresponding to relevant structural damage; and DS3, corresponding to the total collapse of the structure (Salzano et al., 2003; Fabbrocino et al., 2005).
For the aims of QRA, however, “risk states” (RS) were defined in order to obtain a measure of the quantity and rate of hazardous substance released from containment systems, following the seismic structural damage of industrial equipment (Salzano et al., 2003; Fabbrocino et al., 2005). As for DS, three RS may defined: RS1, corresponding to a minor release; RS2, corresponding to a relevant release of hazardous substances; and RS3, for a sudden loss of containment of the entire vessel inventory. Quite clearly, the significance of RS1 and of RS2 may depend on the equipment type. In the case of pressurized equipment, for instance, even quite small failures of shell structure produced by the earthquake (DS2) may result in a release having consequences similar or even worse than those observed in the case of the collapse of the structure.
 (2)
(2) (3)
(3)The analysis of observational data available in the literature allowed the development of equipment vulnerability models based on probit analysis for different categories of atmospheric tanks, pressurized tanks, reactors, and pumps. Table II summarizes the available vulnerability models. Fig. 2 shows a comparison of the vulnerability for the different categories of equipment defined in the analysis. Further details on data sources and on data analysis are reported elsewhere (Salzano et al., 2003; Fabbrocino et al., 2005).
| Type of Equipment | Damage Stage (DS) | Filling Level | k 1,i,j | k 2,i,j |
|---|---|---|---|---|
| Anchored | ≥ 2 | Near full | 7.01 | 1.67 |
| atmospheric | ≥ 2 | ≥50% | 5.43 | 1.25 |
| tanks (AT) | 3 | Near full | 4.66 | 1.54 |
| 3 | ≥50% | 3.36 | 1.25 | |
| Unanchored | ≥ 2 | Near full | 7.71 | 1.43 |
| atmospheric | 3 | Near full | 5.51 | 1.34 |
| tanks (AT) | 3 | ≥50% | 4.93 | 1.25 |
| Horizontal | ≥ 1 | Any | 5.36 | 1.01 |
| pressurized | ≥ 2 | Any | 4.50 | 1.12 |
| storage tanks (PV) | 3 | Any | 3.39 | 1.12 |
| Pressurized | ≥ 1 | Any | 5.46 | 1.10 |
| reactors | ≥ 2 | Any | 4.36 | 1.22 |
| 3 | Any | 3.30 | 0.99 | |
| Pumps (G) | ≥ 2 | − | 5.31 | 0.77 |
| 3 | − | 4.30 | 1.00 |
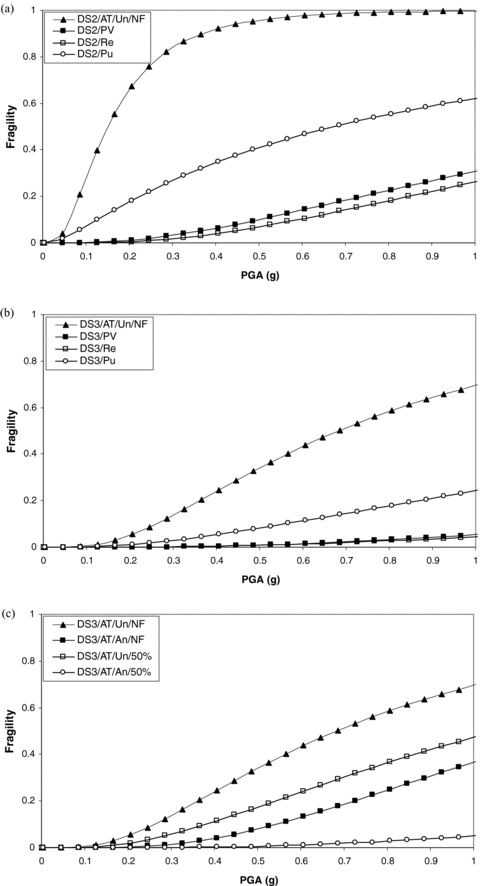
Curves of damage and risk state probability (fragility) as a function of PGA for different equipment categories (g = gravity constant; AT = atmospheric tank; PV = pressurized vessel; Re = reactors; Pu= pumps; An = anchored; Un = unanchored; NF = near full; 50%: 50% filling level). (a) DS2 probability, miscellaneous equipment; (b) DS3 probability, miscellaneous equipment; (c) DS3 probability, atmospheric tanks.
From Fig. 2, it is evident that, as expected, for any given equipment and PGA value, the probability of more severe damage states (e.g., DS3 vs. DS2) is always lower. On the other hand, Figs. 2(a) and 2(b) evidence a clear trend in the damage probability of different equipment categories (e.g., the probability of a given damage state for pressurized tanks is always lower than the corresponding value for atmospheric tanks). Finally, Fig. 2(c) evidences the role of structural details and filling level, which may cause important differences in the failure probability of atmospheric tanks.
2.4. Selection Procedure of Case Studies
In order to understand the influence of seismic events on the overall risks caused by major accident hazards in industrial facilities, three case studies were selected. The case studies were defined in order to investigate different aspects of the risk due to LOC events triggered by earthquakes and, in particular, to assess the influence of the different seismic vulnerability models available for the equipment items. The analysis was mainly focused on storage tanks, either pressurized or atmospheric. Indeed, historical analysis on industrial accidents triggered by earthquakes has shown that storage tanks are the type of equipment that is more likely to produce dramatic accidental scenarios as a consequence of earthquakes (MHIDAS, 2001; Lees, 1996). The results of a recent analysis of industrial accidents triggered by earthquakes reported in databases (Campedel et al., 2008) showed that storage tanks represented 37% (257) of the 701 equipment items damaged in 29 seismic events. A relevant release of hazardous materials was reported from 70% (180) of the damaged units. Thus, the case studies were selected in order to allow the analysis of the effect of earthquakes in storage farms. Three different examples were considered: (i) an atmospheric storage farm; (ii) a set of pressurized storage tanks; and (iii) a more complete case where the presence of auxiliary equipment (e.g., pumps) was also considered, besides that of atmospheric and pressurized storage tanks.
2.5. Description of Case Studies
The layouts defined for the case studies, reported in Fig. 3, were derived from those of existing oil refineries. The layouts report the number, position, and catch basins of the units considered in the analysis. The boundaries of the plant section considered are also evidences. Following usual design standards, each unit in the layout is identified by a unit identification code (e.g., AT_A1, AT_B1, etc.). Details on each unit, identified by the correspondent unit code, are reported in Table III. In the case of atmospheric tanks, different types of equipment items (anchored and unanchored) and different filling levels (near full, 50%) were considered in the analysis. For the sake of simplicity, two possible damage states DS were assumed both in the analysis of conventional failures and of LOCs triggered by seismic events. In the case of atmospheric tanks, DS2 was associated to a leak with a diameter of 50 mm (and RS2) and DS3 was associated to a catastrophic failure of the vessel and to the almost instantaneous loss of containment of the entire vessel inventory (RS3). In pressurized tanks, DS2 was associated to a release of the entire inventory in 10 minutes (e.g., by the full bore rupture of a main pipe connection), while a quasi-instantaneous release of the entire vessel inventory was associated to RS3.
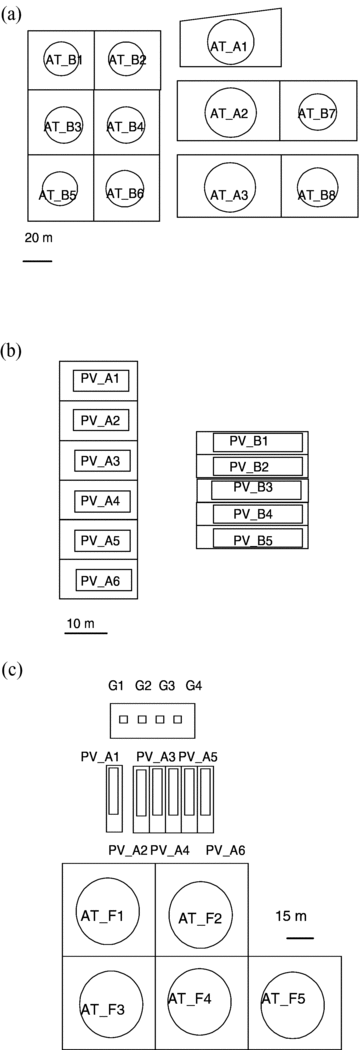
Layouts used for the case studies. (a) Milazzo; (b) Rome; (c) Livorno. Equipment units are identified by a code (e.g., AT_A1, etc.). Data on each unit are provided in Table III.
| Case Study, Figure | Unit Code | Type | Geometry | Diameter (m) | Height/Length (m) | Substance |
|---|---|---|---|---|---|---|
| 1 – Milazzo, Fig. (3a) | AT_A1–3 | Atm. | Vertical cylinder | 56 | 5.4 | Gasoline |
| 1 – Milazzo, Fig. (3a) | AT_B1–6 | Atm. | Vertical cylinder | 38 | 7.2 | Gasoline |
| 1 – Milazzo, Fig. (3a) | AT_B7–8 | Atm. | Vertical cylinder | 46 | 7.2 | Gasoline |
| 2 – Rome, Fig. (3b) | PV_A1–6 | Press. | Horizontal cylinder | 6 | 13 | LPG |
| 2 – Rome, Fig. (3b) | PV_B1–5 | Press. | Horizontal cylinder | 3.5 | 20 | LPG |
| 3 – Livorno, Fig. (3c) | AT_F1–5 | Atm. | Vertical cylinder | 35 | 10 | Gasoline |
| 3 – Livorno, Fig. (3c) | PV_A1–6 | Press. | Horizontal cylinder | 4 | 40 | LPG |
| 3 – Livorno, Fig. (3c) | G1–2 | Pump | − | − | − | LPG |
| 3 – Livorno, Fig. (3c) | G3–4 | Pump | − | − | − | Butane |
- Note: Atm. = atmospheric; Press. = pressurized; LPG = liquefied petroleum gas.
Table IV shows the scenarios considered in the conventional analysis of failures due to “internal” causes, as derived from the approach suggested by the “Purple Book” (Uijt & Ale, 1999). In the analysis of LOCs triggered by seismic events, only the worst-case scenarios were considered. A conservative value was assumed for ignition probability (100%) in order to take into account the very high ignition probability suggested by past accident analysis. Table V shows the reference seismic events assumed in the analysis of the different case studies. The following risk indexes were calculated in all the case studies:
| Unit Code | DS | Type of Release | Reference Scenario | Frequency (Events/Years) | IP (%) |
|---|---|---|---|---|---|
| AT_A1–3 | 2 | Continuous (50 mm RD) | Pool fire (PD 12 m) | 5 · 10−5 | 6.5 |
| 3 | Instantaneous | Pool fire (PD 70 m) | 5 · 10−6 | 6.5 | |
| AT_B1–6 | 2 | Continuous (50 mm RD) | Pool fire (PD 11 m) | 5 · 10−5 | 6.5 |
| 3 | Instantaneous | Pool fire (PD 66 m) | 5 · 10−6 | 6.5 | |
| AT_B7–8 | 2 | Continuous (50 mm RD) | Pool fire (PD 12 m) | 5 · 10−5 | 6.5 |
| 3 | Instantaneous | Pool fire (PD 70 m) | 5 · 10−6 | 6.5 | |
| PV_A1–6 | 2 | Continuous (10-min release) | Jet fire | 5 · 10−7 | 50.0 |
| 2 | Continuous (10-min release) | VCE | 5 · 10−7 | 2.5 | |
| 2 | Continuous (10-min release) | Flash fire | 5 · 10−7 | 2.5 | |
| 3 | Instantaneous | Fireball | 5 · 10−7 | 50.0 | |
| 3 | Instantaneous | VCE | 5 · 10−7 | 2.5 | |
| 3 | Instantaneous | Flash fire | 5 · 10−7 | 2.5 | |
| PV_B1–5 | 2 | Continuous (10-min release) | Jet fire | 5 · 10−7 | 50.0 |
| 2 | Continuous (10-min release) | VCE | 5 · 10−7 | 2.5 | |
| 2 | Continuous (10-min release) | Flash fire | 5 · 10−7 | 2.5 | |
| 3 | Instantaneous | Fireball | 5 · 10−7 | 50.0 | |
| 3 | Instantaneous | VCE | 5 · 10−7 | 2.5 | |
| 3 | Instantaneous | Flash fire | 5 · 10−7 | 2.5 | |
| AT_F1–5 | 2 | Continuous (50 mm RD) | Pool fire (PD 15 m) | 5 · 10−5 | 6.5 |
| 3 | Instantaneous | Pool fire (PD 60 m) | 5 · 10−6 | 6.5 | |
| AT_G1 | 2 | Continuous (50 mm RD) | Pool fire (PD 12 m) | 5 · 10−5 | 6.5 |
| 3 | Instantaneous | Pool fire (PD 40 m) | 5 · 10−6 | 6.5 | |
| PV_A1–8 | 2 | Continuous (10-min release) | Jet fire | 5 · 10−7 | 50.0 |
| 2 | Continuous (10-min release) | VCE | 5 · 10−7 | 2.5 | |
| 2 | Continuous (10-min release) | Flash fire | 5 · 10−7 | 2.5 | |
| 3 | Instantaneous | Fireball | 5 · 10−7 | 50.0 | |
| 3 | Instantaneous | VCE | 5 · 10−7 | 2.5 | |
| 3 | Instantaneous | Flash fire | 5 · 10−7 | 2.5 |
- Note: IP = ignition probability; PD = pool diameter; RD = release diameter; VCE = vapor cloud explosion.
| Case Study | Reference Event | PGA (g) | Recurrence Interval (y−1) |
|---|---|---|---|
| 1 Milazzo | Major | 0.302 | 1.0 · 10−4 |
| 2 Roma | Major | 0.159 | 1.0 · 10−4 |
| 3 Livorno | Major | 0.143 | 1.0 · 10−3 |
- •
Individual risk, defined as the expected frequency of a fatality occurring as a consequence of any possible accidental scenario to a person who is permanently present (24 hours a day per year) in a given point of the area, with no protection and no possibility of being sheltered or evacuated.
- •
Societal risk, expressed using the F-N curve, that shows the cumulative frequency on the target area (F) of accidents causing at least N fatalities (considering the actual probability of presence of each population category).
- •
Potential life loss (PLL), that is, the average expected frequency of fatalities due to accidental events in the target area, calculated as follows:
where F is the cumulative frequency of accidents and N is the expected number of fatalities.
Further details on the definition and on the calculation of the risk indexes listed above are reported elsewhere (Lees, 1996). A uniform population density was assumed to allow societal risk calculation (10 persons per hectare).
The calculation of the individual and societal risk indexes in the case studies was carried out using the seismic toolbox of the Aripar-GIS software. The Aripar-GIS software was developed in the framework of the Aripar project (Egidi et al., 1995). The software and the procedures used for individual and societal risk calculations are described in detail in the literature (Spadoni et al., 2000). The seismic package was developed in order to allow the calculation of the contribution of earthquakes to individual and societal risk caused by industrial plants (Antonioni et al., 2006). The user should input to the software the data of the reference earthquakes (expected frequency and reference value of the maximum horizontal PGA), the reference scenarios, the position, and the vulnerability model associated to each equipment item considered in the analysis. The software defines all the possible accidental scenarios for each reference earthquake considered. The calculation procedure automatically identifies all the possible overall scenarios and calculates the risk indexes in the area of interest on the basis of a simplified layout that should be implemented in a geographic information system (GIS) environment.
3. RESULTS AND DISCUSSION
3.1. Analysis of Case Studies
The analysis of the case studies selected was aimed to understand the influence of risk caused by earthquakes on the overall industrial risk indexes used to estimate the safety performance of an industrial installation. In the analysis of the case studies, the individual and societal risk were calculated both with and without considering the influence of the LOC events that may be triggered by earthquakes. The case studies also addressed the comparison of the available equipment vulnerability models and the effect of the different resistance of different equipment classes to seismic events.
In all the case studies, individual risk plots were obtained and societal risk (expressed by F-N curves and PLL index) were calculated. When appropriate, the calculations were performed using different vulnerability models or considering different damage states. For the sake of brevity, in the following only the more important results are reported and discussed. In particular, the results obtained in case study 1 were used to analyze the effect of different vulnerability models for atmospheric tanks. Results obtained mainly in case study 2 were used to understand the role of assumptions concerning the reference damage states, while the results from the third case study were the main basis to understand the different influence on the final risk figures of different equipment categories.
3.2. Atmospheric Tanks: Influence of Vulnerability Models on the Risk Indexes
Figs. 4 and 5 show, respectively, the individual and societal risk plots obtained for the case study of Milazzo by considering the severe reference earthquake of Table V and the catastrophic failure (DS3) LOC scenarios. Fig. 4 shows that seismic events increase the individual risk by more than one order of magnitude. Although several conservative assumptions were introduced in the analysis, the main cause of this result is the quite high probability calculated for the reference earthquake with respect to the conventional failure frequencies assumed for process equipment failing due to internal causes. As expected, Fig. 5(a), reporting the societal risk F-N curves, shows again that both the expected frequency and number of fatalities (and thus the severity of the accidents) increase considerably taking into account the effects of seismic events. This is caused by two factors: (1) the rather high expected frequency of the reference earthquake; and (2) the possibility of events simultaneously involving more than one unit, thus generating a wider impact area if the damage areas of the contemporary scenarios are different. It must be remarked that the effect of a simultaneous failure of several units is possibly the most important factor affecting the severity of NaTech accidents triggered by earthquakes. These scenarios are of particular importance in the case of relatively low-hazard atmospheric units, such as the gasoline storage tanks, which are usually associated to low-severity accidental scenarios. As a matter of fact, the possibility of multiple simultaneous scenarios is considered not credible as a consequence of “internal” failure causes in conventional QRA, unless “domino effect” is considered. However, domino scenarios (escalation of a primary event to involve several nearby units) require that conditions leading to an escalation sequence take place (Cozzani et al., 2005).
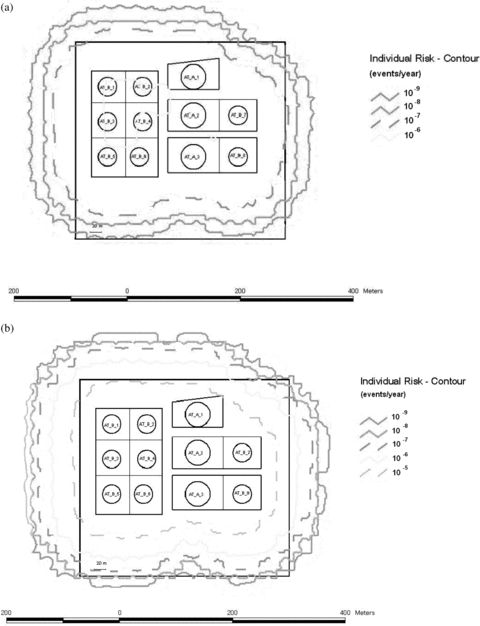
Individual risk curves for the case study of Milazzo: (a) no seismic events; (b) with accidental scenarios triggered by seismic events, having considered DS3, unanchored atmospheric storage tanks, near full.
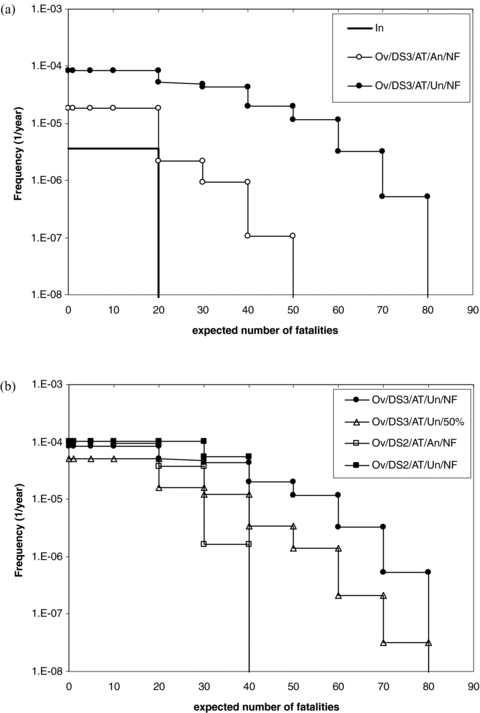
Societal risk for the case study of Milazzo: (a) without considering seismic events and considering DS3 damage states; (b) considering DS3 or DS2 damage states and different filling levels. In = internal (not considering seismic events); Ov = overall; AT = atmospheric tank; An = anchored; Un = unanchored; NF = near full; 50%: 50% filling level.
The societal risk F-N plot in Fig. 5(a) was obtained using the vulnerability model for DS3—near-full atmospheric tanks. It is important to verify the importance of the vulnerability model selected on the final results obtained for the individual and societal risk. As shown in Table II, several vulnerability models are available for atmospheric tanks that vary as a function of damage state and filling level. Fig. 2 shows that significant differences in the failure probability of different equipment categories occur for PGA values between 0.2 and 0.6 g, thus well in the range of those of the reference earthquake considered in at least one of the case studies analyzed (the Milazzo case, as shown in Table V). Fig. 5(b) reports a comparison of the different societal risk curves calculated using different vulnerability models for the tanks (models for anchored and unanchored tanks, different filling levels, and different damage states were applied). Fig. 6 reports the absolute value of the PLL index calculated from the F-N curve obtained using each vulnerability model. When seismic events are considered in the analysis, the PLL index increases from one to two orders of magnitude, depending on the type of atmospheric tanks considered (anchored or unanchored), the filling level, and the reference damage state considered. As expected, anchoring equipment reduces its seismic vulnerability, as does reducing its filling level. However, the effect of filling level is quite limited (less than a factor of 3). The actual filling level of a tank during an earthquake is not known and may be difficult to estimate. The present results may thus justify to assume near-full tanks in a QRA, since this assumption seems not overconservative on the basis of the results obtained.
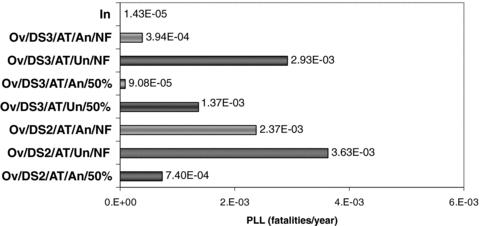
Potential life loss (PLL) calculated for the Milazzo case study from the F-N curves reported in Fig. 5. In = internal (seismic events not considered); Ov = overall; AT = atmospheric tank; An = anchored; Un = unanchored; NF = near full; 50%: 50% filling level.
3.3. Influence of the Damage State (DS)
It is important to remark that the damage state or risk state assumed for the calculation of the consequences of the LOC events may have, at least in principle, important consequences on the final values of the risk indexes. Figs. 5(b) and 6 highlight this effect for the case study of Milazzo, where only atmospheric storage tanks were considered. In the case of atmospheric tanks, Fig. 6 shows that quite similar PLL values are obtained considering either a DS2 or DS3 damage state, due to the two conflicting effects evidenced by Fig. 5(b). On one hand, higher LOC frequencies are obtained if lower DS or RS are considered. On the other hand, higher severity of LOC consequences (e.g., due to different pool fire diameters and radiation intensities) are present if higher DS or RS are considered.
The results obtained in the case of pressurized tanks are slightly different. Fig. 7 shows the societal risk and the PLL values obtained for the case study of Roma, where only pressurized tanks were considered. As shown in Fig. 7(a), which reports the societal risk curves, the severity of the LOC events following the DS2 damage state, expressed by the expected number of fatalities, are higher than those for the DS3 damage state. This is due to the specific hazard posed by pressurized tanks, for which it is reasonable to assume that the damage of connections may lead to the complete release of the inventory in 10 minutes (Uijt de Haag & Ale, 1999), as shown in Table IV. On the other hand, the higher structural resistance of pressurized tanks makes the expected probability of a DS3 damage state almost negligible. Thus, as shown by the PLL values in Fig. 7(b), the higher risk for the pressurized tank corresponds to a DS2 damage state, while the DS3 damage state yields a negligible contribution to the overall risk.
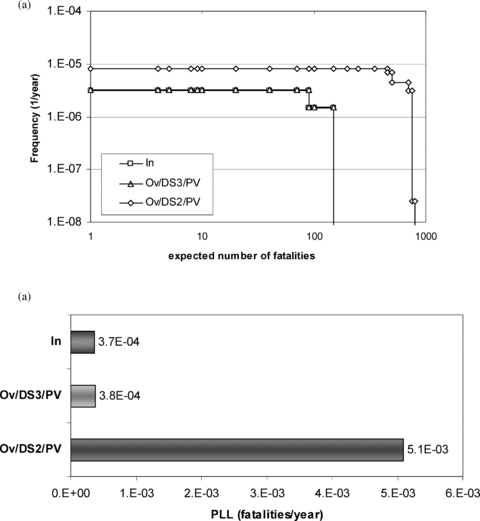
Societal risk (a) and potential life loss (b) calculated for the Rome case study. In = internal (seismic events not considered); Ov = overall; PV = pressure vessel.
The present results show that the selection of the reference damage states of interest is a key element of the analysis. The PLL values shown in Figs. 6 and 7(b) point out that not only a structural collapse, but also less-severe damage states, such as the rupture of major pipe connections, may trigger LOC events resulting in significant contributions to the overall risk. This is of particular concern in the case of pressurized vessels, which have high structural resistance but may cause severe releases even with only limited structural damage. Thus, the selection of DS2 as a reference damage state seems more correct for pressurized tanks, while the higher severity of the events suggests that DS3 is the more appropriate reference damage state in the case of atmospheric equipment. The results also suggest that risk analysts should examine multiple damage states when assessing industrial risk.
3.4. Influence of the Vulnerability of Different Equipment Categories
As shown in 4-7, concerning the case studies of Milazzo and Roma, all the risk indexes increase significantly if the risk caused by LOC events triggered by earthquakes is considered. These results are confirmed also by the case study of Livorno, as shown by Figs. 8(a) and 9. However, it is important to understand the importance of the equipment vulnerability on the results, in order to identify correctly the critical equipment to be considered in the analysis.
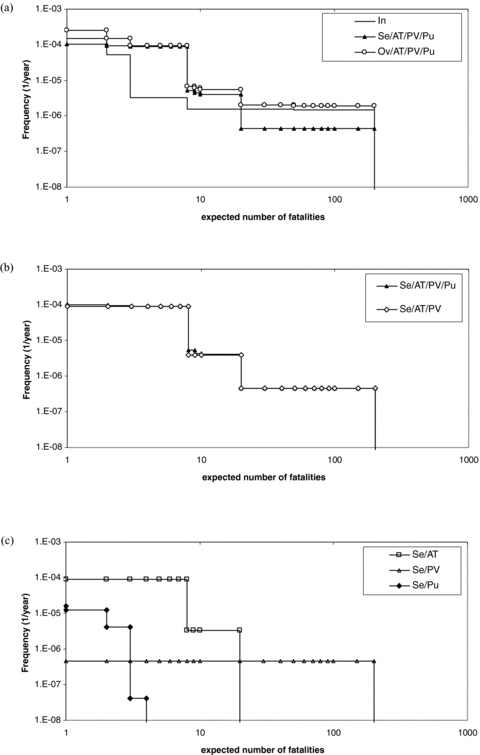
Societal risk for Livorno case study: (a) societal risk including seismic effects; (b) societal risk considering only scenarios triggered by earthquakes; (c) societal risk for different equipment categories estimated considering only scenarios triggered by earthquakes. In = internal (seismic events not considered); Ov = overall; Se = seismic (only seismic events considered); AT = atmospheric tanks; PV = pressure vessels; Pu = pumps.
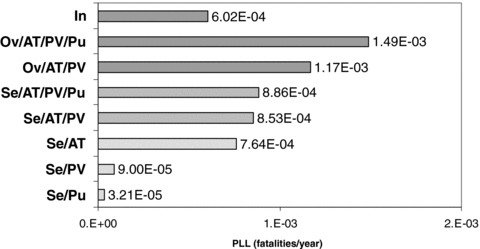
Potential life loss (PLL) for Livorno case study calculated from the F-N data reported in Fig. 8. In = internal (seismic events not considered); Ov = overall; Se = seismic (only seismic events considered); AT = atmospheric tanks; PV = pressure vessels; Pu = pumps.
Fig. 6 shows that seismic events increase the PLL index by more than an order of magnitude for unanchored atmospheric tanks. However, the PLL increase is lower in layouts where only pressurized tanks are present, as evident in Fig. 7(b). These results are confirmed by the case study of Livorno, where both atmospheric and pressurized tanks are present and the pumps of the LPG storage are also considered in the analysis. The F-N curves calculated for the case study, reported in Fig. 8, show a relevant increase in the societal risk caused by seismic events, in particular in the low-fatality region (N < 10). However, Fig. 8 shows that the contribution of the different categories of equipment to the societal risk is rather different. Fig. 8(c) reports the F-N curves calculated considering only the earthquake-induced LOC scenarios for the three different categories of equipment present in the case study (atmospheric tanks, pressurized tanks, and pumps). As shown in the figure, earthquake-induced LOCs from atmospheric tanks mainly cause frequent but low-severity scenarios (very high F values for N < 10), whereas the failure of pressurized tanks causes infrequent but severe releases (F values about two orders of magnitude lower than those of atmospheric tanks, but corresponding to maximum N values higher than 100, about an order of magnitude higher than those generated by atmospheric tanks). Finally, pumps are likely to cause low-severity scenarios that give only negligible contributions to the F-N curves. This is evidenced by Fig. 8(b), which compares the F-N curve calculated in the absence of earthquake-induced LOCs and that obtained considering only earthquake-induced LOCs in pumps. These results are supported by Fig. 9, which reports the changes in the PLL due to the seismic scenarios involving the three different categories of equipment considered. The same trends discussed above may be observed for the PLL. The figure shows that atmospheric tanks give the higher contribution to the PLL increase due to earthquakes, while the contribution of pumps is lower by about an order of magnitude.
The comparison of Figs. 8 and 9 with 5-7 shows that the influence of the different categories of equipment on the risk indexes considered is the same in the three case studies. Thus, the results obtained suggest that minor equipment having a limited hold-up, like pumps, are not likely to have an important influence on risk estimates if atmospheric or pressurized storage tanks are present. As expected, atmospheric tanks show a higher fragility to seismic events, while pressurized tanks, although yielding a lower contribution to PLL, influence the societal risk due to the higher severity of the LOC scenarios they generated.
4. CONCLUSIONS
A comprehensive methodology for the quantitative assessment of the influence of external events on industrial risk indexes was developed. The methodology is based on vulnerability models for the main process equipment categories and allows the assessment of the different simultaneous scenarios that may be triggered by the impact of the external event on process units. The general framework of the methodology may, at least in principle, be applied to the analysis of the impact of any external hazard on industrial systems where hazardous materials are present (e.g., pipelines and other transport systems).
In this study, the methodology was applied to the analysis of risks induced by earthquakes in process and chemical plants. The contributions of various scenarios triggered by earthquakes to the overall industrial risk in three case studies were analyzed, based on actual plant layouts of Italian oil refineries. Results showed in most cases an increase of the PLL by at least one order of magnitude. The main factors influencing the final risk results were the models of equipment vulnerability and the assumptions for the reference damage state of the process equipment. In particular, the results showed that risk analysts should examine multiple damage states of process equipment when assessing industrial risk caused by the impact of earthquakes.
The more critical equipment category was pressurized tanks, even if atmospheric storage tanks were more vulnerable to loss of containment. Minor process equipment having a limited hold-up (e.g., pumps) was shown to have limited influence on the final values of the risk increase caused by earthquakes.
The results obtained for the case studies evidence that external events may be significant contributors to industrial risk, being even more important than internal initiating events in specific cases.
ACKNOWLEDGMENTS
The authors gratefully acknowledge financial support from Italian National Civil Protection Service (Dipartimento della Protezione Civile della Presidenza del Consiglio dei Ministri).


