Insulin/PI3K signaling protects dentate neurons from oxygen–glucose deprivation in organotypic slice cultures
Abstract
It is known that ischemia/reperfusion induces neurodegeneration in the hippocampus in a subregion-dependent manner. This study investigated the mechanism of selective resistance/vulnerability to oxygen–glucose deprivation (OGD) using mouse organotypic hippocampal cultures. Analysis of propidium iodide uptake showed that OGD-induced duration- and subregion-dependent neuronal injury. When compared with the CA1–3 subregions, dentate neuronal survival was more sensitive to inhibition of phosphatidylinositol 3-kinase (PI3K)/Akt signaling under basal conditions. Dentate neuronal sensitivity to PI3K/Akt signaling activation was inversely related to its vulnerability to OGD-induced injury; insulin/insulin-like growth factor 1 pre-treatment conferred neuroprotection to dentate neurons via activation of PI3K/Akt signaling. In contrast, CA1 and CA3 neurons were less sensitive to disruptions of endogenous PI3K/Akt signaling and protective effects of insulin/insulin-like growth factor 1, but more vulnerable to OGD. OGD-induced injury in CA1 was reduced by inhibition of NMDA receptor or mitogen-activated protein kinase signaling, and was prevented by blocking NMDA receptor in the presence of insulin. The CA2 subregion was distinctive in its response to glutamate, OGD, and insulin, compared with other CA subregions. CA2 neurons were sensitive to the protective effects of insulin against OGD-induced injury, but more resistant to glutamate. Distinctive distribution of insulin receptor β and basal phospho-Akt was detected in our slice cultures. Our results suggest a role for insulin signaling in subregional resistance/vulnerability to cerebral ischemia.
Abbreviations used:
-
- ACSF
-
- artificial CSF
-
- CPP
-
- 3-(z-carboxypiperazin-4-yl) propyl-1-phosphonic acid
-
- DG
-
- dentate gyrus
-
- IGF-1
-
- insulin-like growth factor 1
-
- IR
-
- insulin receptor
-
- LTD
-
- long-term depression
-
- MAPK
-
- mitogen-activated protein kinase
-
- MEK
-
- Mitogen-activated protein kinase kinase
-
- OGD
-
- oxygen–glucose deprivation
-
- PBS
-
- phosphate-buffered saline
-
- PI
-
- propidium iodide
-
- PI3K
-
- phosphatidylinositol 3-kinase
Ischemic stroke leads to a complex cascade of cellular events resulting in neuronal death. Studies using in vivo ischemic animal models showed that there is differential neuronal vulnerability in the brain (Lipton 1999). In hippocampus, short periods of anoxia/ischemia resulted in loss of CA1 pyramidal cells while dentate neurons were spared (Pulsinelli 1988). Glutamate NMDA receptor-mediated excitotoxicity has been well accepted as a mechanism of neuronal death. However, the role of NMDA in the selective vulnerability pattern was questioned because of the fact that the resistant dentate neurons are also rich in NMDA receptors. Furthermore, treatment with NMDA antagonists has not been clearly shown to be of therapeutic benefit. On the other hand, some studies have indicated a significant amount of neuronal death in dentate granule cells via an apoptotic mechanism after ischemia (Kirino and Sano 1980; Wang et al. 1999; Sirén et al. 2002). Thus, studying the differential responses between these distinct cell populations offers the potential for understanding factors that are critical in neuronal death and survival.
It is known that diabetes increases the frequency of ischemic stroke incidence and ischemic stroke-induced mortality, and adversely affects post-ischemic stroke outcomes. In the rodent model of type 1 diabetes, neurogenesis, synaptic plasticity, and learning potential are compromised (Stranahan et al. 2008; Zhang et al. 2008). Recently, it was shown that neurogenesis is severely impaired in the adult type-2 diabetic Goto-Kakizaki (GK) rats, because of a decreased survival of neural progenitors in the neurogenic regions, although proliferation was increased (Lang et al. 2009). As neuronal progenitor cells are found only in the subgranular zone of the dentate in hippocampus, characterizing ischemia neuropathology of dentate neurons offers the opportunity for experimental examination of the process of injury-induced neurogenesis. Dentate neurons, which reside in the neurogenic niche, are submitted to various regulatory factors that influence cell proliferation, maturation, fate determination, and survival. Insulin and the insulin receptor (IR) are found in specific brain regions including hippocampus where they show evidence of region-specific functions, including learning and memory, through mechanisms that are different from its direct glucose regulation in the periphery (Zhao et al. 2004; Bravata et al. 2005). Insulin has a high affinity for, and can signal via insulin-like growth factor 1 (IGF-1) receptors. Insulin/IGF signaling has been shown to be a potent regulator of adult hippocampal neurogenesis (Aberg et al. 2000; Lichtenwalner et al. 2001; Trejo et al. 2008). Focal ischemia is known to significantly induce IGF-1 expression as well as neural progenitor proliferation (Gluckman et al. 1992; Dempsey et al. 2003; Yan et al. 2006). IGF-induced increase in neurogenesis involves Akt (Kalluri et al. 2007).
In this study, we hypothesized that insulin/IGF signaling plays a role in conferring the relative resistance of dentate neurons to ischemia/reperfusion-induced neurodegeneration. We used mouse organotypic hippocampal slice cultures exposed to an in vitro model of ischemia using oxygen–glucose deprivation (OGD). Slice cultures retain the cell architecture and connectivity of different anatomical subregions, as well as cell to cell functional interactions. In addition, this in vitro model offers easier pharmacological manipulations for the study of mechanisms of subregional resistance/vulnerability to ischemia. We investigated subregional sensitivity to OGD insult and insulin/IGF-mediated neuroprotection and found that the relative resistance of dentate neurons to OGD is mediated by signaling pathways involving phosphatidylinositol 3-kinase (PI3K)/Akt.
Materials and methods
Organotypic hippocampal slice cultures
Animals were handled in accordance with local guidelines for ethical use of animals in research at the University of California San Diego, which is in accordance with international guidelines. All possible efforts were made to minimize animal suffering and the number of animals used. Mouse hippocampal slice cultures were prepared and grown on semiporous membranes, according to the standard interface method (Stoppini et al. 1991) as previously described (Yao et al. 2007) with some modifications. In brief, 8-day-old CD1 mice (Charles River Laboratories, Raleigh, NC, USA) were decapitated and the dorsal hippocampi quickly isolated under aseptic conditions. The hippocampi were cut into 400 μm thick, transverse slices by a McIlwain tissue chopper, and the slices transferred to Gey’s balanced salt solution (Gibco, Paisley, Scotland) for separation and trimming of the tissue slices. Tissue slices from the middle part of the dorsal hippocampi were obtained and transferred to membrane inserts (Millicell, Bedford, MA, USA) placed in 35 mm culture dishes with 1.2 mL of serum-containing culture medium composed of basal medium Eagle’s medium (50%), Earle’s balanced salt solution (25%), horse serum (25%), and l-glutamine (1 mmol/L), supplemented with 50 U/mL penicillin/streptomycin and 10 mmol/L glucose. Cultures were maintained in a 5% CO2, 37°C incubator for 12–14 days before experiments were performed. Culture medium was half-replaced the second day after plating and twice a week thereafter until the day of treatment.
Oxygen–glucose deprivation
Oxygen–glucose deprivation was used as an in vitro model of cerebral ischemia. The inserts with slice cultures were placed into 1 mL of sucrose-containing artificial CSF (ACSF) solution composed of (in mmol/L): NaCl 129, KCl 5, CaCl2 1.3, MgCl2 1.5, NaHCO3 21, and sucrose 10 (315 mOsm, pH 7.4) following three washes using the same solution. The cultures were then placed into an airtight chamber (Billups and Rothenberg, Del Mar, CA, USA) and exposed to 5 min of 95% N2/5% CO2 gas flow. After that, the chamber was sealed for 25–60 min at 37°C. Control cultures were maintained for the same time under normoxic atmosphere in glucose-containing ACSF solution. After OGD, slice cultures were returned to their original culture conditions for 48–72 h.
Propidium iodide uptake and quantification of cell death
Cell damage was monitored and quantified by densitometric measurements of the cellular uptake of propidium iodide (PI; Sigma Chemical, St Louis, MO, USA), a fluorescent dye that intercalates into the DNA of necrotic cells that have lost plasma membrane integrity and does not penetrate living or early apoptotic cell membranes. 5 μg/mL PI was added into the culture medium 24 h before treatments and kept at the same concentration throughout the experiment. The PI uptake was recorded before any pharmacological treatments and OGD, and then at different time points after treatments. All cells were killed after experiments by submerging the cultures in sucrose (10 mM) containing ACSF solution at 4°C for 24 h, and the maximum PI uptake served as positive controls for each slice. The death of most of neurons was confirmed in our preliminary experiments by using high glutamate (up to 20 mM), or in each experiment by extending exposure time up to 72 h until no further PI uptake in the neuronal layers were detected.
The PI uptake was quantified densitometrically using Axiovision Image software (Zeiss, Yena, Germany), delineating the hippocampal subfields CA1, CA2, CA3, and dentate gyrus (DG). From the PI uptake in these subfields in each culture, measured at the different time points, the basal PI uptake recorded in the same subfields before treatments was subtracted. Maximum PI uptake after all the cells were killed served as positive controls. Cell injury was expressed as either means of PI uptake for each subregions or percentage cell death (PI uptake/maximum PI uptake). For detection of PI intensity, slices were excited with a 510–560 nm light and the emitted fluorescence was acquired at 610 nm using a rhodamine filter on an inverted fluorescence microscope (Zeiss Axiovert 200 M microscope). Images were taken using a Charged coupled device (CCD) camera and analyzed on a PC with Axiovision imaging-processing software (Zeiss). The fluorescence intensity was measured offline and damage was given as the integral density of PI intensity in CA1, CA2, CA3, and DG regions.
Pharmacological agents and glutamate treatments
In the interface culture method used in this study, glial cells redistribute into a thin layer at the bottom of the culture. This layer of glial cells forms an interface between tissue and culture medium (Buchs et al. 1993), and may function as a diffusion barrier and prevent access of some pharmacological agents from getting to neurons. To facilitate access of glutamate to neurons, slice cultures were treated by submersion. Other agents were treated by applying a thin layer of drug-containing solutions above the top of slice cultures and letting it diffuse through the slice culture. Control cultures were treated in the same manner with drug-free solutions, to prove that the procedure itself was harmless. Doses used in this study were chosen according to the literature, and also based on our preliminary studies. Insulin, IGF-1, and signaling pathway blockers were applied 24 h before and during OGD exposure, and glutamate receptor blockers were applied 1 h before and during OGD.
Immunofluorescence staining in slice cultures
The slice cultures (at days in vitro 12–14) were fixed in 4%p-formaldehyde for 6 h at 4°C and then permeabilized with 1% Triton X-100 in phosphate-buffered saline (PBS) overnight at 4°C. The slices were incubated in 10% goat serum for 1 h before being treated for 3 days with either a rabbit anti-IRβ (C-terminal) polyclonal antibody (1 : 100; Santa Cruz Biotechnology, Santa Cruz, CA, USA) or a rabbit anti-phospho-Akt (Ser473) monoclonal antibody (1 : 100; Cell Signaling, Danvers, MA, USA) in antibody diluent (Invitrogen, Carlsbad, CA, USA) at 4°C. After thorough washes, slices were incubated overnight at 4°C with Alexa 488-labeled anti-rabbit IgG (1 : 500; Invitrogen). After several PBS washes, slices were mounted on slides with Prolong antifade reagent with 4′,6-diamidino-2-phenylindole (DAPI) (Invitrogen). Immunofluorescent images were obtained and analyzed using confocal microscopy (Olympus FV1000, Olympus America Inc., Center Valley, PA, USA). In control experiments, primary antibodies were omitted and no fluorescence signals were detected.
Drugs
Insulin and IGF-1 were purchased from Sigma Chemical. Wortmannin, triciribine, and SP600125 were from BIOMOL Research Laboratories Inc. (Plymouth Meeting, PA, USA). PD98059 and U0126 were obtained from Cayman Chemical (Ann Arbor, MI, USA). Before each use, insulin was first solubilized in dH2O (pH 2.0, adjusted with HCl) at 0.4 mM, and then diluted in the testing solution to the final concentrations used. IGF-1 was dissolved in PBS containing 0.1% bovine serum albumin. All other drugs were dissolved in dimethyl sulfoxide (Sigma Chemical). The same amounts of solvents were added to the control slice cultures and were found to have no effects.
Statistical analysis
Data are expressed as mean ± SEM and analyzed for statistical significance by Student’s t-test and one-way anova for within and between group comparisons, respectively. Differences between mean values were considered significant when p < 0.05.
Results
Distinctive sensitivity of hippocampal subregions to OGD
Among hippocampal subregions, the CA2 subfield has not been studied as much, especially in slice culture preparations, because CA2 is a rather small part and more difficult to identify than CA1 and CA3. In our experimental conditions, however, we identified a distinct group of cells in CA2 region that had a higher incorporation of PI 3 h after exposure to OGD for 45 min or longer (Fig. 1a and d). This is distinctively different from the relative resistance that CA2 neurons exhibit to glutamate excitotoxicity (Fig. 1b and d). These and other properties we later characterized not only helped to identify the CA2 subregion in our study (Fig. 1c), but also provided evidence that CA2 neurons are functionally distinctly different from their neighboring CA1 and CA3 neurons.
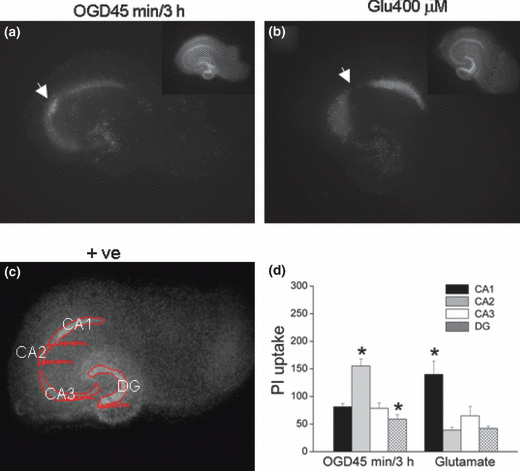
Distinctive hippocampal subregional sensitivity to OGD and glutamate. (a and b) Representative photomicrographs of slices stained with PI 3 h after a 45 min exposure to OGD (a) or 24 h after 2 h exposure to glutamate (400 μM, submerged, b). Insets: positive controls of the same slices after most of neurons were killed by submerging slices in ACSF/sucrose at 4°C for 24 h. (c) A representative photomicrograph of a positive control slice culture after most of cells was killed, showing four subregions measured for quantitative analysis of PI uptake. (d) Quantitative analysis of PI uptake in CA1 (black bars), CA2 (hatched bars), CA3 (open bars), and DG (crossed bars) after OGD or glutamate. OGD45 min/3 h group: 45 min OGD followed by 3 h reperfusion, n = 18 slices; Glutamate group: 2 h glutamate (400 μM) exposure (submerged) followed by 24 h reperfusion, n = 18; +ve: positive control. Bars represent the mean ± SEM; *significantly different from other subregions with the same treatments, one-way anova, p < 0.05.
To further determine subregion-, time-, and duration-dependent sensitivity of hippocampal neurons to OGD, we subjected slice cultures to 25, 40, and 45 min OGD and measured PI uptake in CA1, CA2, CA3, and DG before, 3 h, and 24 h after OGD exposure. Slice cultures exposed to OGD for 25 min exhibited little neuronal damage after 3 h reperfusion, and there was only very mild PI uptake in CA1 subregion after 24 h (Fig. 2a and d). However, 40 min OGD induced marked PI fluorescence uptake in the CA1 and CA3 subregions (Fig. 2b, d, and e), with less neuronal damage detected in DG granule neuronal layer and CA2 subregions. Significant injury was detected in all subregions including CA2 and DG after 24 h reperfusion following a further increase in duration of OGD exposure (Fig. 2c, d, and e). There was marked PI uptake in all subregions after OGD for 45 min or longer (data not shown). These data suggest that CA1 and CA3 neurons are more vulnerable to OGD than CA2 neurons and DG granule neurons. Relative resistance of DG was exhibited in two ways: (i) only more severe insults (longer duration of OGD) induced cell injury and (ii) a lower percentage of cell death was seen compared with other subregions subjected to the same milder insults. As DG has higher cell density compared with CA subregions, a comparable PI uptake value represents a smaller percentage of cell death than CA subregions (Fig. 2).
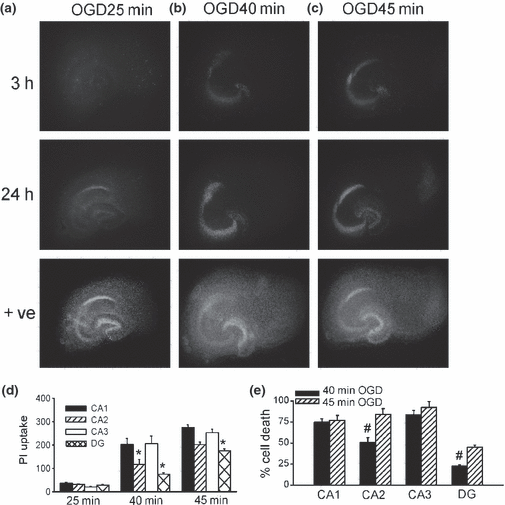
Hippocampal subregional duration-dependent sensitivity to OGD. (a–c) Representative photomicrographs of slices stained with PI 3 and 24 h after exposure to OGD for 25 (a), 40 (b), or 45 min (c); +ve: positive control. (d) Quantitative analysis of PI uptake in CA1 (black bars), CA2 (hatched bars), CA3 (open bars), and DG (crossed bars), 24 h after exposure to OGD for 25 (n = 6), 40 (n = 6), and 45 min (n = 59); *significantly different from other subregions in the same OGD duration groups, one-way anova, p < 0.05. (e) Percentage cell death (PI uptake normalized to maximum PI uptake from positive control) induced by OGD exposure for 40 min (black bars) or 45 min (hatched bars) followed by 24 h reperfusion; #significantly different from 45 min OGD group in the same subregions. Student’s unpaired t-test, p < 0.05. Bars represent the mean ± SEM.
Insulin/IGF protects against cell injury induced by OGD
The hippocampus has a high number of IRs (Steen et al. 2005). Insulin/IGF-1 has been shown to have neuroprotective effects against memory loss in humans (Benedict et al. 2007), and plays a role in promoting survival of newly formed neurons in DG in diabetic animal models (Lang et al. 2009). Thus, we next examined the effects of insulin and IGF-1 on responses of hippocampal subregions to OGD. We chose a 45 min OGD for further study as there was marked PI uptake in DG after this exposure time (Fig. 2). Quantification of PI uptake showed that pre-treatment for 24 h with insulin (1–10 μM) or IGF-1 (0.1–1 μM) dose-dependently reduced OGD-induced injury in all subregions with differential subregional sensitivity (Fig. 3a–c). Both insulin and IGF treatments protected neurons with similar subregional selectivity. At lower concentrations, insulin/IGF markedly reduced injury in DG and CA2 subregions, but not CA1 and CA3 (Fig. 3). A reduction in PI uptake in CA1 and CA3 was observed at higher concentrations of insulin (10 μM) and IGF (1 μM), although only the latter reached statistical significance (Fig. 3c). The lack of effect of insulin in the CA1 subregion is not because of a more severe injury in CA1 than the DG subregion, because insulin did not protect CA1 even with less severe insults while there was little injury in DG (50 ± 5% and 53 ± 5% cell death induced by OGD in CA1 in the absence and presence of insulin, respectively). Thus, sensitivity of hippocampal subregions to insulin/IGF-mediated neuroprotection is higher in DG and CA2 than CA1 and CA3, which is opposite to the order of their sensitivity to OGD insult (Fig. 2). As 1 μm insulin-induced submaximal effects in the DG subregion (Fig. 3d), we chose the dose of 1 μM insulin to further investigate a probable mechanism by which insulin exerts its subregional selective neuroprotective effects.
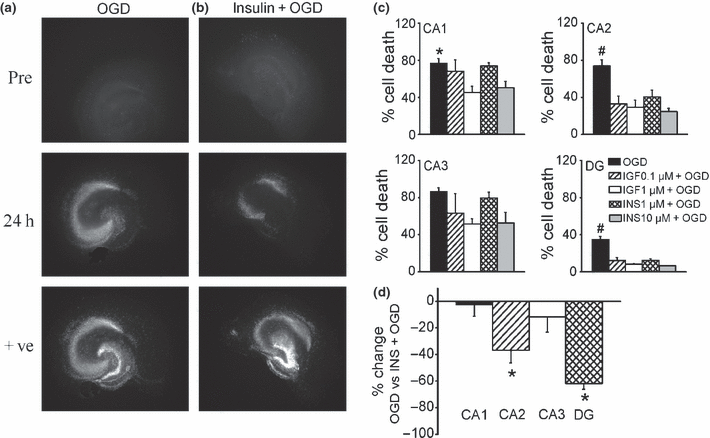
Protective effect of insulin/IGF against OGD-induced cell injury in organotypic hippocampal slice cultures. (a and b) Representative photomicrographs of slices stained with PI before and 24 h after 45 min exposure to OGD in a control slice (a) or a slice pre-treated with insulin (1 μM) for 24 h (b); +ve: positive controls. (c) Quantitative analysis of hippocampal subregional cell injury (% cell death: PI uptake normalized by maximum PI uptake in positive controls) 24 h after exposure to 45 min OGD. Black bars, OGD alone, n = 59; hatched bars, OGD in IGF-1 (0.1 μM, 24 h) pre-treated slices, n = 6; open bars, OGD in IGF-1 (1 μM) pre-treated slice cultures, n = 6; crossed bars, OGD in insulin (1 μM) pre-treated slices, n = 43; gray bars, OGD in insulin (10 μM) pre-treated slices, n = 6; *significantly different from 1 μM IGF-1 treatment group in CA1 and #significantly different from all other treatments in the same subregions; one-way anova, p < 0.05. (d) Percentage change in OGD-induced PI uptake (45 min OGD duration followed by 24 h reperfusion) in insulin (1 μM) pre-treated slices compared with those of untreated slices. For each experiment, data were averaged and a percentage change was calculated, n = 8 experiments. Bars represent the mean ± SEM; *significantly different between untreated and insulin treated cultures, Student’s unpaired t-test, p < 0.05.
The neuroprotective effect of insulin involves PI3K/Akt pathway
Insulin can activate several signaling pathways, including PI3K/Akt pathway. We next carried out experiments using inhibitors of PI3K signaling such as wortmannin (Wortm; a potent specific PI3K inhibitor), and triciribine (a specific inhibitor of Akt). Under basal conditions, wortmannin (0.1–1 μM, 24 h) did not have any effects on the PI uptake. However, at higher concentrations, Wortmannin (10 μM) selectively induced cell injury in the DG subregion, which was attenuated in the presence of insulin (Fig. 4a and b). Inhibition of PI3K by wortmannin preferentially induced cell injury in the inner DG granule cell layer where newly formed neurons are found (Fig. 4a; Parent 2003). These data suggest that under normal conditions DG neuronal survival is more critically dependent on PI3K signaling than CA regions, possibly via neurogenesis-associated survival mechanisms. Although wortmannin alone did not appear to alter OGD-induced neuronal injury in CA and DG, the protective effects of insulin were prevented in the presence of Wortmannin, even at concentrations that had no effects on basal conditions (Fig. 4c). These data indicated that insulin protects neurons from OGD-induced injury through activating PI3K signaling. Similarly, triciribine selectively induced cell injury in the DG subregion at a higher concentration (10 μM, 24 h) under basal conditions which was prevented by insulin (Fig. 5a and b). However, triciribine (1 μM) prevented insulin-induced reduction in OGD-induced injury (Fig. 5c). CA1 and CA3 subregions were less sensitive to basal PI3K/Akt inhibition as well as protective effects of insulin against OGD. The CA2 subregion is unique in that it was less sensitive to endogenous PI3K/Akt inhibition compared with DG, but more sensitive to insulin protection than CA1 and CA3 (4, 5). Taken together, these data suggested that dentate neurons are more dependent on endogenous PI3K/Akt signaling pathways than CA neurons in the maintenance of neuronal survival/death homeostasis, and the action of insulin in protecting dentate neurons from OGD-induced injury is critically dependent on PI3K/Akt signaling pathway.
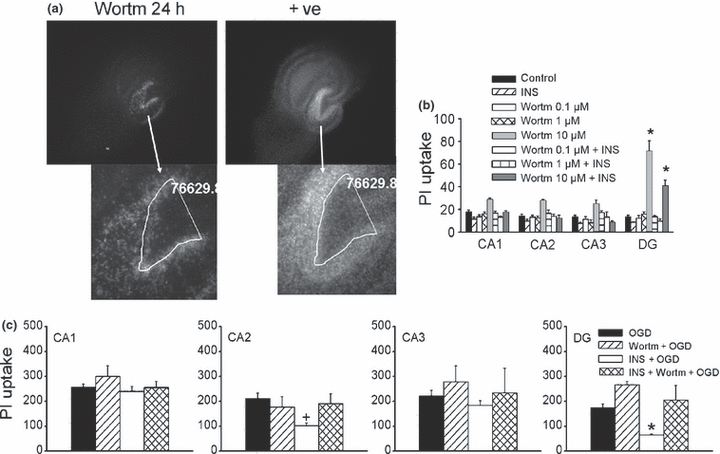
Effects of Wortmannin on subregional cell survival/death in organotypic hippocampal slice cultures. (a) Representative photomicrographs of slices (upper) after 24 h wortmannin (10 μM) treatment (left) and post-treatment to induce maximum death as positive control (right), and enlarged DG subregion (lower). The white lines and numbers are reference lines and their enclosed areas indicating relative location of Wortmannin-induced injury in DG. (b) Quantitative analysis of hippocampal subregional PI uptake after wortmannin exposure in the presence and absence of insulin. Control, untreated slices; INS, insulin (1 μM, 24 h) treated slices; Wortm0.1–10 μM, slices were treated with 0.1–10 μM wortmannin for 24 h; Wortm0.1–10 μM + INS, slices were treated with 0.1–10 μM wortmannin in the presence of insulin (1 μM) for 24 h. (c) Quantitative analysis of subregional PI uptake 24 h after 45 min exposure of OGD. OGD, OGD in untreated slices, n = 20; Wortm + OGD, wortmannin (1 μM) pre-treated slices were exposed to OGD, n = 12; INS + OGD, OGD in insulin (1 μM) pre-treated slices, n = 29; INS + Wortm + OGD: insulin (1 μM) and wortmannin (1 μM) pre-treated slices were exposed to OGD, n = 12. Bars represent the mean ± SEM; *significantly different from other treatment groups in the same subregion and +significantly different from OGD group in CA2; one-way anova, p < 0.05.
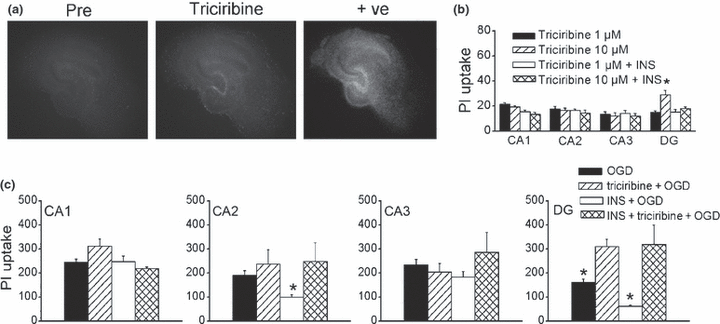
Effects of triciribine on subregional cell survival/death in hippocampal slice cultures. (a) Representative photomicrographs of slice cultures before (pre), after triciribine (10 μM) for 24 h (triciribine), and post-treatment to induce maximum death as positive control (+ve). (b) Quantitative analysis of hippocampal subregional PI uptake after 24 h triciribine exposure (1–10 μM) in the presence and absence of insulin (1 μM). (c) Quantitative analysis of subregional PI uptake induced by 45 min OGD followed by 24 h reperfusion. OGD, OGD alone in untreated slices, n = 6; triciribine + OGD: triciribine (1 μM) pre-treated slices were exposed to OGD, n = 6; INS + OGD, OGD in insulin (1 μM) pre-treated slices, n = 12; INS + triciribine + OGD: insulin (1 μM) and triciribine (1 μM) pre-treated slices were exposed to OGD, n = 12; Bars represent the mean ± SEM; *significantly different from other treatment groups in the same subregions; one-way anova, p < 0.05.
Insulin neuroprotection is not mediated by MAPK pathway
As insulin was shown to activate both PI3K and mitogen-activated protein kinase (MAPK) pathways, we next studied the role of MAPK pathway in insulin action using PD98059 (10 μM), an inhibitor of Mitogen-activated protein kinase kinase (MEK)/extracellular signal-regulated kinase pathway, U0126 (1–10 μM), a potent and selective MEK inhibitor, and SP600125 (1 μM), a c-Jun N-terminal kinases (JNK) inhibitor. We found that none of the three inhibitors had any effects on basal cell survival in CA and DG subregions at the concentrations used (data not shown), nor did they prevent insulin-induced reduction in PI uptake against OGD-induced cell injury in DG and CA2 (Fig. 6). These data suggested that the neuroprotective effects of insulin are not mediated by activating MAPK pathway. Furthermore, it appeared that blocking MAPK pathway further protected CA1 neurons in the presence of insulin (Fig. 6a), suggesting that activation of MAPK signaling by insulin may contribute to insensitivity to insulin/PI3K/Akt-mediated protection. However, we did not see a consistent effect of MAPK inhibitors alone on OGD-induced neuronal injury, either pre-treated for 24 h or 1 h prior to OGD (data not shown). As PI3K and MAPK signaling has been shown to act antagonistically (van der Heide et al. 2003; Hui et al. 2005), we hypothesized that the effects of MAPK signaling may be enhanced by blocking PI3K. Indeed, compared with wortmannin (10 μM) alone, U0126 (10 μM) in the presence of wortmannin markedly reduced OGD-induced cell injury in CA subregions but to a lesser extent in DG (PI uptake was 310 ± 19 vs. 187 ± 45 in CA1, 310 ± 22 before vs. 260 ± 29 in DG, wortmannin alone vs. wortmannin + U0126, respectively, n = 12). These data suggested that the insulin/MAPK pathway may act to antagonize insulin/PI3K/Akt and contribute to the relative resistance of CA1 and CA3 to insulin/IGF protection, as well as their relative vulnerability to OGD.
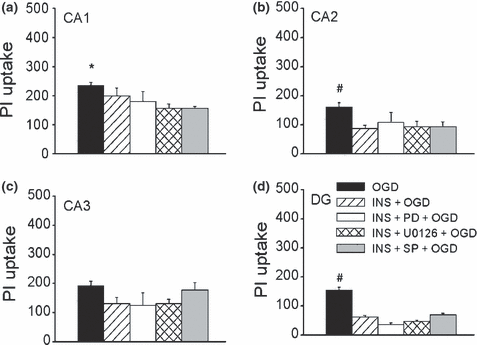
Effect of inhibitors of MAPK signaling on OGD-induced cell injury in insulin pre-treated slices. (a–d) Histograms represent the quantitative analysis of PI uptake induced by 45 min OGD followed by 24 h reperfusion in CA1 (a), CA2 (b), CA3 (c), and DG (d). OGD, untreated slices were exposed to OGD, n = 29; INS + OGD, OGD in insulin (1 μM, 24 h) pre-treated slices, n = 12; INS + PD + OGD: insulin (1 μM) and PD98059 (10 μM) pre-treated slices were exposed to OGD, n = 12; INS + U0126 + OGD: insulin (1 μM) and U0126 (10 μM) pre-treated slices were exposed to OGD, n = 18; INS + SP + OGD, insulin (1 μM) and SP600125 (10 μM) pre-treated slices were exposed to OGD, n = 6; Bars represent the mean ± SEM; *significantly different from INS + U0126 + OGD and INS + SP + OGD groups in CA1 and #significantly different from other treatment groups within the same subregions; one-way anova, p < 0.05.
NMDA receptor-dependent OGD-induced cell injury
It was shown that insulin modulates CA1 neuronal activity in a NMDA receptor-dependent manner (van der Heide et al. 2005). Thus, its action may involve direct (synaptic activity independent, IR mediated) or indirect (synaptic activity dependent, NMDA mediated) actions. Thus, we next used NMDA receptor blocker 3-(z-carboxypiperazin-4-yl) propyl-1-phosphonic acid (CPP) to examine the mechanisms of cell injury induced by OGD in insulin pre-treated slices. We found that CPP (10 μM) in the presence of insulin (1 μM) nearly completely blocked 45 min OGD-induced PI uptake in all subregions (Fig. 7a–c). We also tested protective effects of insulin and CPP against 50 min OGD. We found that 10 μM CPP alone did not significantly reduce PI uptake induced by OGD (PI uptake was 276 ± 22 vs. 264 ± 47 in the absence vs. presence of CPP, n = 11). At a higher concentration, CPP (30 μM) induced partial neuroprotection, as was seen with 1 μM insulin, which selectively protected DG and CA2 neurons (Fig. 7d). However, a combination of CPP (10–30 μM) and insulin (1 μM) nearly completely blocked the cell injury induced by OGD in all CA subregions (Fig. 7). These data suggested that with a more severe OGD insult, multiple mechanisms may need to be targeted to effectively prevent neuronal death.
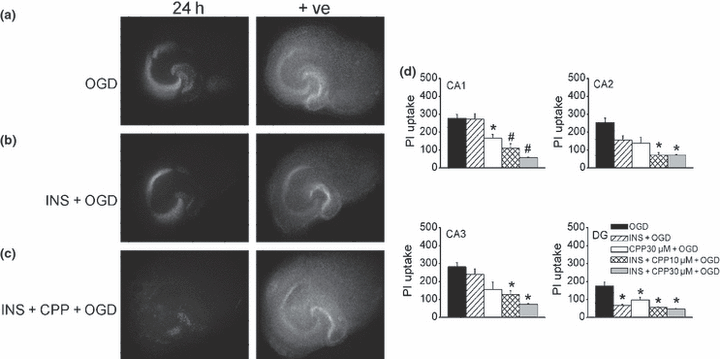
Effect of NMDA receptor blockers and insulin on OGD-induced subregional injury. (a–c) Representative photomicrographs of slices stained with PI 24 h after 45 min OGD in a control slice (a), a slice pre-treated with insulin (1 μM) for 24 h (b), and an insulin pre-treated slice exposed to CPP (10 μM) for 1 h before and during OGD (c); +ve: positive controls. (d) Quantitative analysis of hippocampal subregional PI uptake 24 h after 50 min OGD. OGD: untreated slices were exposed to OGD, n = 16; INS + OGD: insulin (1 μM) pre-treated slices were exposed to OGD, n = 18; CPP 30 μM + OGD: slices were treated with 30 μM CPP 1 h before and during exposure to OGD, n = 5; INS + CPP 10 μM + OGD: insulin (1 μM) pre-treated slices were treated with CPP (10 μM, 1 h) before OGD exposure, n = 11; INS + CPP 30 μM + OGD: insulin (1 μM) pre-treated slices were treated with CPP(30 μM, 1 h) before OGD exposure, n = 5. Bars represent the mean ± SEM; *significantly different from OGD groups in the same subregions and #significantly different from OGD and INS + OGD groups in CA1; one-way anova, p < 0.05.
Insulin receptor β and basal phospho-Akt immunoreactivity in hippocampal slice cultures
Insulin receptor mRNA and protein have been found in brain regions including hippocampus from in vivo animal models (Marks et al. 1990; Zhao et al. 1999; Park et al. 2009). We next tested the distribution of IRs and endogenous phospho-Akt (p-Akt) in our slice culture preparations, using antibodies against IRβ subunit (C-terminal) and p-Akt (Ser473) in untreated slice cultures. We found that IRβ immunoreaction was detected in all subregions of hippocampus, with higher expression in the neuropil than in cell body layers (Fig. 8a, n = 4). A strong signal was detected in the molecular and polymorphic layers of the DG, in the alveus and stratum lacunosum-moleculare, the mossy fibers and Schaffer collaterals in the CA regions (Fig. 8a). In contrast, higher levels of endogenous p-Akt were detected in the pyramidal cell layer of CA subregions and the molecular layer of the DG (Fig. 8b, n = 14), with lower expression in the polymorphic layer and the inner granule cell layer of DG, where neurons were most sensitive to blockade of PI3K/Akt (4, 5, 8). Our data confirmed that insulin signaling is detected in our slice cultures and its activation may protect neurons from OGD-induced injury.
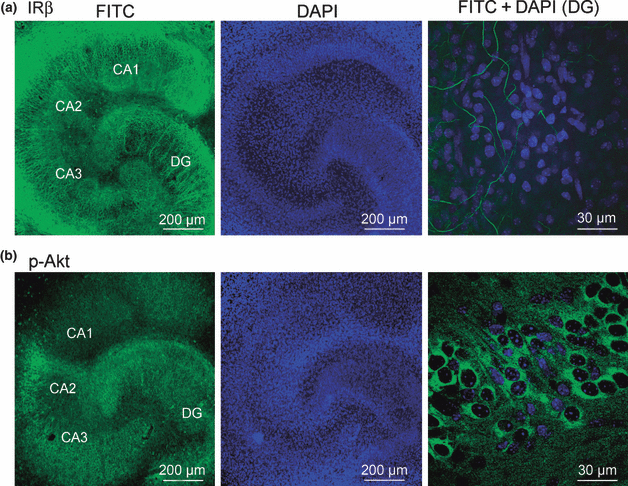
Confocal images of insulin receptor and phospho-Akt immunofluorescence in hippocampal slice cultures. (a and b), images of two slice cultures with immunoreactivity staining (FITC in green) of insulin receptor β subunit (IRβ; a) or phospho-Akt (p-Akt; b), DAPI counterstained nucleus (blue), and higher magnification of insulin receptor β stained fibers (green; a) or p-Akt stained cell bodies (green; b), overlaid with DAPI stained nucleus (blue) in DG.
Discussion
In this study, we found that there is a distinctive subregional sensitivity of hippocampus to OGD-induced injury and insulin neuroprotection. Insulin protects DG neurons via activation of PI3K/Akt pathway, whereas CA1 appears to be less sensitive to this signaling. Our data suggest that a severe ischemia insult, which results in injury in both vulnerable and resistant neurons, multiple mechanisms may need to be targeted for neuroprotection.
Insulin and IRs are found in specific brain regions with poorly understood functions (Benedict et al. 2007). In our study, IRs are detected predominantly in fiber pathways. Both insulin and IGF-1 protected hippocampal neurons with similar subregional selectivity. The concentrations we used for both insulin and IGF-1 would likely activate both receptors and the downstream signaling. IR and IGF-1 receptor are structurally highly homologous to each other. Both receptors can bind insulin and IGF-1 and activate similar intracellular signaling pathways, yet differentially regulate expression of a subset of genes encoding adhesion, transcription, transport, and proliferation molecules. Insulin stimulates both the PI3K and the MAPK/extracellular signal-regulated kinase pathways (Halevy and Cantley 2004), which play an important regulatory role in cell survival and death. PI3K pathway is believed to be an important anti-apoptotic signaling pathway in neurons (Yuan and Yankner 2000), whereas MAPKs are activated by a variety of extracellular stimuli, and may contribute to either survival or death, possibly depending on the nature and severity of injury, or the specific cell type (Runden et al. 1998; Alessandrini et al. 1999; Slevin et al. 2000; Dash et al. 2002; Cavanaugh 2004; Chu et al. 2004; Hetman and Gozdz 2004). A substantial body of literature exists regarding the vulnerability of CA1 pyramidal neurons but not DG granule neurons to ischemia insults (Pulsinelli 1988; Lipton 1999). This differential sensitivity or vulnerability of the distinct neuronal populations allows for the examination of critical factors in cell death and survival. In this study, we have shown that insulin/PI3K/Akt pathway plays different roles in different neuronal populations in their homeostasis of survival/death. DG neurons are sensitive to the regulation of insulin/PI3K/Akt signaling both in normal and ischemic conditions and this signaling may be critical in conferring relative resistance of these neurons to ischemia. MAPKs play a less dominant role in DG neuronal survival/death. On the other hand, when compared with DG neurons, CA1 neurons are less sensitive to disruptions of endogenous PI3K/Akt signaling, as well as the protective effects of insulin-induced activation of PI3K/Akt signaling against OGD-induced injury. The different sensitivity of CA1 and DG subregions to this insulin signaling pathway might be because of different expression levels of signaling molecules. As we have shown, in contrast to CA subregions which have high levels of basal p-Akt in the pyramidal cell layer, a relatively lower level of endogenous p-Akt is detected in the inner granule cell layer compared with the molecular layer of DG. This may contribute to its vulnerability to PI3K and Akt blockers under basal conditions, as well as a higher sensitivity to the activation of insulin signaling. In the presence of insulin, MEK inhibitors reduced injury induced by OGD in the CA1 subregion. MAPK activation may contribute to the relative resistance of CA1 to insulin protection, as well as their relative vulnerability to ischemia, by antagonizing PI3K/Akt activation. As OGD-induced injury in CA subregions was prevented by NMDA receptor antagonist in the presence of insulin, it is possible that CA subregions respond to insulin in a more complex manner involving direct activation of IR and indirect actions of insulin via synaptic activity-dependent stimulation of NMDA receptors (van der Heide et al. 2005; Moult and Harvey 2008), and activation of MAPK signaling (van der Heide et al. 2003, 2005; Hui et al. 2005). It is possible that PI3K and MAPK signaling play a role in the relative resistance/vulnerability of CA subregions to ischemia via modulation of synaptic plasticity (English and Sweatt 1997; van der Heide et al. 2005). Our data suggest that targeting multiple mechanisms involving NMDA receptor-mediated excitotoxicity and disruption of basal survival/death homeostasis is critical for neuroprotection under ischemia/reperfusion.
The hippocampus is critical for some forms of memory and spatial navigation, but previous research has mostly neglected the CA2, a unique region situated between CA3 and CA1. CA2 can be clearly delineated from its neighboring CA regions by expression patterns of cellular markers such as fibroblast growth factor 2 (Williams et al. 1996), Purkinje cell protein 4 (Zhao et al. 2001; Lein et al. 2005), vasopressin receptor (Young et al. 2006), and α-actinin 2 (Wyszynski et al. 1998). In addition, neurons in CA2 region are resistant to seizure generation (Sloviter 1983), and hypoxia/ischemia (Sadowski et al. 1999), but vulnerable in schizophrenia (Benes et al. 1998). Thus, CA2 of hippocampus appears to be distinctively different from the other CA regions with respect to death and survival from injury. In this study, we found that CA2 neurons respond to OGD and insulin differently from other CA regions. They are more resistant to glutamate, OGD, and appeared to be sensitive to the protective action of insulin after OGD insult. And yet, unlike DG neurons, they are insensitive to disruptions of PI3K/Akt signaling under basal conditions. There is a growing body of evidence to suggest that insulin can influence synaptic plasticity in the CNS. Insulin evokes long-term depression (LTD) of excitatory synaptic transmission via PI3K signaling in hippocampal slices (Man et al. 2000; van der Heide et al. 2005). It was shown that long-term potentiation but not LTD is absent in CA2 neurons (Zhao et al. 2007). It is also possible that the sensitivity of CA2 neurons to insulin protection may be partly mediated by modulation of synaptic plasticity such as induction of LTD.
It is well established that there is a link between stroke and diabetes. In diabetic rat models infarct volumes are greater following middle cerebral artery occlusion when compared with non-diabetics (Rizk et al. 2005). Impaired insulin sensitivity is associated with stroke, independent of glucose level (Bravata et al. 2005). In rodent models of diabetes, compromised synaptic plasticity and learning are associated with decreased survival of neural progenitors and impaired neurogenesis (Stranahan et al. 2008; Zhang et al. 2008; Lang et al. 2009). On the other hand, diabetes and ischemic stroke can trigger endogenous neurotropic and protective activity, such as increasing the expression of IGF-1 and its receptors (Beilharz et al. 1998; Guan et al. 2001; Yan et al. 2006), and inducing neural progenitor proliferation in the DG (Yan et al. 2006). IGF-1 infusion significantly increases neural progenitor proliferation (Dempsey et al. 2003), and promotes survival of the newly formed cells (Lang et al. 2009). It is known that PI3K signaling promotes self-renewing properties of stem cells but inhibit differentiation, whereas MAPK signaling promotes differentiation (Hori et al. 2002; Qi et al. 2004). In our study, DG neurons are sensitive to alterations of PI3K/Akt signaling under normal and ischemic conditions. It is possible that the neurogenesis-associated survival promoting signaling confers relative resistance of DG neurons to ischemia. Complex processes such as neuronal repair and remodeling after insult are mediated by the synergistic action of many factors. Selectively enhancing the survival promoting activity after the initial insult through the use of therapeutic agents may reduce brain injury and facilitate functional recovery after ischemic stroke.
Acknowledgements
This project was supported by NIH grant PO1HD032573 and the UCSD neuroscience microscopy shared facility Grant P30NS047101. We wish to thank Orit Gavrialov, Shirley Reynolds, and Jennifer Meerloo for their technical assistance.


