The role of pharmacokinetics/pharmacodynamics in setting clinical MIC breakpoints: the EUCAST approach
Abstract
Clin Microbiol Infect 2012; 18: E37–E45
Clinical breakpoints are used in clinical microbiology laboratories to categorize microorganisms as clinically susceptible (S), intermediate (I) or resistant (R) dependent on the quantitative antimicrobial susceptibility as indicated by the MIC value determined in a well-defined standard test system. The laboratory report, with the designations of S, I or R for each antimicrobial agent, provides guidance to clinicians with respect to the potential use of agents in the treatment of patients, and clinical breakpoints should therefore distinguish between patients that are likely or unlikely to respond to antimicrobial treatment. In Europe, clinical breakpoints are set by the European Committee on Antimicrobial Susceptibility Testing (EUCAST), following a defined procedure. This includes evaluation of efficacy in experimental settings and clinical studies to derive pharmacodynamic targets such as the fAUC/MIC ratio or %fT > MIC required for efficacy, the pharmacokinetic properties of the agent, Monte Carlo simulations to estimate exposures of the antimicrobial agent in the target patient population and commonly used dosing regimens. The probability of target attainment is subsequently determined for a range of pharmacodynamic targets and the results from the Monte Carlo simulations. The breakpoints derived are subsequently evaluated with respect to the wild-type population of the target microorganisms, specific resistance mechanisms and other relevant data. In this paper, we provide an overview of the EUCAST process and considerations for setting pharmacokinetic/pharmacodynamic breakpoints. These are the breakpoints that in the EUCAST breakpoint tables are referred to as ‘non-species-related breakpoints’.
Introduction
Clinical breakpoints are used in clinical microbiology laboratories to categorize microorganisms as clinically susceptible (S), intermediate (I) or resistant (R) dependent on the quantitative antimicrobial susceptibility as indicated by the MIC value determined in a well-defined standard test system. The laboratory report, with the designations of S, I or R for each antimicrobial agent, provides guidance to clinicians with respect to the potential use of agents in the treatment of patients. The definition of susceptible by the European Committee on Antimicrobial Susceptibility Testing (EUCAST) is that ‘A microorganism is defined as susceptible by a level of antimicrobial activity associated with a high likelihood of therapeutic success. A microorganism is categorized as susceptible by applying the appropriate breakpoint in a defined phenotypic test system,’ [1–3]. Conversely, resistance is defined as a high likelihood of therapeutic failure. Ideally, clinical breakpoints should therefore distinguish between patients that are likely or unlikely to respond to antimicrobial treatment. Setting breakpoints involves several factors, including clinical results from various types of study, wild-type MIC distributions for relevant species of organisms, antimicrobial dosing and pharmacokinetic (PK) and pharmacodynamic (PD) aspects. In this paper, we provide an overview of the EUCAST process and considerations for setting PK/PD breakpoints. These are the breakpoints that in the EUCAST breakpoint tables are referred to as ‘non-species-related breakpoints’.
Defining a Pharmacodynamic Target
The key phrase in the EUCAST definitions of susceptible and resistant is ‘by a level of antimicrobial activity’. This indicates that the concentrations, as well as the concentration–time profile of the antimicrobial agent in the patient, should be such that an adequate response to therapy can be expected. In turn, this implies that a certain relationship exists between the efficacy of an agent and the concentration–time profile and that a prediction of the likelihood of successful treatment can be made. It has been one of the most important developments of the last decade that antimicrobial agent concentration–effect relationships (or rather exposure–response relationships, as the concentration of the agent that the infecting organism is exposed to changes over time) have become apparent. Also, exposures required for particular responses, such as the probability of successful treatment outcome, have been established. These findings were recently summarized by Ambrose et al. [4], who showed that exposures required for microbiological and clinical cure in preclinical models and in humans were in a similar range.
An important consideration is that the efficacy of an antimicrobial agent is dependent on the relationship between the MIC for the microorganism and the exposure of the microorganism to the agent in the patient (or other host). Clinical outcome is dependent on the triangular relationship between MIC, exposure and efficacy [5]. In turn, exposure of the microorganism to the agent in the patient is dependent on the dose and the pharmacokinetic properties of the drug. For many agents the efficacy of the non-protein bound, free (f) agent in serum is correlated with the area under the concentration–time curve (AUC) and inversely correlated with the MIC (Fig. 1). In other words, the effect is dependent on the fAUC/MIC ratio. For other antimicrobial agents this relationship is different. For instance, for β-lactam agents it is not the fAUC/MIC relationship that best correlates with outcome but the time, expressed as a percentage of the dosing interval, that the concentration of the antimicrobial agent remains above the MIC for the microorganism, in short the %fT > MIC. These factors correlating with efficacy are called PK/PD indices, because they incorporate pharmacokinetic (drug concentration over time) and pharmacodynamic (drug effect over time) factors [6].The underlying mechanisms that explain these relationships have been explored by several investigators, and are primarily dependent on the relationship between growth rate and the dependency of the kill rate on antimicrobial concentrations [7,8].
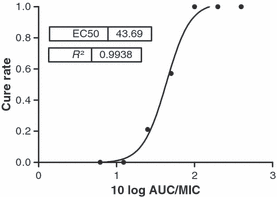
Cure rate after treatment with fluconazole in patients (n = 132) with oropharyngeal candidiasis. From these patients, the MIC distribution of the Candida albicans strains causing the infection was determined. Patients received different doses of fluconazole and the area under the curve (AUC) was estimated in each patient. There were seven different fAUC/MIC ratio values, resulting in seven groups. The proportion of patients cured in each group was plotted against the AUC/MIC ratio and the relationship was determined using the Emax model. The figure clearly shows the proportionality between fAUC and cure rate, whereas the MIC is inversely proportional to the cure rate [13].
The relationship between a PK/PD index and response to treatment allows for the definition of a pharmacodynamic target (PDT). The PDT is the minimum value of the PK/PD index that is aimed for when treating patients and is based on preclinical and clinical drug/microorganism exposure–response relationships. The PDT ideally is the PK/PD index value that ensures a high probability of successful treatment. There are two methods that are often used to identify the PDT. The first method is a specific analysis of the exposure–response relationship called Classification and Regression Tree analysis and is most often used to analyse exposure–response relationships in clinical trials [9–17]. This non-parametric method involves an algorithm of iterative splitting (recursive partitioning) and searches for the PK/PD index value that best discriminates between outcome categories, for instance failures and successes as outcome in clinical trials. The significance of classification can be tested using various statistical analyses such as the Fisher test and validated using logistic regression analysis. Outcome is usually binomial (success or failure of treatment), so a significant difference between classes indicates that the PK/PD index that defines the classes distinguishes between the class with a high probability of cure and the class with a low probability of cure. For example, in a study by Ambrose et al. [9], an fAUC/MIC ratio of about 34 was found to distinguish between patients that responded well or poorly to fluoroquinolone treatment for pneumococcal infection.
The second method commonly used to identify the PDT examines the full exposure–response relationship and from this identifies a PDT. If used in clinical trial analysis and a significant relationship exists, this is often the exposure that results in at least 90% cure or the maximum effect. However, both methods suffer from the fact that in many clinical trials there are not enough failures to perform such analyses, particularly for new agents. In clinical trials the dosing regimens chosen are based on obtaining a high drug exposure and MICs are usually low, so few patients will have low exposures and infecting microorganisms with high MICs. The PDT is therefore most often derived from preclinical studies, such as studies in animal models [18,19], but in vitro hollow fibre infection models [20–22] are increasingly used. Most animal models involve mice that are rendered neutropenic and infected with an inoculum of 106 CFU/mL of microorganisms in the thigh or lung. Treatment is then initiated and after 24 or 48 h the total bacterial count is determined for each organ. Using different doses and dosing intervals, ranges of exposure are obtained and are subsequently plotted against the number of CFU to establish exposure–response relationships. In a hollow fibre infection model, bacteria are exposed to simulated concentration–time profiles in an in vitro system. The advantages over animal models include examination of the effects of different half-lives and studies at higher inocula [23]. The latter in particular is used to study the emergence of resistance. The relationship between exposure and response (CFU) can generally be described by a sigmoid curve such as the Emax model with variable slope (Fig. 2). There are several conclusions that can be derived from this relationship. It is obvious that increasing values of the PK/PD index result in an increased effect, and that there is a value where a near maximum effect is achieved. The three key PK/PD index values that can be derived from this relationship are the PK/PD index value that results in a net static effect (no log10 drop in CFU) over 24 h of treatment (also called the in vivo static effect) and the values that results in a 1 log10 drop or a 2 log10 drop in CFU. Intuitively, the PK/PD index resulting in an in vivo static effect is the minimum value required when treating patients with an intact immune system, whereas a higher value may be required in patients that are immune deficient. Ambrose et al. [4] showed that PK/PD index values derived from studies in animals and those obtained by Classification and Regression Tree analysis were very similar; hence, PDTs can be derived from preclinical studies as well as clinical studies. Although PDTs derived from preclinical studies and clinical studies may differ for various reasons, the differences are generally not large, and both are taken into account by EUCAST when setting PK/PD breakpoints. This applies to other PK/PD relationships as well. For instance, for both quinolones and aminoglycosides the fAUC/MIC has been shown to be the index best correlated with efficacy, but the peak concentration (Cmax)/MIC ratio is also considered to be of importance and is taken into account. However, as most of these drugs are dosed once daily and are dosed according to a fixed regimen, there is a strong co-linearity between the various PK/PD indices and so there are comparable correlations with efficacy.
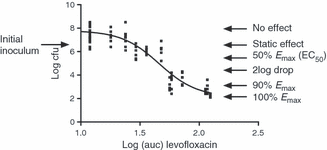
Characteristic effect levels of a sigmoid dose–response relationship (example for levofloxacin). The plot shows the relationship between area under the curve for free agent (fAUC) and number of CFU after 24 h of treatment. The static effect line indicates the fAUC required to result in no net change in CFU after 24 h of treatment. The 2 log10 drop indicates the fAUC required for a 100-fold reduction in CFU.
Deriving Breakpoints from the Pharmacodynamic Target—the Exposure–MIC–response Relationship
To attain a particular PDT in each patient, and thereby achieve a high probability of microbiological and clinical cure, two conditions need to be met. The first is that the exposure of the microorganism to the antimicrobial agent is adequate in each patient. In clinical practice, however, the exposure is fixed within certain boundaries, because the doses that are prescribed to patients are standardized, and are part of the summary of the product characteristics or the hospital formulary. However, the exposure does vary among patients because of inter-individual variability of pharmacokinetic parameters such as clearance and volume of distribution, and these factors should be taken into account when striving to predict outcome of treatment based on the PDT. The second condition is that the MIC is low enough to attain a PK/PD index value above the PDT—the value of the PK/PD index depending on exposure as well as MIC. Microorganisms with MICs that result in PK/PD index values that are lower than the PDT should be considered resistant (low probability of cure) whereas those with MICs that result in PK/PD index values that are higher than the PDT should be considered susceptible (high probability of cure), and the clinical MIC breakpoint is then based on the PK/PD index value that differentiates between the two groups. It is evident that the value of the breakpoint is directly dependent on the expected exposure of the microorganism to the antimicrobial agent in the patient to be treated.
As alluded to above, the expected exposure is dependent on dose, pharmacokinetic properties and pharmacokinetic variability in the population of patients to be treated, and when setting clinical breakpoints each of these should be taken into consideration. The first step therefore is to verify the dose and dosing regimen that is (or will be) most commonly used in the treatment of patients for a certain indication. This is particularly important for older drugs, where significant differences may exist. For instance, for penicillin, the most extreme example, the dosing regimens used vary between 600 mg three times daily to 3 g six times daily [24]. The pharmacokinetic properties of the agent, such as the volume of distribution and rate of clearance, will then provide values for PK parameters such as fAUC, and PK/PD indices are derived by including the MIC. The pharmacokinetic parameter is a property of the antimicrobial agent and the patient, whereas the PK/PD index is also dependent on the MIC.
The simplest method to determine the MIC breakpoint correlated with a particular exposure or PDT, is to take the PDT and use the simulated pharmacokinetic curve (based on pharmacokinetic properties and standard equations) for the agent directly to calculate the MIC breakpoint value. For instance, in the previously mentioned study by Ambrose et al. [9], the PDT derived from Classification and Regression Tree analysis was an fAUC/MIC ratio of 34. The fAUC for a 500-mg dose of levofloxacin is around 40 mg/h/L [25]. Hence, 40 (fAUC)/MIC (breakpoint) = 34 (PDT) and, rearranging the formula, MIC breakpoint = 40/34 = 1 mg/L to the nearest two-fold MIC value. Similarly, for antimicrobial agents where efficacy is primarily correlated with the %fT > MIC, such as β-lactams, the MIC breakpoint can be derived directly from a PDT such as 40% (static PDT) to 60% (1–2 log drop PDT) fT > MIC. Whereas this method is straightforward, the disadvantage is that it does not clearly show the impact of variation in or specific choice of the PDT on the MIC breakpoint. This can be achieved by tabulating or plotting the PK/PD index as a function of MIC for the dosing regimen of interest. For example, in Fig. 3 the fT > MIC for ceftazidime is shown as a function of MIC for two different dosing regimens, 1 g three times per day and 500 mg three times per day [10,26]. By drawing a horizontal line at the PDT on the y-axis, the MIC breakpoint can be read from the intersection with the plot. This approach allows direct evaluation of the effect of various PDTs on the MIC breakpoint. It also facilitates comparison of the effectiveness of different dosing regimens in attaining PDTs [27].
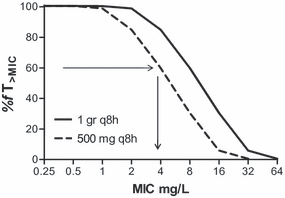
Relationship between fT > MIC and MIC of ceftazidime for two different dosing regimens of ceftazidime. This illustrates that the clinical breakpoint is dependent on the dosing regimen. Assuming that 60%fT > MIC is the pharmacodynamic target (PDT), the breakpoint for the dosing regimen of 500 mg three times per day is 4 mg/L, whereas for the dosing regimen of 1000 mg three times per day the breakpoint is 8 mg/L. Arrows indicate the PDT and the corresponding breakpoint for the 500-mg dose. Alternatively, a PDT of 40%fT > MIC would result in breakpoints of 8 and 16 mg/L, respectively.
Probability of Target Attainment and Monte Carlo Simulations
The probable expected exposure in a particular patient is, however, not only dependent on dose and pharmacokinetic parameters, but also on the pharmacokinetic characteristics, which may vary from patient to patient. When a specific PK/PD index value is used as a PDT to predict the probability of successful treatment, this should be true not only for the population mean, but also for each individual patient within the population. As the pharmacokinetic behaviour differs for each individual, the PK part of the PI also differs. Hence, when designing the dosing regimen that should result in a certain PDT this inter-individual variation should be considered. As real data defining the variability among individual patients are rarely available, a statistical approach is taken to simulate the variation. The statistical method most often used is Monte Carlo Simulations (MCS). This method was first used by Drusano et al. [28,29] to present an integrated approach to population pharmacokinetics and microbiological susceptibility information at the Food and Drug Administration Anti-infectives Product Advisory Committee. This method quickly became a standard approach in the process of setting breakpoints and has been used by EUCAST since 2002. There are several approaches to perform MCS [30]. The most common method involves repeatedly drawing random parameter values for each of the pharmacokinetic parameters, such as volume of distribution and clearance, based on its population mean and the standard deviation (SD), and construct simulated curves from those values following standard pharmacokinetic equations. Hence, the variability of pharmacokinetic parameters is used to simulate multiple concentration–time curves. A typical simulation involves 5000–10 000 cycles. As a control and a check that the random drawing of parameter values represents the original parameter estimate and its SD, the mean and SD of the simulations are compared with the original values and should be similar. The same applies to the generated curves, which can be compared with the original findings [31]. For each of the generated pharmacokinetic curves, which are all slightly different because the input parameters vary to a degree in relation to the variance of the parameters, the value of the PK/PD index is determined for a range of MICs. Two different methods are used to display the results of MCS. The first approach is to plot or tabulate the probability of target attainment (PTA) of a PDT as a function of the MIC for a particular target, or different targets. For example, Table 1 displays the PTA for various PDTs for a 1-g dose of ceftazidime three times daily [10]. The MIC breakpoint follows from the PDT that is considered necessary and the MIC range that needs to be covered. For instance, 100% PTA is attained at an MIC of 4 mg/L using a PDT of 50%f%T > MIC. Fig. 4 shows results for linezolid, as a plot rather than a table [32]. Typically, the MIC distribution of the target microorganisms is displayed in the same figure. By viewing the PTA as well as the MIC distribution the relationship between them is easily perceived. In this case, the PTA supports a susceptible PK/PD (non-species related) breakpoint of 2 mg/L and this is also the MIC at the high end of the wild-type MIC distribution.
| MIC (mg/L) | %fT > MIC | |||
|---|---|---|---|---|
| 30 | 40 | 50 | 60 | |
| 0.5 | 100 | 100 | 100 | 100 |
| 1 | 100 | 100 | 100 | 100 |
| 2 | 100 | 100 | 100 | 100 |
| 4 | 100 | 100 | 100 | 100 |
| 8 | 100 | 99 | 84 | 42 |
| 16 | 54 | 10 | 1 | 0 |
| 32 | 0 | 0 | 0 | 0 |
- From ref. [10]
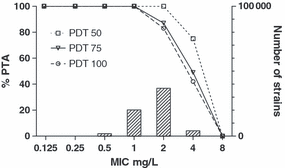
Probability of Target Attainment (PTA) of linezolid for three pharmacodynamic targets (PDTs) 50, 75 and 100, for a range of MICs. At an MIC of 1 mg/L nearly 100% of the target population is expected to reach the PDT, whereas at an MIC of 4 mg/L this percentage is lower. The wild-type MIC distribution for Staphylococcus aureus indicated by the bars shows that the full distribution is covered by the PK/PD breakpoint.
As can be observed from Fig. 4, the PTA is close to 100% at low MICs, and then decreases rapidly to 0 at high MICs. The slope of the line follows from the distribution of curves generated by the simulations, and becomes steeper if the variation in pharmacokinetic parameters is reduced. With a large variation, the PTA starts to decrease at lower MICs but decreases more slowly and will approach zero at higher MICs. The acceptable level of PTA is still under debate. Values of 99%, 95% or 90% have all been used. However, whereas 90% is often used it means that 10% of the population infected with a microorganism that has the MIC used to determine the PD index would probably not be covered optimally, that is, the PDT would not be attained. It should be noted that it is only the PTA at the MIC breakpoint value that is considered and not the PTA at lower MICs. The PTA at lower MICs will be close to 100%, and the accumulative PTA for the MIC distribution is much higher than for the breakpoint MIC value alone. In addition, because of the position and slope of the line, it could easily be that, for instance, 100% PTA is attained at 1 mg/L, 89% is attained at 2 mg/L and 70% at 4 mg/L. A breakpoint of 2 mg/L would in that case be more justified. In addition, if the PDT was slightly different—the PDT is an estimate in itself—the PTA would be 90% and no discussion would ensue. It is, however, not easy to determine the effects of these considerations together from this type of graph. In some cases therefore, a small range of breakpoint values should be considered, rather than a single value.
An alternative approach that has also been used is to present the results of MCS graphically, and was first presented at the CLSI meeting in Tampa in 2004 [33] to demonstrate the EUCAST approach. It has the advantage that it shows the total probability function irrespective of the target and therefore provides a more complete picture of the data [10]. An example is shown in Fig. 5. The fT > MIC for ceftazidime is displayed as a function of the MIC for a 1-g dose. The middle line represents the values for the mean of the population, and is similar to Fig. 3. The lines on both sides represent the confidence interval (CI) estimations (percentiles) of the mean values. The MICs that can supposedly be covered with the dosing regimen can be read directly from the figure at the intersection of the horizontal line at the PDT and the lower CI. If a CI of 80% were chosen, this would correspond with the 90% PTA of the method described above (the upper confidence limit not being important here). This method of display has the advantage that the effect of choosing a different PDT can be observed directly and weighted against all the other evidence for setting a breakpoint. Over the years, EUCAST has included both the 95% and 99% CI in the plots (in the plots indicated as percentiles), corresponding to 97.5 and 99.5 PTA, and has used the MIC values that resulted from these PTAs as the initial value for setting a PK/PD breakpoint. The value that ensues usually falls between two two-fold MIC values. The precision of the PDT estimate, the width of the confidence interval, the closeness to the lower or higher MIC, evidence from PK/PD studies, the indication for use of the drug and the MIC distribution itself are then taken into consideration before agreeing on the PK/PD breakpoint. In general, the PK/PD breakpoint based on MCS is one dilution lower than one that would be generated from the mean of the population. With agents for which the AUC/MIC is the PDT, a coefficient of variation (CV) of the AUC of 30% is common and the 90% CI then corresponds to slightly < 2 CVs, i.e. close to 50% or a one-fold to two-fold MIC dilution.
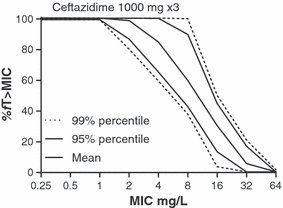
The fT > MIC of ceftazidime displayed as a function of the MIC for a 1-g dose. The middle line represents the values for the mean of the population (cf Fig. 3) whereas the lines on both sides represent the confidence interval estimations (percentiles) of the mean values obtained by Monte Carlo Simulation. MICs that can supposedly be covered with the dosing regimen can be read directly from the figure at the intersection of the horizontal line at the pharmacodynamic target and the lower confidence interval [10,26].
Important Considerations
The most important consideration is that while MCS and PTA are important, they are just two of several tools used in breakpoint setting. Other relevant information, such as outcome of clinical trials, use of the drug under specific circumstances and clinical experience are also taken into account by EUCAST and may differ between species. In addition, data are accumulating that emergence of resistance is also linked to specific PK/PD indices and values thereof [34–36]. Data on emergence of resistance are also increasingly incorporated in the discussions, but this is not yet systematically applied because of a lack of data.
One important principle in setting breakpoints is that clinical breakpoints should, if possible, not divide wild-type MIC distributions [1,2]. Hence, if PK/PD breakpoints are derived that do divide the wild-type population, alternatives are sought. In some cases this has led to an increase in the breakpoint with notes that a higher dose should be used (e.g. the levofloxacin breakpoint for Streptococcus pneumoniae) and in other cases it is lowered to render all bacteria intermediate or fully resistant (e.g. the ciprofloxacin breakpoint for S. pneumoniae) (Fig. 6) and the aztreonam breakpoint for Pseudomonas aeruginosa. As a consequence of the principle of not dividing the WT MIC distribution, a species-specific breakpoint could be higher than the non-species (PK/PD) breakpoint and this is usually resolved by specific dose recommendations. The identification of patient groups where the agent will be most used and that are most critical is also an important consideration. For example, patients in intensive-care units generally have different pharmacokinetics with a higher volume of distribution and lower clearance than most other patients. The use of different pharmacokinetic parameters in the simulations will obviously result in different conclusions with respect to the breakpoints, as was shown in case studies for ceftazidime [10] and for other agents [37]. MCS was performed using pharmacokinetic parameters from three different populations, human volunteers, patients with cystic fibrosis and patients from the intensive-care unit. In each population the derived breakpoints were different. EUCAST takes such differences into consideration when setting breakpoints, based on the indication of the drug and its likely use. The clinician should, however, also be aware of the indications for the drug and the doses used to set breakpoints. For instance, in patients with cystic fibrosis, use of a standard dose of ceftazidime when P. aeruginosa is reported as susceptible is not adequate as many of these patients have a higher rate of clearance and higher doses need to be administered to give an adequate exposure. In specific populations, measurements of drug concentrations in the individual patient and measurements of MICs for infecting organisms may be worthwhile to fine-tune dosing. This would result in guidance for therapy on an individual basis rather than using a specific clinical breakpoint. Finally, it should be realized that the conclusions based on MCS are primarily based on the PDT. A higher PDT implies a lower breakpoint, and it is therefore important to weigh the evidence for the PDT. The method that EUCAST commonly uses—interpreting PK/PD index versus MIC plots with confidence intervals—provides the means to do so. Weighting the PDT applies in particular to new antimicrobial classes and some old antimicrobial classes. For many existing classes the PDT will, in general, be known. Unless there is clear evidence that the PDT for a drug differs from others within the same class, the PDT will be in the same range and comparable with others in the class. It should be emphasized, however, that the PDT is not set in stone and in some cases could be disputed, in particular when pharmacodynamic data are scarce. In general, when data are scarce, EUCAST will take the cautious approach and either not provide a breakpoint or set a relatively conservative breakpoint.
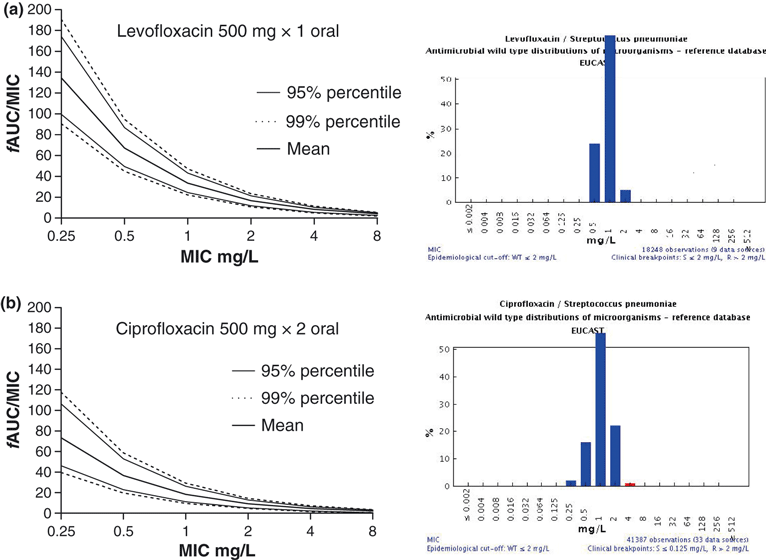
Probability of Target Attainment (PTA) for levofloxacin (500 mg once per day) (a, left upper panel) and ciprofloxacin (500 mg twice per day) (b, left lower panel), respectively. For levofloxacin, the derived breakpoint is 1 mg/L, based on a pharmacodynamic target of 34. However, the MIC distribution of the wild-type includes microorganisms with an MIC of 2 mg/L (right upper panel). As the wild-type needs to be fully covered, the susceptible breakpoint was set at 2 mg/L provided a higher dose was used. For ciprofloxacin, the derived pharmacokinetic/pharmacodynamic (PK/PD) breakpoints were at the lower end of the MIC distribution (right lower panel). The susceptible breakpoint was therefore set at the lower end of the distribution. Another conclusion could be that the PTA of ciprofloxacin is too low to justify its use for pneumococcal infections.
For susceptibility reports, it should be noted that the final decision on reporting susceptibility is not based on a specific breakpoint alone. Expert rules may modify the interpretation in specific situations and convert a susceptible or intermediate category to a more resistant one [38]. This normally implies that there are additional clinical or microbiological data supporting such modifications.
In summary, EUCAST has developed tools to use PK/PD and MCS to set breakpoints by considering the relationship between PK/PD index and MIC that includes the variability in both exposure and MIC. The representation of the results of MCS in graphical or tabular plots of PK/PD index versus MIC allows an interpretation of this relationship that is otherwise not readily possible. The breakpoints that are set are primarily based on the pharmacodynamic targets that are available, the variability (and hence the probability) of target attainment in the population and the indications and likely use of the antimicrobial agent. Fig. 7 summarizes this procedure. Finally, EUCAST reconsiders PK/PD breakpoints when indications change significantly and/or when dosing regimens change significantly.
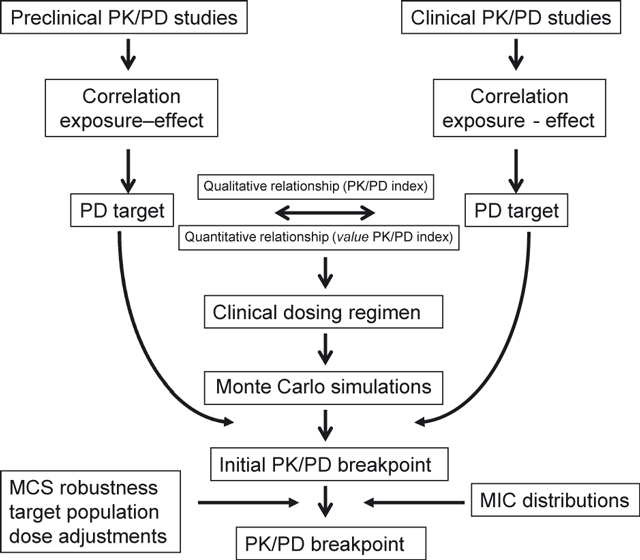
Summary of the process of setting pharmacokinetic/pharmacodynamic (PK/PD) breakpoints by EUCAST.
Acknowledgement
EUCAST is supported by a grant from the European Centre for Disease Prevention and Control and by European Society of Clinical Microbiology and Infectious Diseases.
Transparency Declaration
Nothing to declare.


