Recovery of axonal myelination sheath and axonal caliber in the mouse corpus callosum following damage induced by N,N-diethyldithiocarbamate
Abstract
Disulfiram is an aldehyde dehydrogenase inhibitor used for the treatment of alcohol dependence and of cocaine addiction. It has been demonstrated that subchronic administration of disulfiram or N,N-diethyldithiocarbamate (DEDTC), the main derivative of disulfiram, to rats can produce central–peripheral distal axonopathy. However, few data regarding the axonal effects of these compounds in the central nervous system exist. Our previous studies have revealed DEDTC-induced axonal damage in the mouse brain during the course of postnatal development, together with alterations in axonal pathfinding and in the myelination process, with partial recovery during the post-treatment period. In order to gather new data about how this axonal damage and recovery occurs in the central nervous system, we performed an ultrastructural analysis of the axons located in the corpus callosum from mice treated with DEDTC during postnatal development. The axonal caliber throughout the axonal area, the maximum axonal diameter, the maximum fiber diameter, and the axonal circularity, at different postnatal stages [from postnatal day (P)9 to P30], were analyzed. In addition, parameters related to the myelinization process (number of myelinated axons, sheath thickness, and the ratio of myelinated axons to total axons) were evaluated. A reduction in the average value of axonal caliber during treatment and a delay in the axonal myelination process were detected. Whereas early recovery of individual axons occurred after treatment (P22), complete recovery of myelinated axons occurred at late postnatal stages (P42). Therefore, chronic treatment with dithiocarbamates requires periods of rest to encourage the recovery of myelinated axons.
Introduction
Disulfiram (tetraethylthiuram disulfide) is a dithiocarbamoyl drug that has been widely used since the late 1940s to promote alcoholic abstinence. It is thought that treatment produces inhibition of the aldehyde dehydrogenase by N,N-diethyldithiocarbamate (DEDTC), the main derivate of disulfiram. Thus, acetaldehyde accumulates in the blood and provokes the unpleasant effects associated with acetaldehyde syndromes (Rainey, 1977). Recently, disulfiram was also shown to be promising in the treatment of cocaine addiction (Sofuoglu & Sewell, 2009).
Disulfiram treatment is associated with induction of peripheral neuropathy that is characterized by distal sensory impairment with loss of coordination, painful paresthesias, and distal weakness with foot drop and/or pain in the hands (Frisoni & Di Monda, 1989; Chick, 1999; Filosto et al., 2008). At the experimental level, it has been widely reported that subchronic administration of either disulfiram or DEDTC to rats can produce central–peripheral distal axonopathy, characterized by the formation of axonal swellings, and degeneration and atrophy in the posterior columns of the spinal cord and the peripheral nerves (Bergouignan et al., 1988; Sills et al., 1998; Klein & Dyck, 2005). Studies by Tonkin et al. (2003) demonstrated that this peripheral neurotoxicity induced by DEDTC in rats was characterized by segmental demyelination, splitting of myelin lamellae, and formation of fluid and debris-filled vacuoles in Schwann cells, which are related to myelination in the peripheral nervous system (PNS), providing evidence that this compound acts directly on the myelin sheath. At the level of the PNS, it has been widely reported that dithiocarbamates induce axonal alterations, but few data are available regarding the axonal effects of these compounds in the central nervous system (CNS). Our previous results, obtained with an improved in vivo experimental model based on daily injections of DEDTC during the course of postnatal development, revealed alterations in axonal pathfinding, involvement in the myelination process, and induction of axonal damage, which recovered during the post-treatment period (Junyent et al., 2006; Utrera et al., 2010), in accordance with the data obtained by Bergouignan et al. (1988). Axonal injury contemporaneous with myelin damage has been detected in different diseases related to immune and neurodegenerative disorders, such as globoid (Krabbe) and leukodystrophy diseases (Scherer & Wrabetz, 2008; Galbiati et al., 2009). Moreover, the capability for remyelination observed in our experimental model may be closely related to the remyelination that occurs in the CNS after initial myelin damage, a process that has been shown to fail following multiple episodes of demyelination (Franklin & Ffrench-Constant, 2008; Franklin & Kotter, 2008; Bauer & Ffrench-Constant, 2009). Therefore, the DEDTC experimental model presented could be useful for analyzing the relationship between axonal and myelination alterations, and how recovery from these injuries begins. Focusing on these issues, we carried out a transmission electron microscopy analysis of the axons located in the corpus callosum in mice treated from postnatal day (P)2 to P15 with DEDTC, as described by Junyent et al. (2006). Axonal and myelin parameters were evaluated at different postnatal stages – the second week of postnatal development, adulthood, and advanced stages (P9, P15, P22, P26, P30, P42, P56, and P85). The data obtained revealed that DEDTC treatment induced a reduction in axonal caliber and a delay in the axonal myelination process. Of interest was the partial recovery detected after treatment.
Materials and methods
Animals and DEDTC treatment
Forty-eight NMRI postnatal mice were used in this study (Iffa Credo, Lyin, France). Animals were kept under controlled temperature, humidity and light conditions, and were treated according to the European Community Council Directive 86/609EEC. The procedure was registered at the Department d’Agricultura, Ramaderia i Pesca of the Generalitat de Catalunya, in compliance with decree 214/1997. One group of animals was injected daily intraperitoneally with DEDTC (575 mg/kg; Panreac, Barcelona, Spain) from P2 to P15, as previously described by Junyent et al. (2006). A control group was injected with saline solution (0.9% NaCl; Panreac). In order to allow the treated animals to recover, DEDTC injections were discontinued after P15. The ultrastructural study was carried out during the second postnatal week of development (P9 and P15), during the early adulthood period (P22, P26, and P30), and at advanced adult stages (P42, P56, and P85). At each stage, three treated mice and three controls were anesthetized by intraperitoneal injection of ketamine (100 mg/kg) and xylazine (10 mg/kg), and then perfused with 4% paraformaldehyde in 0.1 m phosphate buffer.
Electron microscopy
Following perfusion, the brains were removed and post-fixed in a solution containing 2% paraformaldehyde, 2% glutaraldehyde and 0.5% CaCl2 in 0.12 m phosphate buffer (pH 7.3) for 24 h at 4 °C. Vibratome sections of 80 μm were obtained, and post-fixed with 2% osmium tetroxide for 1 h at 4 °C. The sections were dehydrated with acetone and progressively flat-embedded in an epoxy resin (Epon). Thick sections (1.0 μm) obtained by ultramicrotomy (Ultracut E; Leica Microsystems, Wetzlar, Germany) were stained with 0.5% methylene blue for 10 s, and then observed under a microscope for precise callosal location and for the cutting of ultrathin sections.
The ultrathin sections (50 nm) were obtained with an ultramicrotome (Ultracut Leica; Leica Microsystems), collected on formvar-coated slot grids, stained with 2% uranyl acetate for 30 min and lead citrate for 5 min, and observed under a transmission electron microscope [TEM JEOL 1010 (JEOL, Tokyo, Japan) at 80 kV] (Serveis Cientifco-Tècnics, Universitat de Barcelona, Barcelona, Spain).
Image analysis
For each stage and experimental condition studied, several electronic images were obtained and analyzed with imagej, a powerful imaging program developed and maintained by the National Institutes of Health (USA). For the quantification of myelinated and non-myelinated axons, images of 75 fields randomly observed in eight slices were captured at ×6000 magnification for each case. The data were converted to axonal number/100 μm2. For axonal morphometric measurements (axonal diameter, maximum axonal diameter, maximum diameter of the fiber, axonal area, axonal circularity, G-ratio, and myelin thickness), images were captured at ×50 000 magnification, and 100 axons were then measured. Maximum axonal diameter and axonal area are parameters related to the value of axonal caliber. The axonal circularity was calculated as the ratio of axonal area to the area of a circle with the same circumference as the axon (Arbuthnott et al., 1980). The G-ratio was measured as the ratio of inner axonal diameter to the total outer diameter, this being a highly reliable ratio for assessing axonal myelination (Chomiak & Hu, 2009). The maximum diameter of the fiber and the myelin sheath is indicative of the myelin thickness, and is an equivalent value to direct measurement of the myelin sheath.
Statistical analysis
All of the data are expressed as the mean ± standard error of the mean from three different samples (n = 3) at each stage and for each experimental condition – control and DEDTC-treated mice. Statistical analysis was performed with graphpad. The statistical differences between one stage and the preceding one, and in different experimental conditions, were analyzed with one-way anova and pairwise comparison by the use of Tukey’s multiple comparison test.
Results
At P9, few myelinated axons were detected in control and treated mice (Fig. 1). Few differences were found regarding ultrastructure and axonal disposal, apart from the presence of axons with a greater diameter in the non-treated mice than in the treated mice (Fig. 2A and B). At high magnification, it was seen that, in untreated mice, the myelin sheath surrounded the axon in a clear-cut manner; however, an altered, uniformly thick sheath was observed in the treated mice (Fig. 2C and D). The statistical analyses of myelinated axons (F9,20 = 304.4, P = 0.0000) (Fig. 1) revealed that, in control mice at P15, the number of myelinated axons was significantly increased with respect to P9, an increase that did not occur in treated mice (Fig. 1) and (Fig. 3A and B vs. Fig. 2A and B). As can be seen in Fig. 3B vs. Fig. 3A, the axonal myelin sheath was still thinner in treated mice than in controls. By P22, the increase in the number of myelinated axons, in comparison with the preceding days, was appreciable in both conditions, although in controls there was markedly greater enlargement than in DEDTC-treated mice (Fig. 1; Fig. 3C and D vs. Fig. 3A and B). At P30, although recovery was detected in DEDTC-treated mice, it was not complete (Fig. 1; Fig. 3F vs. Fig. 3E).

Numbers of myelinated axons in the corpus callosum at the different postnatal stages. The average values obtained in both conditions, at P9, P15, P22, P26, and P30, are lower in treated mice than in controls, not becoming the same until P30. ***P < 0.001. Statistical differences between one stage and the preceding stage were detected between all stages in controls and from P15 in DEDTC-treated mice. ###P < 0.001.
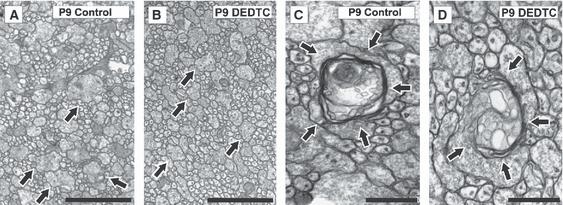
Ultrastructural coronal sections of the corpus callosum at P9. (A and B) The axonal diameter is greater in control than in treated mice (see arrows). (C and D) Myelin sheath observed at high magnification (arrows). Whereas a round axonal myelin sheath is observed in controls (C), in treated animals the round, thick sheath is not uniform (D). Scale bars A and B: 2 μm. Scale bars in C and D: 0.5 μm.
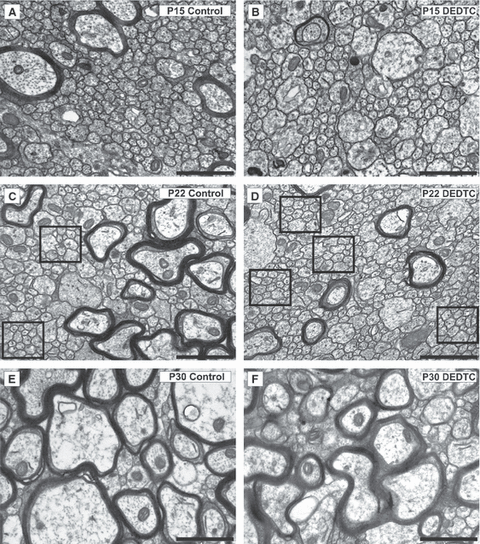
Ultrastructural coronal sections of the corpus callosum at different postnatal stages. (A–F) A progressive increase in the number of myelinated axons – those that are surrounded by darkly electrodense ring (myelin sheath) – is observed from P15 to P30, both in control (A, C, and E) and in DEDTC-treated (B, D, and F) mice. At all stages, the number of myelinated axons is lower in treated mice than in controls (B vs. A; D vs. C; F vs. E). The squares indicate spaces with unmyelinated axons, which progressively decrease as development proceeds. On comparison of control and treated mice, their number is higher in treated mice than controls, as clearly detected at P22 (D vs. C). Scale bar: 1 μm.
To determine whether the number of myelinated axons was restored at a later time, late postnatal stages were analyzed, such as P42, P56, and P85.The statistical analyses (F5,12 = 7.830, P = 0.0017) revealed that, at P42, the number of myelinated axons was almost identical for both conditions (Fig. 4A; Fig. 4B vs. Fig. 4C), and this was maintained at P56 and P85 (Fig. 4D–G).
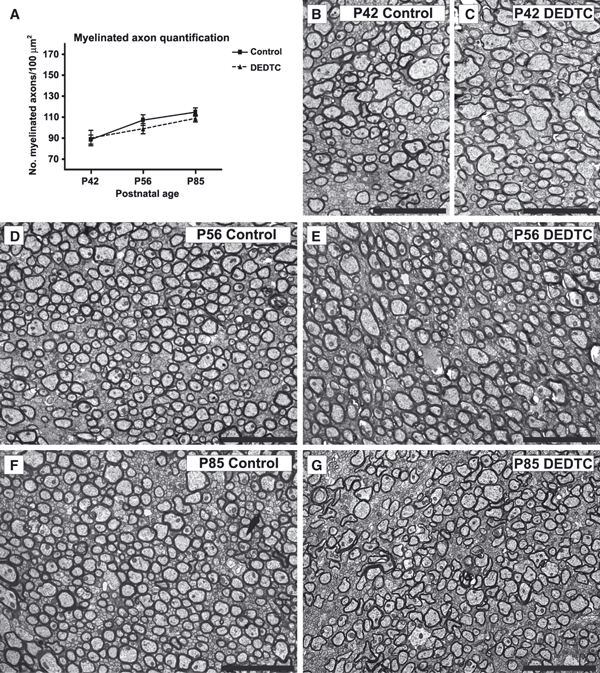
Numbers of myelinated axons in the corpus callosum at late postnatal stages. (A) The average values obtained at P42, P56, and P85. Values are mean ± standard error of the mean; n = 3 for each value. No statistically significant differences were detected between different stages or between control and treated mice. (B–G) Ultrastructural coronal sections of the corpus callosum at P42, P56, and P85, showing equal numbers of myelinated axonals in control and treated mice. Scale bar in B–G: 5 μm.
The total number of axons (myelinated and unmyelinated) at each stage was also evaluated. The statistical analyses (F9,20 = 17.57, P = 0,0000) revealed that the total number of axons was the same in control and treated mice at P9 and P15 (Fig. 5). By P22, in treated mice, the number of unmyelinated axons was still high, as on the preceding days (Fig. 5; Fig. 3D vs. Fig. 3B), in contrast to what occurred in controls, where the number of unmyelinated axons clearly decreased with respect to P15 (Fig. 5; Fig. 3C vs. Fig. 3A). Thus at this stage, the differences between the two conditions were significant; the total number of axons was lower in controls than in treated mice (Fig. 5). In addition, an increase in axonal myelin thickness was detected in treated mice (Fig. 3D vs. Fig. 3B). From P22 to P30, a reduction in the total number of axons was observed in both conditions, reaching the same value (Fig. 5), although the number of unmyelinated axons was higher in treated mice than in controls (Fig. 3F vs. Fig. 3E).
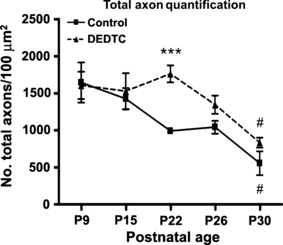
Numbers of total axons (myelinated and unmyelinated) in the corpus callosum at different postnatal stages. A decline can be seen in the total axonal number from P9 to P30, in both control and treated mice. #P < 0.05. Statistically significant differences between the two treatments are seen only at P22. ***P < 0.001. At P30, the values are equal in the two conditions.
The relationship between the number of myelinated axons and total axon number was also evaluated, revealing the degree of myelination throughout the different postnatal stages analyzed. Thus, whereas in control animals the average value increased from P15 to P30, in treated mice it remained the same until P26, increasing from this stage until P30. However, the value was lower than that observed in controls (data not shown). Therefore, whereas the number of total axons rose to an equal average value at P30, this did not occur with the myelinated axons.
The axonal caliber of myelinated axons was determined from the axonal area and the maximum axonal diameter. The statistical analyses for axonal area (F9,30 = 11.62, P = 0.0000) and for maximum axonal diameter (F9,30 = 11.97, P = 0.0000) revealed that axonal caliber was lower at P15 in treated mice than in controls (Fig. 6A and B). This can also be seen by comparing Fig. 6F with Fig. 6E. However, at P22 an increase was observed under both conditions, with equal average values (Fig. 6A and B) that were maintained until P30 (Fig. 6A and B; Fig. 6H vs. Fig. 6G).
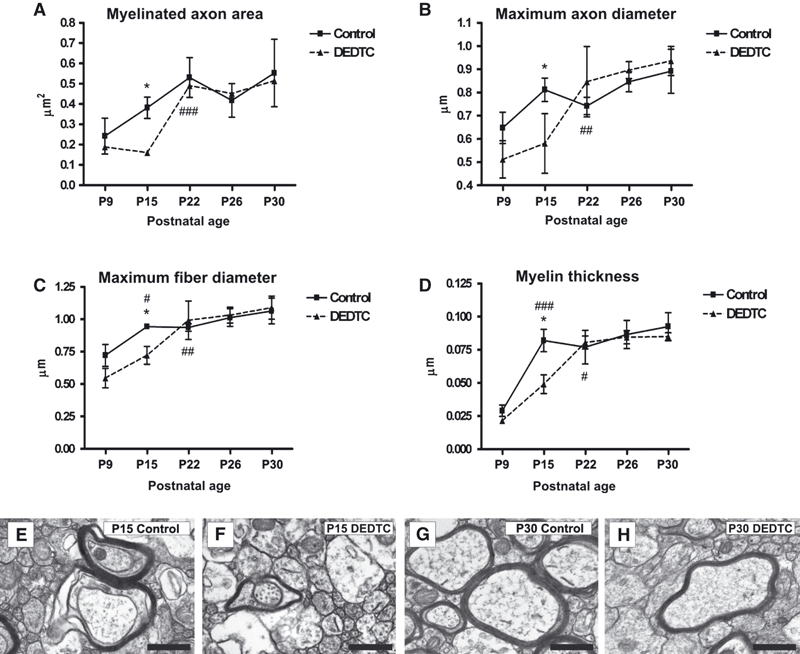
(A–D) Graphs showing the profiles of different axonal parameters at different postnatal stages. Axonal area (A), maximum axonal diameter (B), maximum fiber diameter (C) and myelin thickness (D) were evaluated in myelinated axons at P9, P15, P22, P26 and P30. The values for these parameters have the same profile throughout the postnatal days analyzed in both control and DEDTC-treated mice. The statistically significant differences between control and DEDTC-treated mice are always observed at P15. *P < 0.05. From P15 to P22, a statistically significant increase in DEDTC-treated mice is observed, with the values becoming equal to those detected in controls. ##P < 0.05; ###P < 0.01; ###P < 0.001. (E–H) Ultrastructural coronal sections of the corpus callosum at P15 and P30. The two myelinated axons in E (P15 control), surrounded by a dark electrodense ring, have a greater axonal area, axonal diameter, maximum fiber diameter and myelin thickness than the myelinated axon in F (P15 DEDTC-treated mice). As observed in G and H, the parameters for myelinated axons (surrounded by a darkly electrodense ring) are equal. Scale bar: 500 nm.
The myelin sheath was evaluated by measuring the maximum fiber diameter and the myelin thickness. The statistical analyses for the maximum fiber diameter (F9,30 = 19.48, P = 0.0000) and for the myelin thickness (F9,10 = 22.56, P = 0.0000) revealed that, whereas an increase in myelin sheath average values was observed from P9 to P15 in controls, in treated mice it was detected at later postnatal stages, from P15 to P22. At P22, the values were equal between controls and treated mice (Fig. 7C and D).
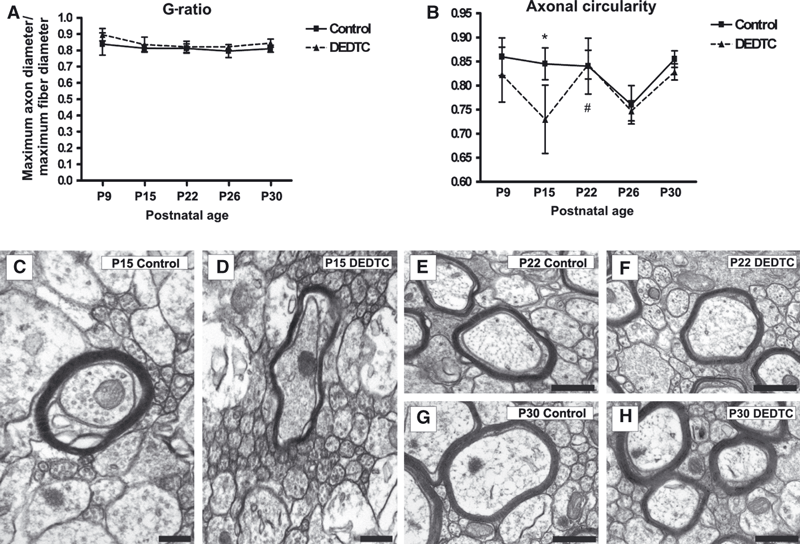
Axonal G-ratio and circularity analyzed in axons of the corpus callosum, at different postnatal stages. (A) The G-ratio is constant throughout postnatal stages and in both experimental conditions: control and treated mice. (B) Profile of axonal circularity at P9, P15, P22, P26, and P30. At P15, the average value in DEDTC-treated mice is statistically significant lower than in controls (*P < 0.05), becoming equal at P22, as the increase from P15 to P22 is statistically significant in treated animals. #P < 0.05. (C and D) Electronmicrographs of the corpus callosum at P15 reveal the differences in axonal circularity of myelinated axons (surrounded by a dark electrodense ring). (E–H) Electronmicrographs of the corpus callosum at P22 and P30 reveal a similarity in axonal circularity between control (E and G) and treated (F and H) mice. Scale bar in C and D: 200 nm. Scale bar in E, F, G, and H: 500 nm.
The relationship between the diameter of the axon and that of the myelinated fiber was evaluated with the G-ratio. The statistical analyses (F9,20 = 1.701, P = 0.1545) revealed that values remained constant throughout the postnatal stages and under both conditions (Fig. 7A).
The axonal circularity obtained from the relationship between axonal area and the area of the axonal circle was also evaluated at the different stages (Gold et al., 1991). The statistical analyses (F9,30 = 5.252, P = 0.0003) revealed that, again, the greatest differences occurred at P15 (Fig. 7C vs. Fig. 7D), with the values equalizing at P22 and remaining the same until P30 (Fig. 7B–H).
Discussion
Axonal damage induced after DEDTC treatment and early recovery
The ultrastructural analysis of how DEDTC affects axonal myelination was started at P9. It is known that murine myelination starts approximately 1 week after birth, and by the third postnatal week it is very active. The myelination process then slows down progressively, and is completed by postnatal week 4 (Foran & Peterson, 1992; Vincze et al., 2008). Moreover, as the myelin alterations caused by DEDTC treatment have been observed in the corpus callosum (Junyent et al., 2006), and a large number of axons travel through this body, the ultrastructural analysis was performed in this area. The results revealed that DEDTC treatment induced a delay in the axonal myelination process, as evaluated from the myelin thickness and the maximum diameter of the fiber, and in axonal growth, as evaluated from the axonal area and the maximum axonal diameter. These data are also supported by the axonal circularity values. In addition to these alterations, axonal damage was induced following DEDTC treatment, as has been shown in a previous study by immunohistochemistry for APP and NF-H (Junyent et al., 2006). Moreover, Tau hyperphosphorylation, which has also been detected by immunohistochemistry, supports the existence of this axonal damage (Utrera et al., 2010). The alterations in myelin thickness and axonal structure, which were clearly detected at P15, recovered at P22. Therefore, all of these data suggest that the alterations found in myelin thickness by transmission electron microscopy (MET) are due to a delay in the myelination process and axonal damage, rather than a non recoverable myelin and axonal injury. This capacity for axonal recovery following induction damage is in accordance with the data obtained by García et al. (2003), who determined that a reduction in axonal caliber and conduction velocity did not alter recovery after injury. Moreover, they detected from the beginning of recovery a correlation between axonal maturation and the myelination process. Thus, various results point to the myelin sheath being controlled by the degree of axonal caliber, and vice versa; in agreement with this are the results obtained by Bartsch et al. (1989) and Trapp et al. (1989), who showed that, during myelination, myelin-associated glycoprotein is redistributed to membrane domains juxtaposed to axonal regions, with a timing that is consistent with the initial wave of radial growth. Yin et al. (1998) also found that the absence of myelin-associated glycoprotein correlated with reduced axonal caliber, decreased neurofilament spacing, and reduced neurofilament phosphorylation. Moreover, Nave & Salzer (2006) showed how neuregulin-1 type III regulates Schwann cell membrane growth to adjust myelin sheath thickness to precisely match axon caliber. All of these data lend support to the idea that there is an equilibrium between the myelin sheath and the axonal area that aids in the thickening of the axon, thereby establishing a more stable myelin sheath to ensure correct neuronal conduction velocity, at least in the PNS. This relationship has also been suggested for the CNS, on the basis of work with the Shiverer mouse, which expresses the myelin basic protein gene with an autosomal recessive mutation that results in markedly reduced myelin basic protein levels. Thus, the incomplete myelin sheath formation leads to axonal conduction deficits, progressive tremor and ataxia, seizures, and a shortened lifespan (Rosenbluth, 1980; Shen et al., 1985; Seiwa et al., 2002; Martin et al., 2006). Therefore, the results obtained in the present work with electron microscopy are in accordance with all of these previous studies. However, how this signaling system operates in the CNS remains an open question of major importance for human demyelinating diseases.
That the thickness of the myelin sheath varies according to the diameter of the axon is also shown by the G-ratio (Sherman & Brophy, 2005). Furthermore, it is generally believed that the G-ratio of a myelinated axon is optimized to achieve maximal efficiency and physiological optimization. Rushton was the first to derive an optimal theoretical G-ratio of 0.6 (Rushton, 1951), and this was supported by Smith & Koles (1970) and Chomiak & Hu (2009). Furthermore, Rushton’s model was also later questioned with respect to the CNS, where axons tend to be smaller, with thinner sheaths (Waxman & Bennett, 1972), and a G-ratio significantly higher than 0.6 (Mason et al., 2001). This discrepancy can be explained by the fact that these values are largely concerned with a single parameter (minimizing conduction delays) rather than the idea of system optimization (Mitchison, 1992). The mean of G-ratio values (0.81) found in the present study throughout the different postnatal stages is in accordance with this discrepancy between values for the different neural systems, and it closely resembles the experimentally observed values for most central axons (Chomiak & Hu, 2009). It is a widely held view that the G-ratio is highly reliable for assessing axonal myelination. Therefore, the maintained G-ratio values throughout the different stages analyzed indicate that myelination recovery proceeded appropriately both in control and in treated mice.
Alterations in the number of myelinated axons after DEDTC treatment and late recovery
The data obtained with this in vivo model also demonstrate that the treatment altered the total number and progression of myelinated axons in the course of postnatal development. Thus, whereas in controls there was a progressive increase in the number of myelinated axons from P9 as development proceeded, in accordance with the data obtained by Vincze et al. (2008), in treated mice this increase occurred at later stages, at P15, and the average values for the number of myelinated axons were lower in treated mice than in controls at all stages analyzed, only becoming the same under both conditions at P42. Simultaneously with the increase in the number of myelinated axons, a decline in the total number of axons was observed in both conditions, with delay in treated mice. Thus, a significant difference was observed at P22. However, the values became equal at P30, in contrast to what occurred with the number of myelinated axons. These data lend support to the idea that DEDTC has a more lasting effect on the axonal myelination process than on axonal number stabilization. It is interesting to consider that, at P22, when the differences in total axonal number were greatest, the axonal caliber and myelin thickness of each axon attained the same average value.
Conclusion
The data obtained provide evidence that whereas the recovery of axonal caliber and myelin thickness of axons located in the corpus callosum occurs at an early stage after DEDTC treatment, the total number of myelinated axons does not clearly recover until late stages (P42), lending support to the ideas that the damaged organism has: (i) the capacity to repair the individual axonal and myelin parameters affected; and (ii) neuronal plasticity subsisting in the adult brain even at late stages.
The fact that the recovery of the total number of myelin axons occurs at a slow rate indicates that, despite the continuation of the myelination process into adulthood, the molecular environmental conditions induced by DEDTC influence the normal development of myelin axons. In addition, the data obtained suggest that the model presented here would be useful to analyze which factors and mechanisms are changed in treated animals with respect to controls, and also how they are modulated in the course of development to create appropriate molecular environmental conditions for the rescue of the myelination process following damage.
Moreover, the data obtained indicate that whereas DEDTC treatments could allow recuperation of axonal myelinated axons soon after treatment is stopped, together with the total number of axons, the number of myelinated axons would be restored only at a later time. Thus, it should be taken into consideration that chronic treatment with dithiocarbamates should be followed by extended periods of pause to allow recovery of axonal myelinated axons.
Acknowledgements
This study was supported by grants from the Spanish Ministerio de Educación y Ciencia (BF104-05015 and BFU2010-19119). We would like to thank the Generalitat de Catalunya for supporting the research groups (2009/SGR00853). We wish to thank Tom Yohannan for editorial assistance.
Abbreviations
-
- CNS
-
- central nervous system
-
- DEDTC
-
- N,N-diethyldithiocarbamate
-
- P
-
- postnatal day
-
- PNS
-
- peripheral nervous system


