Artificial feeding synchronizes behavioral, hormonal, metabolic and neural parameters in mother-deprived neonatal rabbit pups
Abstract
Nursing in the rabbit is under circadian control, and pups have a daily anticipatory behavioral arousal synchronized to this unique event, but it is not known which signal is the main entraining cue. In the present study, we hypothesized that food is the main entraining signal. Using mother-deprived pups, we tested the effects of artificial feeding on the synchronization of locomotor behavior, plasma glucose, corticosterone, c-Fos (FOS) and PERIOD1 (PER1) rhythms in suprachiasmatic, supraoptic, paraventricular and tuberomammillary nuclei. At postnatal day 1, an intragastric tube was placed by gastrostomy. The next day and for the rest of the experiment, pups were fed with a milk formula through the cannula at either 02:00 h or 10:00 h [feeding time = zeitgeber time (ZT)0]. At postnatal days 5–7, pups exhibited behavioral arousal, with a significant increase in locomotor behavior 60 min before feeding. Glucose levels increased after feeding, peaking at ZT4–ZT12 and then declining. Corticosterone levels were highest around the time of feeding, and then decreased to trough concentrations at ZT12–ZT16, increasing again in anticipation of the next feeding bout. In the brain, the suprachiasmatic nucleus had a rhythm of FOS and PER1 that was not significantly affected by the feeding schedule. Conversely, the supraoptic, paraventricular and tuberomammillary nuclei had rhythms of both FOS and PER1 induced by the time of scheduled feeding. We conclude that the nursing rabbit pup is a natural model of food entrainment, as food, in this case milk formula, is a strong synchronizing signal for behavioral, hormonal, metabolic and neural parameters.
Introduction
When food is restricted during certain hours of the day, subjects develop food anticipatory activity (FAA), a phenomenon that is commonly studied with experimental manipulations in adult rodents (Mistlberger, 1994). The most salient event during FAA is an increase in locomotor behavior before food presentation; in addition, there is an increase in hormone corticosterone (CORT) levels and several hormonal and metabolic variables (Díaz-Muñoz et al., 2000; Antle & Silver, 2009). In the brain, scheduled food restriction drives daily neuronal rhythms in hypothalamic and corticolimbic structures (Angeles-Castellanos et al., 2003; Verwey & Amir, 2009). It has been recognized that rabbit pups also show characteristics similar to FAA, but, in contrast to adult rats, without excessive manipulations, because they are naturally exposed during lactation to a restricted feeding schedule, as they are nursed and thus ingest food just once a day for few minutes, usually during the dark phase (Zarrow et al., 1965; Broekhuizen & Mulder, 1983; Jilge, 1993). Before the mother’s arrival, pups show a circadian increase in core body temperature and locomotor behavior at postnatal day (PD)7 (Jilge, 1993; Jilge et al., 2000), resembling the features observed in FAA in rodent species. In addition, pups show an increase in CORT levels before and during daily nursing (Rovirosa et al., 2005). Moreover, rhythms of liver glycogen, free fatty acid and plasma ghrelin concentrations are also synchronized by the timing of nursing (Morgado et al., 2008, 2010). Finally, as in rodents subjected to restricted feeding, the daily nursing event synchronizes neuronal activity in the hypothalamus as observed by detection of rhythms in c-Fos (FOS) and the clock protein PERIOD1 (PER1) (Caba et al., 2008).
On the basis of this evidence, we recently proposed that the rabbit pup is a natural model of nursing anticipatory activity (Caba & González-Mariscal, 2009). We used the word ‘nursing’ for this entrainment process because it was not clear which cue was the main synchronizing signal, as, during nursing, pups are exposed to several stimuli from the mother (Hudson & Distel, 1989). During this brief nursing opportunity, rabbit pups abruptly fill their stomachs, consuming up to 35% of their body weight in milk in < 5 min (Caba et al., 2003). In the present study, we explored the role of food as the main synchronizing signal by the artificial feeding of mother-deprived rabbit pups. To this end, we infused milk formula through an intragastric cannula either at 02:00 h or at 10:00 h, which were considered as zeitgeber time (ZT)0, from PD2 to PD7 in pups maintained in the dark. At PD7, locomotor behavior, glucose levels and CORT levels were determined every 4 h. In addition, we used immunohistochemistry for FOS and PER1 to examine oscillations in the suprachiasmatic nucleus (SCN), the master circadian clock, as well as in the supraoptic nucleus (SON), the paraventricular nucleus (PVN), and tuberomammillary nucleus (TMN), because of their involvement in FAA and food ingestion in rodents under a restriction feeding schedule (Angeles-Castellanos et al., 2003; Verwey & Amir, 2009) and in rabbit pups synchronized by nursing (Allingham et al., 1998; Caba et al., 2003, 2008; Caldelas et al., 2009).
Materials and methods
Animals and housing conditions
Subjects were newborn rabbits born from New Zealand white female rabbits bred in our colony in Xalapa, México; they were housed under controlled light conditions (12-h/12-h light/dark cycle, lights on at 07:00 h) and stable temperature conditions (23 ± 2 °C), and provided with rabbit chow (Purina) and water ad libitum. Pregnant females were individually housed and monitored daily from day 28 of pregnancy until delivery. In the last week of pregnancy, each doe was provided with about 100 g of straw for building of the nest; then, just before parturition, the doe covered the nest with fur from her belly to complete the construction of the maternal nest. On the day of parturition (PD0), litters were adjusted to six to eight pups, and they remained in the maternal nest, in constant darkness, until the time of surgery, without further contact with their mothers. Pups remained in constant darkness thereafter until they were killed at PD7.
Gastrostomy
On PD1, nine litters were assigned to one of two experimental groups – artificial feeding (AF) at 02:00 h (AF02:00) or at 10:00 h (AF10:00) – and, for each group, gastrostomy was performed at approximately those hours following a modification of the procedures described by Beierle et al. (2004). Pups were anesthetized with intramuscular ketamine (3 mg/100 g), and then given halothane by inhalation during surgery. The stomach was visualized through the skin; a small incision (∼0.5 cm) was made through the skin, and polyethylene tubing (PE-50), 15 cm long, was passed over into the stomach with a wire inside to help guide the cannula. A small V-shaped piece of plastic was glued in the external wall of the cannula close to the cannula tip to help maintain it inside the stomach. Finally, the wire was removed, the stomach and skin were sutured around the cannula, and a local antibiotic cream was applied to prevent infection. The free tip of the cannula was sealed tightly with a small piece of plastic. Pups were maintained under warm conditions in a box until recovery from anesthesia, and then returned to a styrofoam cage lined with material from their maternal nest. Finally, pups were placed inside the nest compartment of our maternal cages (Caba et al., 2008) and left undisturbed.
Milk formula infusion
The next day and for the following 6 days at 02:00 h or 10:00 h, pups were weighed and then fed through the cannula in the dark. The cannula was connected to a 23G needle attached to a syringe filled with milk formula with a capacity of 10 mL or 20 mL, as required. The syringe was mounted on a timer-controlled and speed-controlled Harvard infusion pump (Harvard Apparatus Syringe Pumps, PHD 2000). Milk administration lasted from 3 to 5 min, simulating the time that the mother takes to nurse the pups (Hudson & Distel, 1989; Jilge, 1995). Milk formula was prepared according to the method of Messer et al. (1969). The volume of milk formula was adjusted every day on the basis of data from our laboratory on the amount of milk ingested during first 7 days postpartum in the rabbit (Caba et al., 2003). Milk formula was infused through the cannula, the tube was cleaned with physiological solution, and the tip was sealed again.
All procedures were approved by the Ethics Committee of Universidad Veracruzana, and were performed according to the National Guide for the Production, Care and Use of laboratory animals (Norma Oficial Mexicana NOM-062-ZOO-1999).
Experimental groups
Forty-eight artificially reared rabbit pups were distributed in two groups: AF02:00 and AF10:00. These schedules were assigned according to protocols previously established in our laboratory for rabbit pups fed by their mother (Caba et al., 2008). At PD7, pups were killed just before their scheduled time of feeding (ZT0) and then at 4-h intervals (n = 4 per time point) at ZT4, ZT8, ZT12, ZT16, and ZT20. We included no more than two pups from each litter at the same time point. The mean body weights of subjects at PD7 were as follows: AF02:00, 78.26 ± 10.67 g; and AF10:00, 81.197 ± 5.42 g. The pup weight in both groups at PD7 was 80% in comparison with pups nursed by their mother (Caba et al., 2008).
Blood sampling and perfusion
Pups were killed with an overdose of sodium pentobarbital (50 mg per pup, intraperitoneal). A volume of 3 mL of blood was collected from the left ventricle of the heart with a 21G needle attached to a syringe, and then transferred to microcentrifuge tubes. Samples were allowed to rest for 30 min at room temperature, and were then centrifuged for 10 min at 574 g at 4 °C. The serum was transferred to labeled 1.5-mL tubes and stored at –20 °C for further analysis of CORT and glucose levels. Immediately after blood sampling, pups were perfused transcardially with saline solution (0.9%), followed by 4% paraformaldehyde in phosphate buffer (PB, pH 7.4). The brains were removed immediately after perfusion, cryoprotected successively in 10%, 20% and 30% sucrose in PB, and then sectioned coronally at 50 μm with a cryostat (Microm).
Immunohistochemistry
Serial sections were collected in PB from the level of the diagonal band of Broca to the mammillary bodies. Two adjacent series of every four sections were used for labeling of FOS or PER1 as described below, following protocols previously established in rabbit brain (Caba et al., 2003, 2008; Meza et al., 2008). Tissue was washed in PB four times for 10 min each to remove excess aldehydes, and then exposed for 10 min to 0.5% hydrogen peroxide solution to eliminate endogenous peroxidase activity. Free-floating sections were incubated in PER1 antibody raised in goat (sc-7724; Santa Cruz Biotechnology, Santa Cruz, CA, USA) or in FOS antibody raised in goat (sc-52G; Santa Cruz Biotechnology), both diluted 1 : 2000, in 3% normal horse serum and 0.3% Triton X-100 (Sigma), for 48 h at 4 °C. Tissue was incubated in biotinylated horse anti-goat antibody diluted 1 : 200 (Vector Laboratories) in PB and 0.3% Triton X-100 for 1 h at room temperature. Sections were then incubated in avidin–biotin–horseradish peroxidase complex diluted 1 : 200 (Vector Laboratories) in PB and 0.3% Triton X-100 for 1 h at room temperature. Between incubations, tissue was washed four times for 10 min in PB. Both FOS and PER1 antibody–peroxidase complexes were stained with a solution of 0.05% diaminobenzidine (Polysciences) in the presence of nickel sulfate (10 mg/mL; Fisher Scientific), cobalt chloride (10 mg/mL; Fisher Scientific) and 0.01% hydrogen peroxide to obtain a black–purple precipitate. After 10 min, tissue was transferred to PB to stop the reaction. Sections were mounted onto gelatin-subbed slides, dehydrated, and coverslipped with Permount. Antibodies had been well characterized and tested in the rabbit in previous studies (Caba et al., 2008).
Quantification of immunostaining
FOS and PER1 immunoreactivity was identified as a black–purple precipitate from the diaminobenzidine-nickel/cobalt reaction in the cell nucleus. Sections were coded and analyzed with an Olympus BX41 microscope by two observers blind to the experimental conditions. FOS-immunoreactive (FOS-ir) and PER1-immunoreactive (PER1-ir) cells were counted unilaterally in one section at the middle level of each nucleus according to a protocol for quantification previously established in our laboratory for rabbit pups (Caba et al., 2008). The identification of nuclei and brain structures was determined with the terminology of the rabbit brain of Gerhard (1968), Girgis & Shih-Chang (1981), and our previous experience in the brain of this species (Caba et al., 2003, 2008; Meza et al., 2008). The regions analyzed correspond to the levels NA1 for the SCN, NAP0 for the SON and PVN, and NP3 for the TMN, according to the stereotaxic atlas of Girgis & Shih-Chang (1981).
Glucose and CORT assays
Serum aliquots were thawed and processed with spectrophotometric methods, as previously described for rabbit pups (Morgado et al., 2008, 2010). The glucose level was estimated from 10 μL of serum sample with a commercial colorimetric kit (Spinreact, Ref. 41012) based on an enzymatic glucose oxidase reaction and with phenol–ampirona as chromogen, and measured at 500 nm. The CORT level was determined from 25 μL of serum sample by radioimmunoassay with a commercial kit from MP Biomedicals (Costa Mesa, CA, USA). The sensitivity of the assay was 0.25 μg/dL, and the intra-assay variation was 1.7%; the standards were run in triplicate, and the samples in duplicate. Both glucose and CORT assay protocols were run exactly as recommended by the manufacturers.
Locomotor activity
From PD5 to PD7, at around feeding time, we recorded the locomotor activity of nine litters with six to eight pups each. The locomotor activity was recorded with the method described by Pongrácz & Altbäcker (2003). This method measures the activity of all pups in the litter in a nest cage on a balance, which detects the slightest movements of the pups. The activity score is equivalent to the variance of the weight of the whole litter in their styrofoam nest cage, measured on a digital, electric balance (Sartorius BL1500). The weight of the litter was recorded six times over 1 min: once every 10 s at 120, 90, 60, 30 and 15 min before and 15, 30 and 60 min after feeding time.
Statistical analysis
Locomotor activity records, glucose and CORT concentrations and number of PER1-ir and FOS-ir cells of each nucleus studied were statistically analyzed with one-way anova in order to determine whether there were differences across different time points. This was followed by a post hoc Fisher LSD test with significant values set at P < 0.05. Statistical analysis was performed with SigmaStat 3.5. In order to not violate the assumptions of homogeneity of variance, in cases of SCN, SON, PVN, and TMN, data were rank-transformed before anova (Conover & Iman, 1981; Morgado et al., 2010). Data were expressed as the mean ± SE, and they were plotted without transformation.
Results
Locomotor activity
Both the AF02:00 and AF10:00 groups developed anticipatory activity with significantly high levels 60 min before milk formula infusion. Locomotor activity varied significantly with time in both the AF02:00 group (F7,31 = 83.87; P < 0.001) and the AF10:00 group (F7,31 = 42.75; P < 0.001) (Fig. 1). In the AF02:00 group, locomotor activity started to increase 60 min before feeding, steadily increased to reach its highest level 15 min before feeding, and then decreased to its lowest level 60 min after feeding. The highest level of activity, 15 min before feeding, was significantly different from values at all other time points before and after feeding (P < 0.001), whereas activity levels at 30 and 60 min before feeding were significantly higher than at 120 and 90 min before and 15, 30 and 60 min after feeding (P < 0.001).
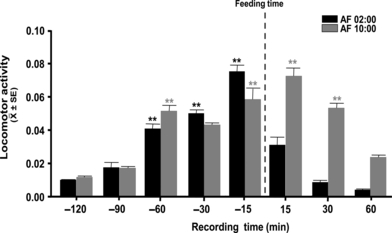
Locomotor activity at postnatal days 5-7 before and after feeding, of rabbit pups artificially fed at 02:00 (AF02:00) or 10:00 (AF10:00) h. Values are mean ± SE. Significant differences between the highest and the lowest values within same group. **P < 0.001.
In the AF10:00 group, activity levels were lowest 120 min before feeding, increased to their highest values 15 min before and after feeding, and then decreased 30 and 60 min after feeding. The highest activity levels 15 min before and after feeding were significantly higher than the values at 120, 90 and 30 min before and 60 min after feeding (P < 0.001), whereas the activity level at 30 min after feeding was significantly higher than at 120, 90 (P < 0.001) and 30 min (P < 0.04) before and 60 min after feeding.
Glucose
Daily milk formula infusion induced a daily rhythm of serum glucose in both groups (Fig. 2A). In the AF02:00 group (F5,23 = 4.76; P = 0.006), the maximum levels of glucose at ZT4 and ZT8 were significantly different from those at ZT0 (P < 0.001) and ZT16 (P < 0.05). In the AF10:00 group (F5,23 = 3.12; P = 0.033), the maximum levels at ZT4, ZT8 and ZT12 were significantly different from that at ZT0 (P = 0.01).
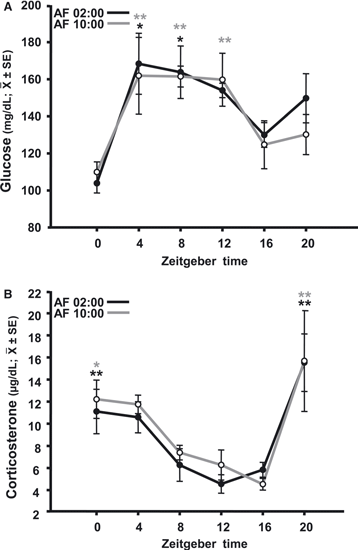
Temporal profiles of glucose (A) and corticosterone (B) in 7-day-old rabbits artificially fed at 02:00 h (AF02:00) or 10:00 h (AF10:00), from PD2 to PD7. Significant differences between the highest and the lowest values within the same group –*P < 0.05, **P < 0.001. SE, standard error.
CORT
Serum levels of CORT varied significantly with time, in both the AF02:00 group (F5,23 = 6.46; P = 0.001) and the AF10:00 group (F5,23 = 3.99; P = 0.013) (Fig. 2B), with the highest values seen 4 h before and at the time of feeding. In the AF02:00 group, the CORT level at ZT0 was significantly higher than those at ZT8 (P = 0.05), ZT12 (P = 0.011), and ZT16 (P = 0.035), and the level at ZT20 was also significantly higher than those at ZT8, ZT12 and ZT16 (P < 0.001 in all cases). In the AF10:00 group, the level at ZT0 was significantly higher than that at ZT16 (P = 0.02), whereas the level at ZT20 was significantly different from those at ZT8 (P = 0.013), ZT12 (P = 0.006), and ZT16 (P = 0.006).
PER1 in the SCN
Figure 3A and B shows PER1 expression at six different time points throughout a complete 24-h cycle at PD7 in pups fed at 02:00 h and 10:00 h, respectively. Quantitative analysis indicated that PER1 expression in the SCN had a robust rhythm in both night-fed and day-fed pups that was not affected by the time of feeding (Fig. 3E). PER1 expression varied significantly with time, in both the AF02:00 group (F5,23 = 20.14; P < 0.001) and the AF10:00 group (F5,23 = 36.02; P < 0.001). Values at ZT0 and ZT20 for the AF02:00 group and at ZT12 and ZT16 for the AF10:00 group were significantly different from those at the remaining time points (P < 0.001 in all cases).
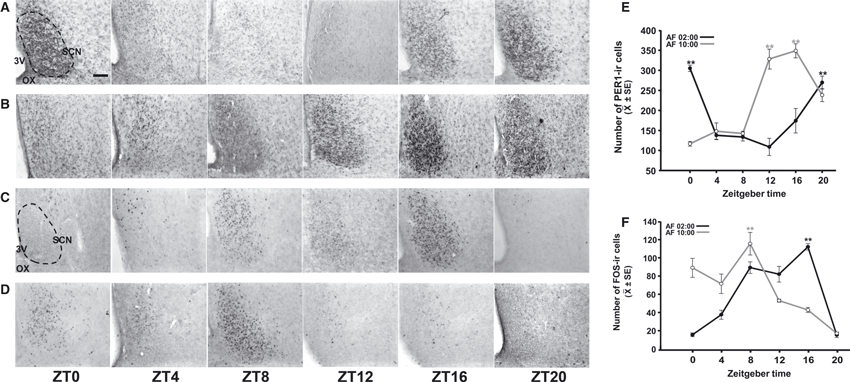
Rhythmic expression of PER1 and FOS in the middle portion of the SCN in 7-day-old rabbits artificially fed from PD2 to PD7. (A and B) Photomicrographs of representative sections illustrating PER1-ir cells in the SCN at six time points throughout a 24-h cycle in pups fed at 02:00 h (A) or 10:00 h (B). (C and D) Photomicrographs of representative sections illustrating FOS-ir cells in the SCN at six time points throughout a 24-h cycle in pups fed at 02:00 h (C) or 10:00 h (D). The dotted line delimits the SCN. 3V, third ventricle; OX, optic chiasma. Scale bar: 100 μm. (E and F) Comparison of PER1-ir cells (E) and FOS-ir cells (F) in the SCN in the AF02:00 and AF10:00 groups. Values are mean ± SE. Significant differences between the highest and the lowest values within the same group –**P < 0.001).
FOS in the SCN
Figure 3C and D shows FOS expression at six different time points throughout a complete 24-h cycle in PD7 in pups fed at 02:00 h and 10:00 h, respectively. Quantitative analysis indicated that FOS expression in the SCN had a robust rhythm in both night-fed and day-fed pups that was not affected by time of feeding (Fig. 3F). FOS expression varied significantly with time, in both the AF02:00 group (F5,23 = 45.34; P < 0.001) and the AF10:00 group (F5,23 = 30.17; P < 0.001). In the AF02:00 group, the highest value at ZT16 was significantly different from those at all remaining time points (P < 0.001). In the AF10:00 group, the highest value at ZT8 was significantly different from those at ZT4, ZT12, ZT16, ZT20 (P < 0.001 in all cases), and ZT0 (P = 0.03).
PER1 in the SON
Figure 4A shows PER1 expression at ZT0 and ZT12 in the AF02:00 and AF10:00 groups. Quantitative analysis indicated that the number of PER1-ir cells in the SON varied significantly with feeding time in both the AF02:00 group (F5,23 = 47.00; P < 0.001) and the AF10:00 group (F5,23 = 65.43; P < 0.001) (Fig. 4B). In both groups, PER1 levels were very low at ZT0, and then increased at ZT8, reaching a peak at ZT12. Values at ZT8 and ZT12 were significantly different from those at all remaining time points (P < 0.001).
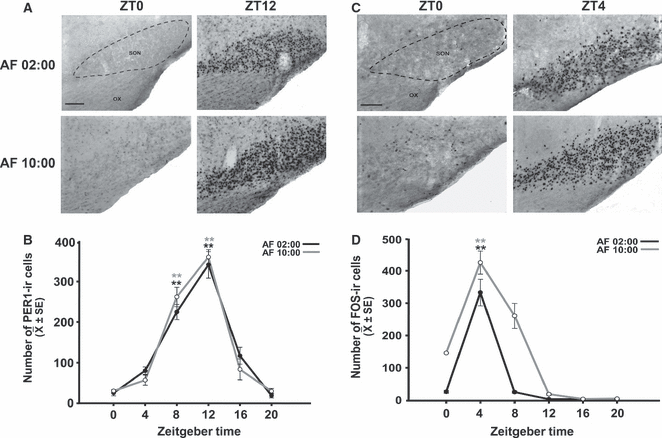
Synchronization of PER1 and FOS expression in the SON of pups artificially fed from PD2 to PD7. (A) Photomicrographs of representative sections illustrating the rhythmic expression of PER1 in the middle portion of the SON in the AF02:00 and AF10:00 groups at ZT0 and ZT12. (B) Expression of PER1 in the SON at six time points throughout a 24-h cycle. (C) Photomicrographs of representative sections illustrating the expression of FOS in the middle portion of the SON in the AF02:00 and AF10:00 groups at ZT0 and ZT4. (D) Expression of FOS in the SON at six time points throughout a 24-h cycle. The dotted line delimits the SON. OX, optic chiasma. Scale bar: 100 μm. Values are mean ± SE. Significant differences between the highest and the lowest values within the same group –**P < 0.001).
FOS in the SON
Figure 4C shows FOS expression at ZT0 and ZT4 in the AF02:00 and AF10:00 groups. Quantitative analysis indicated that the number of FOS-ir cells in the SON varied significantly with time in both the AF02:00 group (F5,23 = 22.26; P < 0.001) and the AF10:00 group (F5,23 = 96.45; P < 0.001) (Fig. 4D). In both groups, the FOS level was lowest at ZT0, and then increased to its maximum value at ZT4, which was significantly different from values at all remaining time points (P < 0.001).
PER1 in the PVN
Figure 5A shows PER1 expression at ZT0 and ZT8 in the AF02:00 and AF10:00 groups. Quantitative analysis indicated that the number of PER1-ir cells in the PVN varied significantly with time in both the AF02:00 group (F5,23 = 57.93; P < 0.001) and the AF10:00 group (F5,23 = 49.56; P < 0.001) (Fig. 5B). In both groups, the values were very low at ZT0 and then increased to their highest levels at ZT8, which were significantly different from the values at ZT0, ZT4, ZT16, and ZT20. Additionally, the value at ZT12 in the AF10:00 group was significantly higher than those at ZT0, ZT4, ZT16, and ZT20 (P < 0.001 in all cases).
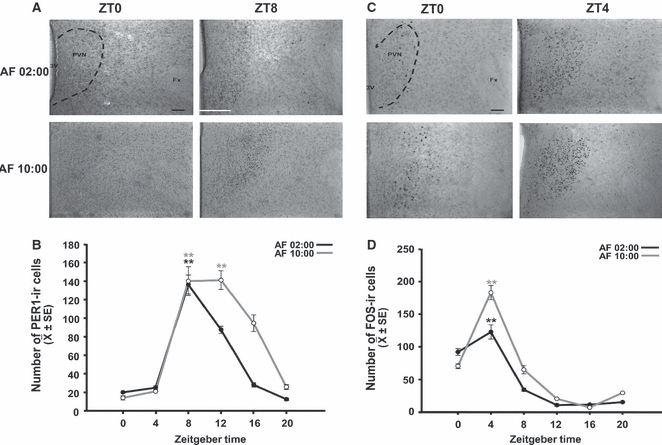
Synchronization of PER1 and FOS expression in the PVN of pups artificially fed from PD2 to PD7. (A) Photomicrographs of representative sections illustrating the expression of PER1 in the middle portion of the PVN in the AF02:00 and AF10:00 groups at ZT0 and ZT8. (B) Expression of PER1 in the PVN at six time points throughout a 24-h cycle. (C) Photomicrographs of representative sections illustrating the expression of FOS in the middle portion of the PVN in the AF02:00 and AF10:00 groups at ZT0 and ZT4. (D) Expression of FOS in the PVN at six time points throughout a 24-h cycle. The dotted line delimits the PVN. Fx, fornix; 3V, third ventricle. Scale bar: 100 μm. Values are mean ± SE. Significant differences between the highest and the lowest values within the same group –**P < 0.001.
FOS in the PVN
Figure 5C shows FOS expression at ZT0 and ZT4 in the AF02:00 and AF10:00 groups. Quantitative analysis indicated that the number of FOS-ir cells in the PVN varied significantly with time in both the AF02:00 group (F5,23 = 42.98; P <0.001) and the AF10:00 group (F5,23 = 68.24; P < 0.001) (Fig. 5D). In the AF02:00 group, values were low at ZT0 and then increased to the highest level at ZT4. The maximal value at ZT4 was significantly different from those at ZT0 (P = 0.02), ZT8, ZT12, ZT16, and ZT20 (P < 0.001). Similarly, in the AF10:00 group, FOS-ir cell numbers were low at ZT0 and then increased to the maximal value at ZT4, which was significantly different from those at the remaining time points (P < 0.001 in all cases).
PER1 in the TMN
Figure 6A shows PER1 expression at ZT0 and ZT12 in the AF02:00 and AF10:00 groups. Quantitative analysis indicated that the number of PER1-ir cells in the TMN varied significantly with time in both the AF02:00 group (F5,23 = 12.92; P < 0.001) and the AF10:00 group (F5,23 = 12.14; P < 0.001) (Fig. 6B). In both groups, values were very low at ZT0 and ZT4, and then sharply increased to the highest levels at ZT8 and ZT12. Also, in both groups, values at ZT8 and ZT12 were significantly different from those at all remaining time points (P < 0.001 in all cases).
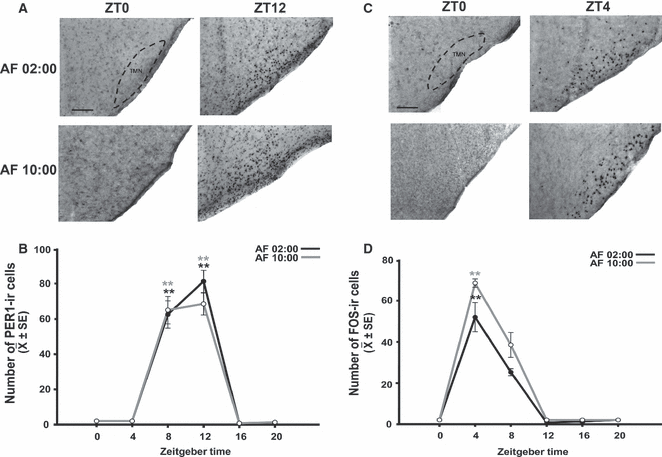
Synchronization of PER1 and FOS expression in the TMN of pups artificially fed from PD2 to PD7. (A) Photomicrographs of representative sections illustrating the expression of PER1 in the middle portion of the TMN in the AF02:00 and AF10:00 groups at ZT0 and ZT12. (B) Expression of PER1 in the TMN at six time points throughout a 24-h cycle. (C) Photomicrographs of representative sections illustrating the expression of FOS in the middle portion of the TMN in the AF02:00 and AF10:00 groups at ZT0 and ZT4. (D) Expression of FOS in the TMN at six time points throughout a 24-h cycle. The dotted line delimits the TMN. Scale bar: 100 μm. Values are mean ± SE. Significant differences between the highest and the lowest values within the same group –**P < 0.001.
FOS in the TMN
Figure 6C shows FOS expression at ZT0 and ZT4 in the AF02:00 and AF10:00 groups. Quantitative analysis indicated that the number of FOS-ir cells in the TMN varied significantly with time in both the AF02:00 group (F5,23 = 14.36; P < 0.001) and the AF10:00 group (F5,23 = 9.73; P < 0.001) (Fig. 6D). In both groups, cell numbers were very low at ZT0, and then sharply increased to the highest value at ZT4, which was significantly different from that at all remaining time points (P < 0.001 in all cases).
Discussion
It is well known that nursing is a strong synchronizer of circadian rhythms in rabbit pups, but the precise identity of the stimulus responsible for entrainment by nursing has been unclear. The present study indicates that food serves as the primary synchronizing cue for entrainment of the behavioral, hormonal, metabolic and neural rhythms associated with nursing in newborn rabbit pups. This assumption is supported by the fact that pups were deprived at birth of all stimulatory signals from the mother and were fed with an artificial formula.
During most of the day, newborn rabbits remain huddled, well covered with material from the nest, and rather inactive. Occasionally, pups at the edge of the group crawl around the nest, but they usually soon rejoin the group (Hudson & Distel, 1989). However, as nursing approaches, they show increased locomotor activity and rearing movements, reacting intensely to external stimuli (Hudson & Distel, 1989). Chronobiological studies indicate that, indeed, 3 h before nursing, pups show an increase in locomotor behavior as recorded by vibrations caused by major activity, which is more intense 1 h prior to nursing between PD6 and PD14 (Jilge, 1993). In addition, the increase in the alertness of the pups is also demonstrated by a rise in the number of vocalizations occurring during the hour prior to nursing (Schuh et al., 2004). In the present study, we found a significant increase in pups’ activity beginning 60 min before nursing that reached the highest levels 15 min before and after feeding, similar to the findings of Pongrácz & Altbäcker (2003), who used a similar methodology to quantify pup activity before and after nursing. In addition, it is important to mention that locomotor activity after feeding of pups at 10:00 h is higher than that in pups fed at 02:00 h, which is similar to what has been found for pups nursed by their mother (Caba et al., 2008). We do not know the reason for this difference, but it may be related to a modulatory effect of the SCN on pups’ locomotor behavior. Future studies should address this issue. The increase in alertness in rabbit pups is analogous to the increased activity shown by adult rodents under a restricted food schedule prior to food presentation (Stephan, 2002). Together with previous results from our laboratory (Caba et al., 2008) and others (Jilge, 1993, 1995), our observations confirm that, before food ingestion, pups show a dramatic increase in activity when they are fed either by nursing or with milk formula, which, on the basis of our present results, can now indeed be termed FAA.
CORT rhythms in artificially fed pups, like activity rhythms, were synchronized by milk formula. CORT concentrations increased before and at the time of feeding, then dropped, and increased again in advance of the next feeding bout, similar to those changes seen in pups nursed by their mother (Rovirosa et al., 2005; Morgado et al., 2008, 2010). In adult rats, there is also CORT elevation before food presentation under a restricted feeding paradigm (Krieger, 1974). Although the milk formula infused lacked some components of the mother’s milk, its nutrients and volume were sufficient to synchronize the CORT rhythm and induce an elevation of this hormone at the time of FAA. However, the composition of the milk formula for future studies may need to be improved, as plasma glucose concentrations were slightly lower than in nursed pups (Morgado et al., 2008, 2010), but still well above the threshold of clinical hypoglycemia reported for adult rabbits (Suckow & Douglas, 1997).
On the other hand, it is important to note that, in our previous experiments, we reported a secondary CORT peak at around 18:00 h (Morgado et al., 2008, 2010). In adult rats under a restricted feeding schedule, two CORT peaks have also been reported, one at the time of food presentation and a secondary attenuated peak in the evening (Moberg et al., 1975; Honma et al., 1992). The presence of the secondary peak in newborn rabbits may be related to the nocturnal CORT rise observed in adult rabbits at 18:00 h (Szeto et al., 2004). We previously proposed that this secondary elevation in rabbit pups could be related to the development of the endogenous circadian rhythm of CORT, which will be need to be established in adult subjects, to which pups were exposed in utero (Morgado et al., 2010). The reason for this difference in CORT secretion in artificially fed pups is not clear, but is perhaps related to an unidentified cue received from the mother during normal nursing. In rat pups, separation from the mother during first days of life has an important and long-lasting impact on the responsiveness of the hypothalamic–pituitary–adrenal (HPA) axis in adulthood (Ladd et al., 2004). In rabbit pups as well, separation from the mothers for 48 h at PD9–11 results in long-lasting disruption of HPA axis responsiveness later in life (Brecchia et al., 2009). As discussed above, during nursing pups are exposed to several cues from the mother, among which milk is perhaps one of the most important. Although there are no reports of milk composition in rabbits, in the rat, maternal milk contains, besides nutrients, hormones, steroids, antibodies, enzymes, and growth factors, among many other biologically active compounds (Withworth & Grosvenor, 1978; Grosvenor et al., 1993; Rowe & Kennaway, 2002). In contrast to rats, rabbit pups remain alone in the nest for most of the time, and the lack of one or more factors in the milk (or from the mother, i.e. pheromonal, tactile, etc.) may have resulted in disruption of the normal developmental pattern of the HPA axis, as observed at PD7 in the present study. In fact, in rat pups, ingestion of CORT through the mother’s milk during early lactation affects the development of the HPA axis (Catalani et al., 1993; Brummelte et al., 2010). Moreover, in general, the absence of particular stimuli during maternal separation profoundly affects physiology, neural development and behavior in adult rats (Chatterjee et al., 2007; Melo et al., 2009). Future studies could explore the effects of the absence of particular stimuli from the mother during lactation in the rabbit.
In the brain, the SCN was not entrained by the timing of feeding. Specifically, neither the FOS nor the PER1 rhythm in the rabbit pup SCN shifted as a consequence of scheduled nursing, similar to our previous results obtained with pups nursed by their mother, in which we observed only a small change in amplitude of the rhythm (Caba et al., 2008). In contrast, others have reported a shift in the rhythm of mRNA clock genes in the SCN as a consequence of a shift in nursing time (Caldelas et al., 2009), although this change may have been attributable to a developmental process of this nucleus (Caldelas et al., 2009; reviewed in Caba & González-Mariscal, 2009). In adult rats, several reports have indicated that clock gene and protein rhythms in the SCN do not shift in relation to feeding schedules (Damiola et al., 2000; Hara et al., 2001). The fact that subjects exhibit normal or enhanced FAA in the absence of the SCN has reinforced the idea that this nucleus is not necessary for food entrainment (Stephan et al., 1979; Acosta-Galvan et al., 2011). Moreover, similarly to what has been found in adult rats, bilateral SCN lesions in newborn rabbit pups indicate that this nucleus is not necessary for FAA (Hernández-Campos et al., 2011).
In contrast, other brain structures showed clear synchronization with scheduled feeding. There was immediate induction of FOS in the SON, PVN and TMN at 4 h after feeding. Previously, we reported substantial FOS induction in both the SON and the PVN as a consequence of nursing, and most of these cells were oxytocinergic (Caba et al., 2003). On this basis, it is possible that the FOS induction found in the present study is also related to activation of the oxytocinergic system by gastric distension (Renaud et al., 1987) caused by the milk formula, release of oxytocin associated with satiety (Verbalis et al., 1995; Olszewski et al., 2010), or modulation of the vagal digestive input in the brainstem (Flanagan et al., 1992). We also found activation in the TMN after feeding, similarly to other studies in adult rats under a food restriction schedule (Inzunza et al., 2000; Angeles-Castellanos et al., 2003), although we did not find activation of this nucleus before feeding, as reported by these authors. This suggests an important difference between FAA in rats and in rabbits. In rats, FOS is induced in the TMN of motivated, hungry rats enticed with food, but not in the TMN of non-motivated rats presented with food (Valdés et al., 2005). Therefore, one explanation for the observed difference between rats and rabbit pups is that FAA is induced in the rat for several days and weeks, usually during their rest period, whereas, for rabbit pups, it is normal to eat once a day and entrain to this regime by 3–4 days after birth (Jilge, 1993; Caba et al., 2008).
In agreement with the FOS results, 8–12 h after feeding there is strong PER1 induction in the same nuclei. We have reported a similar induction of PER1 in several hypothalamic areas 8–12 h after suckling in pups (Caba et al., 2008) and nursing in adult rabbits (Meza et al., 2008, 2011). The presence of clock genes in brain areas other than the SCN is well documented in other species (Wakamatsu et al., 2001; Abe et al., 2002; Kriegsfeld et al., 2003; Granados-Fuentes et al., 2006). It has been suggested that clock genes/proteins provide temporal regulation to specific brain structures in order to organize appropriate responses to a particular stimulus (Kriegsfeld & Silver, 2006). Induction of PER1 in the SON and the PVN may reflect synchronization of neuroendocrine function, whereas, in the TMN, PER1 induction may be related to the synchronization of FAA, as this nucleus is part of the ascending arousal system (Valdés et al., 2005).
In conclusion, our findings suggest that, in nursing rabbit pups, food is the major signal responsible for synchronizing activity, glucose and corticosterone rhythms, as well as rhythms in FOS and PER1 in the SON, PVN, and TMN. By contrast, rhythms of FOS and PER1 in the SCN were not synchronized by artificial feeding of pups, paralleling the inability of food to shift SCN rhythms in adult rodents. It remains to be established whether induced rhythms persist in the absence of artificial feeding in fasted pups. The results reinforce the usefulness of the rabbit pup as a natural model of food entrainment, with milk being able to serve as a strong synchronizing signal for behavioral, hormonal, metabolic and neural parameters. We conclude that the rabbit pup is a natural model of FAA, as food synchronizes behavioral, hormonal, metabolic and neural parameters.
Acknowledgements
This research was partially supported by National Institutes of Health/Fogarty grant R01TW006636 (M. Caba). We gratefully acknowledge Biol. Mercedes Acosta for her invaluable help with maintaining and caring for the rabbit colony.
Abbreviations
-
- AF
-
- artificial feeding
-
- CORT
-
- corticosterone
-
- FAA
-
- food anticipatory activity
-
- FOS
-
- c-Fos
-
- FOS-ir
-
- c-Fos-immunoreactive
-
- HPA
-
- hypothalamic–pituitary–adrenal
-
- PB
-
- phosphate buffer
-
- PD
-
- postnatal day
-
- PER1
-
- PERIOD1
-
- PER1-ir
-
- PERIOD1-immunoreactive
-
- PVN
-
- paraventricular nucleus
-
- SCN
-
- suprachiasmatic nucleus
-
- SON
-
- supraoptic nucleus
-
- TMN
-
- tuberomammillary nucleus
-
- ZT
-
- zeitgeber time


