Vacuolization correlates with spin–spin relaxation time in motor brainstem nuclei and behavioural tests in the transgenic G93A-SOD1 mouse model of ALS
Abstract
In recent years, magnetic resonance imaging (MRI) has emerged as a preferred tool for the diagnosis of amyotrophic lateral sclerosis (ALS) in humans. A widely used animal model for human ALS is the G93A-superoxide dismutase 1 (G93A-SOD1) transgenic mouse model. However, the mechanisms for the selective degeneration of motor neurons in the brainstem and spinal cord are still uncertain. In our study, we applied MRI at 4.7 Tesla to non-invasively evaluate pathological alterations in the brainstem of this animal model and to follow the progression of the disease. Extending previous investigation, we used the relaxation parameter T2 as a suitable measure for the progression of ALS, and evaluated the potential agreement with histological evaluation and behavioural data of open-field tests. In the brainstem of G93A-SOD1 mice, T2 values were significantly increased in the motor nuclei Nc. V, Nc. VII and Nc. XII, as early as Day 80, i.e. before the average disease onset at about Day 90. Moreover, this increase is associated with a progressive development of vacuoles in the brainstem motor nuclei and a significantly decreased performance in behavioural tests. Overall, MRI is a very sensitive tool to obtain correlates for neuronal degeneration in vivo. Furthermore, MRI enables us to investigate a follow up at different time points of the disease. These advantages are especially useful for therapeutic studies with respect to survival rates of motor neurons using mouse models. Finally, our data suggest that MRI does not only resemble the findings of behavioural tests, but is potentially superior to behavioural studies.
Introduction
Amyotrophic lateral sclerosis (ALS) is a human neurodegenerative disorder that progressively leads to paralysis and death caused by the loss of motor neurons in the brainstem, the motor cortex and especially in the spinal cord. While approximately 90% of all ALS cases are sporadic (so-called sALS), 5–10% are familial ALS (fALS) and linked to an autosomal dominantly inherited mutation. Furthermore, in about 15–20% of those fALS cases, a mutation in the Cu/Zn superoxide dismutase 1 (Cu/Zn SOD1) gene has been found (Rosen et al., 1993; Harris, 1998). Hence, to study the pathogenesis of fALS, the transgenic mouse model with a G93A-SOD1 mutation was developed (Gurney et al., 1994; Ripps et al., 1995; Wong et al., 1995), where the clinical and neuropathological symptoms are similar to a human selective anterior horn cell degeneration. As a result of progressive motor neuron loss (Talbot, 2002), G93A-SOD1 mice with a high copy number of the human SOD1 gene (Gurney, 1997) show wasting, abnormal splay of the hind limbs and tremor at about Day 90 (onset of clinical symptoms). During the progression of the disease the animals develop a hind limb paralysis and die at about Day 130 (Heiman-Patterson et al., 2005). Even though the G93A-SOD1 animal model has been well evaluated by biochemical methods (Gurney et al., 1994; Hafezparast et al., 2003; Kaspar et al., 2003; Kieran et al., 2005; Teuchert et al., 2006; Niessen et al., 2007) and behavioural test (Weydt et al., 2003; Dobrowolny et al., 2005; Schutz et al., 2005), pathological mechanisms that cause a selective motor neuron degeneration still remain unclear. Previous studies suggest that a gain of cytotoxic function is induced by the mutated SOD1. As potential mechanisms for this gain of function, oxidative stress, aberrant protein aggregation, mitochondrial degeneration or glutamate-mediated excitotoxicity are discussed. However, a simple loss of dismutase activity appears not to be the reason for selective motor neuron degeneration (reviewed in Bruijn et al., 2004).
Recently, several studies showed that magnetic resonance imaging (MRI) provides a good tool to study the progression of ALS in the transgenic mouse model (Angenstein et al., 2004; Zang et al., 2004; Niessen et al., 2006). However, no clear correlation to existing standard methods for evaluation of ALS progression, such as histology and behavioural open-field test, were given. In our study, we used a 4.7 Tesla MRI scanner to evaluate the progression of ALS in the brainstem of transgenic G93A-SOD1 mice 40, 60, 80, 100 and 120 days after birth compared with age-matched control mice. Thereby, we are already expanding the results of previous studies significantly. Furthermore, we thoroughly evaluated neuronal morphology in affected areas and performed several behavioural open-field tests to obtain complementary information about the disease progression and to evaluate correlations with the imaging results.
Materials and methods
Transgenic mice
Transgenic mice of the strain B6SJL(G93A-SOD1), expressing human SOD1 with a G93A mutation in high copy number, were obtained from Jackson Laboratory, Bar Harbor, USA. Subsequently, male B6SJL(G93A-SOD1) mice were bred with non-transgenic B6SJL female mice in the animal facility of the Department of Neurology, University of Ulm, Germany. Transgenic mice were identified by polymerase chain reaction assay of DNA from tail tissue. For our experiments, age-matched non-transgenic littermates were used as controls. Measurements were performed every 20 days between Day 40 and Day 120 to monitor the progression of the disease in the brainstem. Mice were housed in a temperature- and humidity-controlled environment, in which water and food were available ad libitum.
All animal experiments were approved by the animal care committee of the Land Baden-Württemberg (No. 02-018) in accordance with the regulations of the German Federal Law on Care and Use of Laboratory Animals, and with the European Communities Council Directive of 24 November 1986 (86/609/EEC).
MRI data acquisition
MRI data were acquired on a Biospec 47/40 scanner (Bruker BioSpin, Ettlingen, Germany) located in the in-vivo-Imaging Laboratory at the research site of Boehringer Ingelheim Pharma GmbH & Co. KG in Biberach (Germany). The scanner is equipped with a BGA12 gradient coil system (200 mT/m). A volume coil was used for excitation; the MR-signal was received up by a custom-built surface coil optimized for mice. For MR imaging, transgenic (n = 12) and non-transgenic mice (n = 7) were anaesthetized through continuous inhalation of 1.2–1.5% isoflurane (in 70 : 30 N2O : O2, v : v) and fixed in a stereotactic head holder during scanning. For anatomical orientation, 11 contiguous T2-weighted sagittaly medially located slices using a RARE (rapid acquisition relaxation enhanced) sequence (Hennig et al., 1986) were acquired. Imaging parameters were: TR 2100 ms; TE 20 ms; TEeff 81 ms; slice thickness 600 µm; FOV 30 mm × 30 mm; matrix size 256 × 256; RARE factor 8; 16 averages. Following the anatomical images, a series of axially orientated T2-weighted images with increasing echo time covering the brainstem was collected with the following imaging parameters: multi-slice multi-echo (MSME); TR 4000 ms; 16 echo images; TE range from 10.1 to 161 ms equally spaced; 11 slices; slice thickness 600 µm; FOV 28.1 mm × 25.6 mm; matrix size 256 × 128; two averages. The total scanning time for both measurements was approximately 45 min.
Data processing and statistics
For data processing, a set of regions-of-interest (ROIs) covering the main brainstem nuclei [nucleus (Nc.) nerve (Nv.) facialis, Nc. Nv. hypoglossus and Nc. Nv. trigeminus] was defined using the ParaVision Software (Bruker Biospin MRI, Ettlingen, Germany). From the mean signal intensity of each ROI and the corresponding echo times, the mean T2 value of the respective nucleus was calculated by fitting to a monoexponential. Motor nuclei in the brainstem were segmented in agreement with the Paxinos anatomy atlas for mice according to the locations shown in Fig. 2 (Paxinos & Franklin, 2000). Segmentation of the brainstem nuclei also yielded their respective area.
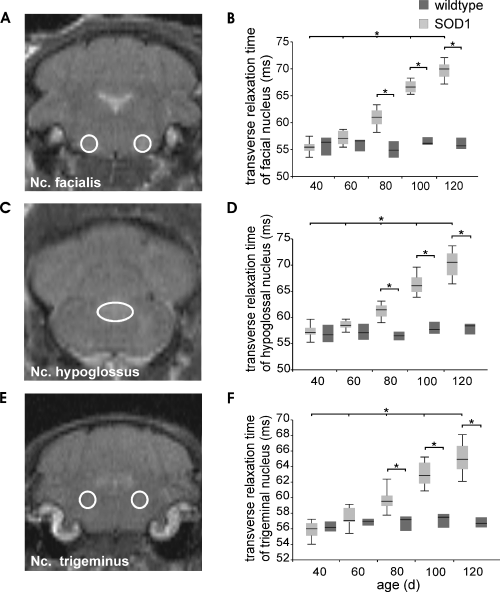
Axial T2-weighted MR sections of transgenic G93A-superoxide dismutase 1 (G93A-SOD1) mice (A, C, E) and T2 values of motor nuclei within the brainstem of transgenic G93A-SOD1 (n = 12) and wild-type mice (n = 7) 40, 60, 80, 100 and 120 days after birth (B, D, F). T2 values of (B) facial nucleus, (D) hypoglossal nucleus and (F) trigeminal nucleus were segmented according to the scheme shown in the left column (A, C, E), and are presented as median with quartiles (Q25 and Q75); significance level: *P < 0.05. Nc., nucleus.
Histology
Twenty-five G93A-SOD1 and 25 wild-type mice were anaesthetized with 25% chloral hydrate (0.36 mg/kg body weight) and killed by intracardiac perfusion of 0.9% NaCl solution followed by 4% paraformaldehyde. Five transgenic and five wild-type mice were used at every time point (Day 40, 60, 80, 100 and 120 after birth). After perfusion, brains were removed, dehydrated in graded alcohol, embedded in paraffin and cut into 7-µm-thick transversal sections on a sliding microtome (Microm Laborgeräte GmbH, Walldorf, Germany). Sections were stained with haematoxylin and eosin (H&E), and images captured using a digital camera (CC12 soft imaging system, U-CMAD3, Olympus, Tokyo, Japan) attached to a microscope (BX51, Olympus, Japan). From each animal the brainstem nuclei Nc. Nv. facialis, Nc. Nv. hypoglossus and Nc. Nv. trigeminus were identified with the Paxinos anatomy atlas for mice (Paxinos & Franklin, 2000), and one section per animal was analysed. To avoid double counting, a defined area of 17.5 mm2 in each well-orientated frontal section was divided into nine equal fields. Only vacuoles larger than 3 µm in diameter were counted in each section.
Behavioural tests
To identify differences in exploratory behaviour and locomotor activity, mice were tested in an open-field arrangement. Behavioural tests were performed with 12 male G93A-SOD1 and seven wild-type mice, which were also used in the MRI experiments. During the experiments mice were placed in an arena (40 × 40 cm; Tru Scan Photobeam Motor Activity Monitors, Coulbourn Instruments, Allentown, PA, USA) and were allowed to explore the arena freely for 30 min. During this period the following parameters were measured and processed (Software Tru Scan 99, Coulbourn Instruments): total distance; move time; and number of rearings. Mice were tested every 20 days for comparison with the MRI measurements.
Statistical analysis
Alterations in T2 values and behavioural parameters were analysed by non-parametric two-factorial analyses of variance (anova) using the factors ‘genetic background’ (G93A-SOD1 mice vs non-transgenic control mice) and ‘animal age’ (40, 60, 80, 100 and 120 days after birth). Post hoc tests within either animal group were done by Wilcoxon signed rank test, while tests between animal groups were done using a Wilcoxon rank sum test. The level of significance used throughout was an error probability of 5% (P < 0.05), which was Bonferroni–Holm-adjusted to account for multiple comparisons. Correlation analyses were done using a non-parametric Spearman test, because a non-normal distribution of the data sets has to be assumed. Statistical significant differences in the number of vacuoles analysed in the H&E-stained sections were determined by anova . A value of P < 0.05 was considered significant.
Results
In our study, we used in vivo MR relaxometry, which yields the transverse spin–spin relaxation time T2 as an absolute parameter for structural alterations and open-field behavioural test to follow the progression of the neurodegenerative disease of ALS in transgenic G93A-SOD1 mice. Figure 1 shows a set of sagittal T2-weighted MR images obtained from a transgenic G93A-SOD1 mouse (Fig. 1A, C and E) and an age-matched control mouse (Fig. 1B, D and F) 60, 80 and 120 days after birth with two adjacent sections for both animal (left: bregma position 0.0 mm; right: bregma position 0.6 mm). In the T2-weighted MR images of Fig. 1, the development of the degeneration of brainstem motor nuclei Nc. Nv. XII (hypoglossal nucleus), Nc. Nv. V (trigeminal nucleus) and Nc. Nv. VII (facial nucleus) is clearly visible as early as Day 80. Overall, T2 maps were generated 40, 60, 80, 100 and 120 days after birth for a group of G93A-SOD1 mice and an age-matched group of control mice. Motor nuclei in the brainstem were segmented according to the locations shown in Fig. 2 in agreement with the Paxinos anatomy atlas for mice.
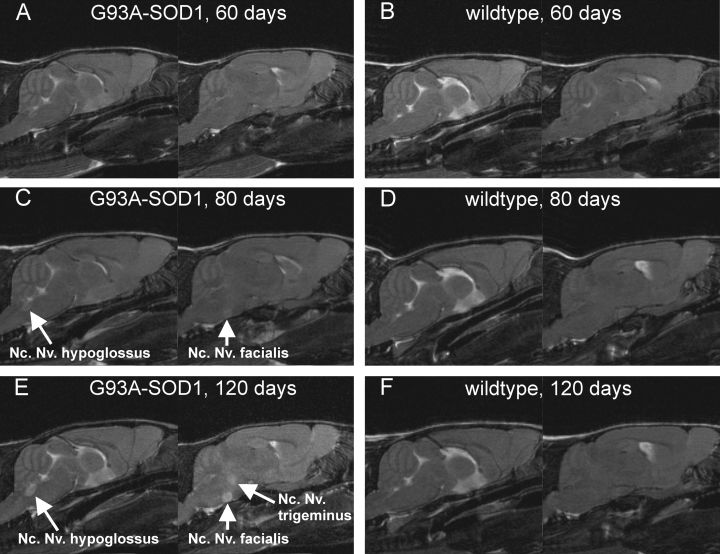
Sagittal T2-weighted MR section of transgenic G93A-superoxide dismutase 1 (G93A-SOD1) mouse (A, C, E) and control mouse (B, D, F) for the adjacent Bregma positions 0.0 mm (left) and 0.6 mm (right). Images were obtained at various time points, with hyperintensities in the trigeminal nucleus (Nc. V), hypoglossal nucleus (Nc. XII) and facial nucleus (Nc. VII). Nc., nucleus; Nv., nerve.
Data obtained from T2 maps were analysed for both animal groups (transgenic and wild-type) and for all time points (40, 60, 80, 100, 120 days after birth) using non-parametric two-factorial anova for repeated measurements. In summary, anovas revealed a significant interaction between animal age and genetic background in Nc. V, VII and XII (for all: P < 0.001). Within the group of G93A-SOD1 mice, post hoc comparisons of T2 values in the three brainstem nuclei revealed a continuous age-dependent increase between Days 40 and 60 (Nc. V, P = 0.004; Nc. VII, P = 0.005; Nc. XII, P = 0.013), between Days 60 and 80 (for all: P < 0.005), between Days 80 and 100 (for all: P < 0.005), and between Days 100 and 120 (for all: P < 0.005). Post hoc comparison within the group of age-matched control mice yielded no significant difference between any two time points. Between the two animal groups, significantly higher T2 values were found in G93A-SOD1 mice for all the three brainstem nuclei V, VII and XII at 80, 100 and 120 days after birth (for all: P < 0.001) compared with age-matched control mice. Results of group and time point comparisons are summarized in Fig. 2, where the location of the three brainstem nuclei is also depicted in coronal MR slices. Furthermore, the area of the brainstem nuclei increased during the progression of the disease. Between 80 and 120 days after birth, significant differences were found for Nc. VII (0.84 ± 0.17 mm2 to 1.03 ± 0.13 mm2; P < 0.05) and for Nc. XII (1.00 ± 0.19 mm2 to 1.20 ± 0.11 mm2; P < 0.05); for Nc. V no significant differences in the area were detected between 80, 100 and 120 days after birth. In MR images, motor nuclei in the brainstem of the wild-type mice cannot be distinguished from the surrounding tissue.
For morphological correlates, we performed H&E staining with brain sections of G93A-SOD1 and wild-type mice at the age of 40, 60, 80, 100 and 120 days after birth. Light microscopy inspection of brain sections revealed morphological alterations in the investigated brainstem nuclei of G93A-SOD1 mice around the same time point when changes in the MRI images became obvious (Fig. 3). anova between all time points (40, 60, 80, 100 and 120 days after birth) revealed a significantly increased number of vacuoles in the brainstem nucleus V from Day 80 onwards (Fig. 4). The number of vacuoles in a defined area of 17.5 mm2 increased significantly from 56.8 ± 7.4 at Day 80 to 281.5 ± 31.5 at Day 120 (Fig. 4, for all: P < 0.05). The development of vacuolization in the brainstem nuclei VII and XII also started around Day 80 after birth. Data obtained from brain slices of these two nuclei revealed similar results in the number of vacuoles as seen in nucleus V (data not shown).
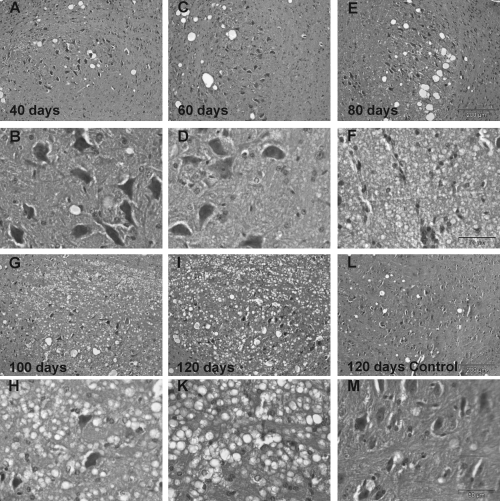
H&E-stained trigeminal nucleus (Nc. V) of G93A-SOD1 mice 40, 60, 80, 100 and 120 days after birth (A–K), and a control mouse 120 days after birth (L and M). First row (A, C, E): low magnification of Nc. V of G93A-SOD1 mice (scale bar: 200 µm) 40 (A), 60 (C) and 80 days (E) after birth. Second row (B, D, F): higher magnifications of slice (A), (C) and (E), respectively; at Day 80 (F) vacuolization, a sign of motor neuron degeneration in ALS, becomes visible (scale bar: 50 µm). Third row (G, I, L): low magnification of Nc. V of G93A-SOD1 mice at 100 (G) and 120 days (I) after birth, and of a control mouse at 120 days (L) after birth. Fourth row (H, K, M): higher magnification of (G), (I) and (L), respectively; in (H) and (K) vacuolization is obvious and the number of motor neurons is dramatically reduced.
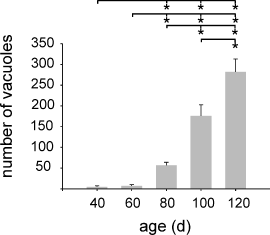
Number of vacuoles in an area of 17.5 mm2 of the trigeminal nucleus (Nc. V) of G93A-SOD1 mice (40, 60, 80, 100 and 120 days after birth, each group n = 5) increased significantly between Days 80 and 120. Values are expressed as mean ± SD. Significance level *P < 0.05.
To characterize the exploratory behaviour and locomotor activity, and to obtain behavioural correlates for our MR data, three different open-field tests were performed during the progression of the disease, yielding the parameters walked distance, number of rearings and move time, as shown in Fig. 5. Analysis of the behavioural data by non-parametric two-factorial anova revealed a significant interaction of the factors genetic background and animal age for the parameter walked distance (P = 0.044), while significant effects for move time and rearings were only found for genetic background (P = 0.048) and animal age (P = 0.002), respectively. Within the group G93A-SOD1 mice, post hoc test showed significant difference in the parameters walked distance between 40 and 100 days after birth (P = 0.007) and in the number of rearings between 40 and 100 (P = 0.003), between 40 and 120 (P = 0.006), and between 80 and 100 days after birth (P = 0.006); no significant difference between individual time points was found for the parameter move time. As before, post hoc comparisons within the group of age-matched control mice did not yield any significant difference between any two time points. Between G93A-SOD1 mice and age-matched controls no significant differences were found for any parameter, because of the large scattering of the behavioural data.
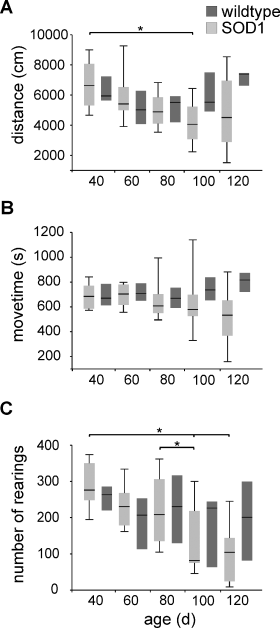
Results from open-field behavioural test for transgenic G93A-superoxide dismutase 1 (G93A-SOD1) mice (n = 12) and wild-type control mice (n = 7): (A) walked distance; (B) move time; and (C) number of rearings. Values are presented as median with quartiles (Q25 and Q75). Significance level: *P < 0.05.
To further analyse potential interactions between the group of parameters obtained from the MR methods or from either behavioural test, non-parametric (Spearman) correlation analyses were performed using all transgenic G93A-SOD1 animals for all five time points. Table 1 shows the corresponding results for the T2 values obtained in the brainstem nuclei Nc. V, VII, XII and the behavioural parameters walked distance, move time and number of rearings. Good correlations of high significance were found among the T2 values in all brainstem nuclei (rS = 0.919, P < 0.001) and among the behavioural data (rS = 0.677, P < 0.001). However, smaller correlation coefficients are calculated between the two groups of parameters, with number of rearings yielding the best correlation to the MR parameters (|rS| = 0.546, P < 0.001). In contrast to the number of rearings, walked distance and move time yielded only weaker − yet still significant − correlations with MR parameters (Table 1).
| Nucleus V | Nucleus VII | Nucleus XII | Distance | Move time | Number of rearings | |
|---|---|---|---|---|---|---|
| Nucleus V | ||||||
| rs | 1.000 | 0.935† | 0.933† | −0.314 | −0.283 | −0.546 |
| P-value | n/a | < 0.001† | < 0.001† | 0.015 | 0.030 | < 0.001 |
| Nucleus VII | ||||||
| rs | – | 1.000 | 0.919† | −0.368 | −0.351 | −0.588 |
| P-value | – | n/a | < 0.001† | 0.004 | 0.006 | < 0.001 |
| Nucleus XII | ||||||
| rs | – | – | 1.000 | −0.364 | −0.329 | −0.594 |
| P-value | – | – | n/a | 0.005 | 0.011 | < 0.001 |
| Distance | ||||||
| rs | – | – | – | 1.000 | 0.809† | 0.677† |
| P-value | – | – | – | n/a | < 0.001† | < 0.001† |
| Move time | ||||||
| rs | – | – | – | – | 1.000 | 0.769† |
| P-value | – | – | – | – | n/a | < 0.001† |
| Number of rearings | ||||||
| rs | – | – | – | – | – | 1.000 |
| P-value | – | – | – | – | – | n/a |
- † Correlations within either set of parameters (MR and behavioural). n/a, not applicable.
Discussion
ALS is characterized by a degeneration of motor neurons in the motor cortex, spinal cord and brainstem (Mulder et al., 1986; Brown, 1995; Shaw, 1999; Cleveland & Rothstein, 2001; Rowland & Shneider, 2001; Talbot, 2002). In our study, we used the MR parameter spin–spin relaxation time T2 to obtain a quantitative correlate for the degeneration of motor nuclei in the brainstem of G93A-SOD1 mice. As previously reported, an increase of T2 was found in Nc. V, VII and XII starting around Day 80 after birth (Angenstein et al., 2004; Zang et al., 2004; Niessen et al., 2006). In contrast to previous MR studies, a full set of age-matched control mice was used for each time point, and five time points were used to cover a larger range of the disease progression, i.e. from Day 40 to Day 120 after birth. For all three brainstem nuclei in the group of G93A-SOD1 mice, T2 values were significantly different for each time point (Fig. 2), allowing us to distinguish individual stages of the disease with respect to their T2 value when animals are clinically still unremarkable.
The increase in T2 relaxation time in the brainstem is usually explained with the appearance of vacuoles in place of motor neurons (Niessen et al., 2006). Vacuoles must be filled with liquid to achieve an increase of the T2 relaxation time. The vacuoles are often associated with degenerating mitochondria, which has been described for spinal motor neurons of G93A-SOD1 mice already in the early stages of the disease (Jaarsma et al., 2000). However, the underlying mechanisms for the vacuolization are still unclear but seem to be induced by the mutant SOD1 (Kong & Xu, 1998; Jaarsma et al., 2000; Higgins et al., 2003), which has been found in the inter-membrane space of the mitochondria (Mattiazzi et al., 2002).
The development of the vacuoles is shown in Fig. 3. Our results obtained by histology show that extensive vacuolization in brainstem nuclei starts at a similar time as the increase in T2 relaxation, suggesting that this increase is associated with the number of vacuoles.
In addition, for the very same animals used in the MR experiments behavioural data were obtained. Transgenic G93A-SOD1 mice showed a decrease in exploratory behaviour (walked distance) and locomotor activity (number of rearings) during the progression of the disease (group effects). Those behavioural changes were most likely observed because of an increasing loss of motor neurons in the brain and the spinal cord that eventually leads to a progressive muscle paralysis, while in most cases morphological change will precede behavioural changes. Unfortunately, no significant differences were found between the two animal groups for any time point. This lack of significant effects is most likely caused by the larger scattering in the behavioural data.
In summary, T2-weighted MRI enables a longitudinal non-invasive evaluation of motor brainstem degeneration during the progression of the disease in the G93A-SOD1 mouse model of ALS. Changes of the T2 values occur even before the first clinical symptoms appear and are associated with the vacuolization in the brainstem nuclei. Thus, MRI is a more suitable tool to monitor changes in the brainstem quantitatively than histology. In contrast to MR measurements, behavioural tests bare the problem of habituation, which may play an important role in our experiments. Therefore, MRI evaluates the symptoms of the disease more adequately.
Acknowledgements
We thank Tanja Wipp, Stephen Meier and Birgit Schwalenstoecker (University of Ulm) for their technical support, and Dr Carina Ittrich (Boehringer Ingelheim) for valuable advise concerning the statistical analysis of the data. The authors are also grateful to Renate Zienecker and Siglinde Hartwig (University of Ulm) for histological assistance.
Abbreviations
-
- ALS
-
- amyotrophic lateral sclerosis
-
- fALS
-
- familial amyotrophic lateral sclerosis
-
- H&E
-
- haematoxylin and eosin
-
- MRI
-
- magnetic resonance imaging
-
- Nc.
-
- nucleus
-
- Nv.
-
- nerve
-
- ROI
-
- region of interest
-
- SOD1
-
- superoxide dismutase 1.


