Coding of spatial information by soma and dendrite of pyramidal cells in the hippocampal CA1 of behaving rats
Abstract
The soma and dendrite of a single neuron differ markedly in their anatomical and chemical organization. However, the difference between the neuronal codes by the soma and dendrite in the brain of behaving animals remains unknown. Here, we show that in the hippocampal CA1 of behaving rats, the soma and dendrite of pyramidal cells code distinct spatial information. To detect these neuronal codes, we used a unique extracellular multiunit recording technique with special electrodes (dodecatrodes) and a novel spike-sorting system with an independent component analysis (ICSort). First, we examined whether ICSort could separate extracellular signals from the soma and those from the dendrite of a single cell, in comparison with the separation obtained by a conventional spike-sorting technique. The results suggest that ICSort could distinguish extracellular signals originating from the soma and dendrite. Second, we examined spatial information coded by signals from the soma and dendrite of hippocampal pyramidal cells when the rats were moving in a familiar open environment. The results indicate that the somatic units had single place fields, and showed higher spatial specificity, lower sparsity and lower firing rates than the dendritic units. Therefore, we conclude that a hippocampal pyramidal cell has the ability to transform redundant spatial information received from upstream neurons via the dendrite into more place-specific information along the dendrosomatic axis and transmit this information to downstream neurons via the soma.
Introduction
The substrate to be used for computation in neuronal networks has long been debated. In the 19th century, from the anatomical viewpoint, Cajal postulated that many dendrites of a neuron receive spikes from upstream neurons and transmit those activities to downstream neurons via the axon (Cajal, 1911). Recent in vitro studies using acute and cultured brain slice preparations (London & Hausser, 2005) and computational models (Koch, 1999) suggested that in the dendritic tree of a single cell, several linear and non-linear mechanisms may serve as computational units because there are passive as well as active, voltage-dependent membrane conductance, and that the soma/axon produces the final output as a whole. However, the difference between information coded by the soma and that coded by the dendrite of single cells in the working brain of behaving animals remains unknown.
Our knowledge on neuronal computations in the working brain of behaving animals almost exclusively comes from extracellular recordings (Hubel & Wiesel, 1977; Georgopoulos et al., 1986). Recently, using extracellular multisite tetrodes, a relationship between the soma-dendritic backpropagation and the experience-dependent plasticity of a single cell has been unveiled (Quirk et al., 2001) on the assumptions that activity-dependent attenuation in the amplitude of extracellular spikes could serve as the cause of the underlying intracellular changes (Henze et al., 2000), and that the extracellularly recorded signals are integrated from both the soma and the proximal dendrites of a cell (Buzsaki et al., 1996; Cohen & Miles, 2000). However, a detailed investigation of the signals from the soma and dendrite is difficult, because most conventional spike-sorting techniques cannot separate extracellularly recordable spikes generating almost simultaneously within a 1-ms range. This is referred to as ‘spike-overlapping problem’ (Gray et al., 1995; Lewicki, 1998), and is a serious problem because somatic spikes could backpropagate to the dendritic trees in a single cell (Stuart et al., 1997) and the waveforms overlap within a 1-ms range.
To solve the spike-overlapping problem and entirely separate the signal integrated from both the soma and the dendrite of a single cell, we have recently developed an innovative spike-sorting technique with an extension of independent component analysis (ICA; Hyvarinen, 1999) (ICSort; Takahashi et al., 2003a) and 12-channel multielectrodes (dodecatrodes; Takahashi & Sakurai, 2005). Our previous studies (Takahashi & Sakurai, 2005; Sakurai & Takahashi, 2006) have already demonstrated that ICSort with tetrodes or dodecatrodes is capable of separating signals integrated from the soma and dendrite of a single cell as well as signals integrated from closely neighboring single cells.
Here, to reveal the neuronal coding in a single cell along the dendrosomatic axis in the brain of behaving animals, we focus on pyramidal cells in the hippocampal CA1 of freely moving rats and their typical task-related activity, i.e. place-specific firings. Then, in comparison with the results obtained by a conventional spike-sorting technique and ICSort with dodecatrodes, we examine the distinct coding of spatial information by the soma and dendrite of single cells in terms of discharge properties and place-specific firing patterns.
Materials and methods
Animals, apparatus and behavioral task
Six male Wistar rats were extensively handled, and then food deprived to approximately 80–90% of their ad libitum body weight. Lights were on in the colony room between 08.00 h and 21.00 h, and experiments were conducted between 09.00 h and 18.00 h. All experimental procedures were in accordance with National Institutes of Health and Kyoto University guidelines and were conducted with the approval of the Animal Research Committee, Kyoto University.
The rats were trained in a chamber (60 × 55 cm2, 40 cm in height) placed in a shielded box. One of the walls was partly covered with a white board (14 × 10 cm2). The box was sound-attenuating and illuminated by a small bulb mounted on one of the walls. The behavioral task was to forage small food pellets (25 mg) that were distributed by an automatic dispenser installed on one of the upper corners of the chamber. Each pellet was delivered on the floor every 10–20 s for 15–20 min during which neuronal activity was recorded. The rats walked to retrieve the pellets during the pellet delivery period and roamed almost all areas of the floor.
Preparation and recordings
The rats were implanted with three to five independent movable dodecatrodes in their dorsal hippocampus (3–4 mm posterior to the bregma, 1.5–3.5 mm from the midline). The dodecatrodes consisted of bundles of 12 insulated tungsten wires (8 µm in diameter; California fine wire, CA, USA) twisted together and gently heated to fuse the insulation without short-circuiting the wires. The final overall diameter was approximately 70 µm. The tips of the dodecatrode were cut and the impedance was approximately 1 MΩ measured at 1 kHz. The dodecatrodes were lowered to the CA1 layer and individually positioned to obtain unit isolation. To stabilize the recording condition and minimize the electrode drift, the maximum range for the movement of the dodecatrode was maintained at 100 µm per day. This minimized the pressure and the movement of the brain tissue due to the lowering of the dodecatrode. We recorded neuronal data only when we had confirmed that the distributions of spike amplitude across channels were constant. One tetrode was implanted and served as a reference electrode outside of the CA1 layer for differential recordings. Eight anchor screws were implanted on the skull. The entire implant was encased in dental acrylic. Multi-unit activities were amplified and filtered (band-pass range of 500 Hz−10 kHz) and recorded at 20 kHz on a custom-made PC with three 24-channel A/D converters (16 bit resolution; Contec, Osaka, Japan). Three light-emitting diodes (LEDs) were attached to the head stage to track the position of the animal by a video camera that was placed directly above the ceiling of the shielded box and recorded with a sampling frequency of 30 Hz. One recording session lasted for 15–20 min, during which pellets were delivered while the rats were walking on the floor. As all of the three–five dodecatrodes were seldom positioned at the CA1 pyramidal cell layer simultaneously, data for analysis were collected from two or more recording sessions per rat.
Spike-sorting
The standard deviation of neuronal signals was calculated to estimate the baseline noise and to establish a spike-detection threshold. Spikes > five times the standard deviation were extracted. Therefore, in some data sets a few noisy channels of the dodecatrode were not used for the following analyses. Spike-sorting was performed offline using two automatic sorting software: KlustaKwik (http://klustakwik.sourceforge.net/) and ICSort (Takahashi et al., 2003a,b).
The resulting classification based on the first, second and third principal components' feature vectors of all extracted spikes (Abeles & Goldstein, 1977) by KlustaKwik was corrected and refined manually on the basis of auto- and cross-correlograms between all possible pairs of units recorded from one electrode (Harris et al., 2000).
On the other hand, ICSort completed two steps: clustering and separation. First, in the clustering step, using KlustaKwik, ICSort automatically sorted the first, second and third principal components' feature vectors of all extracted spikes in the high-dimensional clustering space. Then, the extracted spike waveforms in each sorted cluster were concatenated. Second, in the separation step, ICSort used ICA to find spatial filters that separate the spike waveforms into spatially fixed and distinct, maximally independent components. The simple assumption underlying ICA is that the components are statistically independent and have non-Gaussian distributions. Simply, a matrix X denoting a multiunit activity recorded by a dodecatrode can be formulated as an equation, that is, X = A × S, where a mixing matrix A indicates relative distances between the tips of the electrode and the source of a single cell, and a matrix S represents the single-unit activities. ICA estimated the mixing matrix A from multiunit recordings X, and then using an unmixing matrix (W: pseudoinverse matrix of A), ICA obtained the independent components (S: single-unit activities) by the equation: W × X. To find the sources of the single-unit activity S, ICSort applied ICA to each concatenated spike waveform using a symmetric FastICA algorithm (Hyvarinen, 1999), which is a fixed-point algorithm that maximizes an approximation of negentropy as a measure of non-Gaussianity. ICSort used the contrast function g(u) = u3 to identify non-Gaussian components. Because the FastICA relies on random initializations for its maximization of non-Gaussianity, it will produce slightly different results each time it is applied. To compensate for this instability, ICSort iterated the FastICA 10 times using Icasso software (Himberg et al., 2003). The final components were estimated as the centrotypes of the iterated estimates of each component and evaluated using the Iq index. The FastICA linearly decomposes each concatenated spike waveform into N maximally independent components (ICs), each characterized by a different, fixed map (i.e. a column of the mixing matrix A), showing the spatial projection of the component to each channel of an electrode, and a time course of activity. N indicates the number of channels in one electrode. Thus, if KlustaKwik detects M units, the FastICA normally obtains N × M ICs. However, each IC could indicate a neuronal activity, noise or an artifact. To determine which ICs were indicative of neuronal activity, we extracted spikes > five times the standard deviation from each IC and checked whether there is a clear refractory period in the interspike interval (ISI) histogram. Because each IC may contain overlapping spikes, i.e. spikes simultaneously fired from neighboring units, spikes generated from a single unit may be distributed across some clusters and ICs. Finally, ICSort aggregated these distributed ICs to single units on the basis of each ICA basis vector (each column of the mixing matrix A) that represents the relative relationship of the distance between the source of the IC and the tips of the electrode. Because a separated spike waveform in each IC may be shifted from the original, overlapped spike waveform, the time-stamps of the spikes in each IC were reassigned by remapping each IC onto real extracellular spaces using the equation: R = a × s. R denotes a matrix of the remapped waveforms of an IC, a denotes an ICA basis vector corresponding to the IC, and s denotes a vector of the IC. The results obtained by ICSort are shown in 1, 3, and details were described previously (Takahashi et al., 2003a,b).
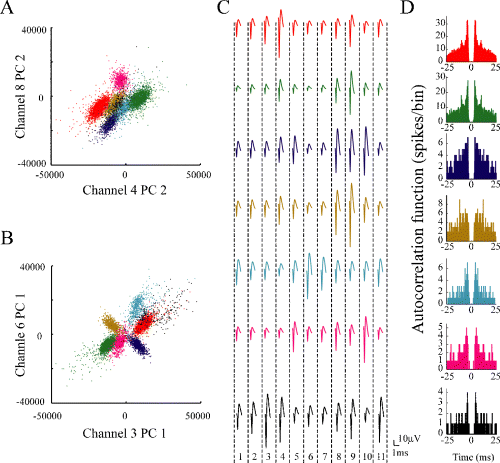
Example of single units detected by ICSort with dodecatrode. This recording was made for 15 min while the rat was foraging food pellets in a familiar open field. (A and B) Scatter plots on two different feature spaces for sample data set. The separated seven units (clusters) are shown in different colors. (C) The averaged spike waveforms on each channel (microwires 1–11) of the dodecatrode for each unit are shown because one channel was not used for the spike-sorting due to noise (see Materials and methods). (D) Corresponding autocorrelation functions with window of ± 25 ms. The bin size is 0.1 ms.
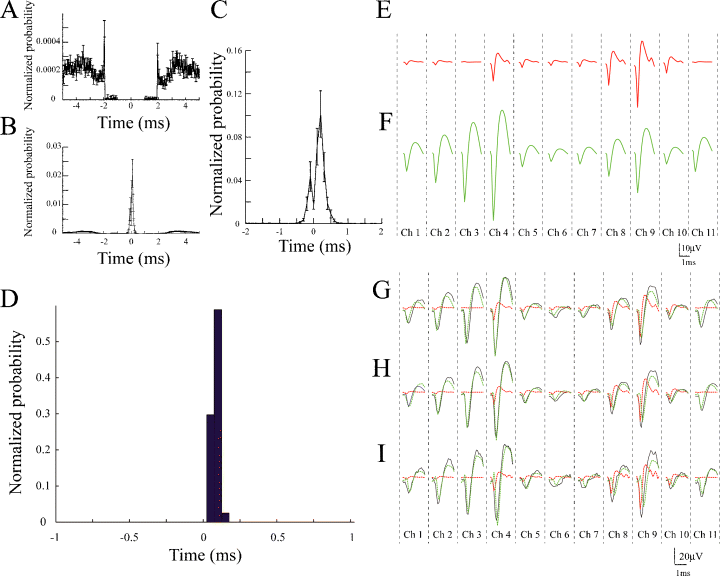
Temporal correlations between Type I and Type II units, and between Type III and Type IV units. (A) Average cross-correlogram between all possible pairs of Type I and Type II units. Error bars show SEM. The bin size is 0.1 ms. The Type II units are used as a reference. Note that there is a suspicious trough from ∼−2 ms to ∼+2 ms due to the spike-overlapping problem. (B) Averaged cross-correlogram between all possible pairs of Type III and Type IV units. Error bars show SEM. The bin size is 0.1 ms. The Type IV units are used as a reference. Note that large, sharp peaks around zero delay can be observed. (C) Expanded averaged cross-correlogram of (B). Error bars show SEM. The bin size is 0.05 ms. Note that the sharp peaks are skewed to the positive side (skewness: 3.0). (D) Example of cross-correlogram between Type IV and Type III units. The bin size is 0.05 ms. The Type IV unit is used as a reference. Note that three remarkable peaks are observed on the positive side (+0.05 ms, +0.10 ms, +0.15 ms). (E) Averaged spike waveforms of Type IV unit shown in (D) on each channel (microwires 1–11) of dodecatrode (P-value: 0.38; see Materials and methods). (F) Averaged spike waveform of Type III unit shown in (D) on each channel (microwires 1–11) of dodecatrode (P-value: 0.0097; see Materials and methods). (G–I) Averaged raw spike waveforms (black) and averaged spike waveforms of Type IV (red) and Type III (green) units on each channel (microwires 1–11) of dodecatrode at the three peaks (G: +0.05 ms; H: +0.10 ms; I: +0.15 ms) of the cross-correlogram shown in (D).
Quality of analysed cells
We used spike trains only from units that show clear refractory periods (1–2 ms), high signal-to-noise ratio (> five times the noise level) and sufficient firing rate (≥ 0.1 Hz) (Takahashi et al., 2003a; Takahashi & Sakurai, 2005). In addition, we only considered units with high isolation quality indices (isolation distance > 20 and L-ratio < 0.5; Schmitzer-Torbert et al., 2005) because units having a poor isolation quality lead to false conclusions (Maurer et al., 2006).
To calculate isolation distance and L-ratio, we used the energy and first principal component calculated for each spike waveform recorded on each channel of a dodecatrode.

 of the i-th spike from the centre of cluster C is defined by:


 is the cumulative distribution function of the χ2 distribution with d.f., which is equal to the number of channels (microwires) multiplied by two (the number of the energy and first principal component). The L-ratio indicates an estimate of the likelihood that spikes near the outer edge of the cluster should be included in the cluster. Thus, a high L-ratio indicates that the cluster is not well separated. These two cluster quality indices have been justified as robust estimates of cluster quality on cells in simultaneous intra- and extracellular measurements (Schmitzer-Torbert et al., 2005).
This qualification was performed after spike-sorting using ICSort, which is capable of separating overlapping spikes. Therefore, it was not possible that units that were unanalysed due to their low firing rate (< 0.1 Hz) were composed of a superposition of spikes generated from more than two analysed units.
Attenuation in spike amplitude during bursts
To detect significant spike amplitude attenuations during bursts, we tested the amount of attenuation within a burst against that within a non-burst. Burst firings were defined as two or more consecutive spikes whose ISI is ≤ 6 ms and were isolated from the spike trains for each pyramidal cell. The ISI range of burst firings of pyramidal cells is typically 3–10 ms (Ranck, 1973). Moreover, a previous study (Harris et al., 2001) suggested that the probability of burst initiation is largest after the long periods of silence (100 ms to 1s). Thus, non-burst firings were defined as two or more consecutive spikes whose ISI range is 20–100 ms. For each burst, the amount of attenuation within a burst was determined by dividing the amplitude of the last spike in the burst by the amplitude of the first spike. To compare the amount of attenuation within a burst, we also calculated the amount of attenuation for non-bursts by dividing the amplitude of the last spike in the non-burst by the amplitude of the first spike. The number of non-burst events corresponded to that of burst events. We checked whether the amount of attenuation within a burst is smaller than that within a non-burst in a given neuron by Mann–Whitney U-test. Alpha was set at 0.01.
Cross-correlogram
We used cross-correlation analysis (Perkel et al., 1967) to reveal functional connections among the soma and dendrite of a single cell. We calculated the number of instances in which the firing of a somatic unit is followed by the firing of a dendritic unit. To normalize the instances, the histogram was divided by the number of all firings of the somatic unit for a session. This analysis was carried out on all possible pairs of the somatic and dendritic units detected from each dodecatrode, and gave a set of cross-correlograms.
First- and last-spike amplitudes
As described above, burst firings were defined as two or more consecutive spikes whose ISI is ≤ 6 ms and were isolated from the spike trains for each pyramidal cell. Because of the use of 12-channel dodecatrodes, 12 waveforms were maximally assigned to one spike; one of the channels indicating a maximum amplitude (the difference between maximum and minimum voltages) for a recording session was selected for each cell. The first- and last-spike amplitudes were calculated as the amplitudes on one selected channel of the first and last spikes within a burst, respectively.
Place fields

A place field was defined according to the criteria of a group of adjoining bins with the average firing rate of each bin exceeding a specified threshold (Muller et al., 1987). For this study, the minimal number of adjacent bins was set at four, and the threshold was set at a fivefold standard deviation above the mean firing rate for the entire environment (Thompson & Best, 1989). The number of place fields for a given neuron was taken as the number of non-contiguous individual fields whose maximum firing rate was above 1 Hz (Jung et al., 1994). The size of a place field was defined as the number of bins in a place field.


 and p(x) is the probability density for the rat being at location x (occupancy time at location x divided by the total recording time).
SIC is a measure of how much information on spatial location is conveyed by a single spike of a given cell. SIC is an adequate measure of place specificity (sharpness). If the unit fires in one-quarter of the environment, a spike conveys two bits of SIC. SIR is a measure of the amount of spatial information conveyed by the firing rate of a single cell. This information represents how each cell robustly fires over a broad region. Therefore, SIR is the opposite of SIC. Sparsity is a measure of how diffuse the unit firing is in the spatial domain. For example, if a unit fires equally all over the field, the sparsity is 1. For SIC, the effect of small-sample bias must be considered (Jung et al., 1994; Markus et al., 1994). Empirically, at least 50 spikes in a sample are required (Jung et al., 1994). As in our analysed data sets, the minimum number of spikes in a unit was 109; to recompare SIC between units, we made 100 random subsets whose number of spikes is set at 100 for all units. All analyses were performed using custom-written MATLAB and C++ software.
Results
We applied the conventional KlustaKwik and ICSort to identical data sets recorded by dodecatrodes. Figure 1 shows a typical example of seven units detected from one dodecatrode using ICSort. The averaged spike waveforms of each unit showed a different amplitude distribution across channels (Fig. 1C). In addition, the principal components' feature vectors of each unit indicated a clear distinct cluster in two different 2D feature spaces even if the shape is a non-spherical, elliptic form (Fig. 1A and B). The isolation quality of units detected using ICSort can be assessed in high-dimensional feature spaces using the quality measures (isolation distance and L-ratio) usually employed in conventional spike-sorting techniques. For these seven units, the isolation distance and L-ratio showed high-quality values, respectively [Unit 1 (red): 98 and 0.16; Unit 2 (green): 169 and 0.016; Unit 3 (blue): 74 and 0.0073; Unit 4 (brown): 333 and 2.3 × 10⁻⁶; Unit 5 (cyan): 163 and 0.0016; Unit 6 (magenta): 333 and 3.0 × 10⁻⁵; and Unit 7 (black): 88 and 0.0098]. Each corresponding autocorrelation function indicated a clear refractory period (1–2 ms; Fig. 1D). These results demonstrated that the units sorted using ICSort were single cells even from the measures of the conventional spike-sorting technique.
As mentioned above in the Introduction, conventional spike-sorting techniques have the spike-overlapping problem. Therefore, to examine the distinct neuronal codes of the soma and dendrite of single cells, we used ICSort aside from the conventional spike-sorting technique. Using KlustaKwik and ICSort, we detected 217 and 277 units from the hippocampal CA1 of freely moving rats in a familiar open environment, respectively. The average numbers of units per dodecatrode were 4.3 (KlustaKwik) and 7.0 (ICSort).
Physiological identification of pyramidal cells and interneurons
We physiologically identified pyramidal cells and interneurons on the basis of the following two criteria frequently used in extracellular recordings: firing rate and spike duration (Ranck, 1973). Figure 2A shows a 3D scatter plot of the firing rate, spike duration and average first moment of the autocorrelogram within a window of ± 50 ms for all units detected using KlustaKwik. In the plot, there are two clusters of cells. Thus, pyramidal cells were defined as having a low firing rate (< 5 Hz) and a wide spike duration (measured from maximum to minimum voltage; > 0.2 ms). On the other hand, interneurons were defined as having a high firing rate (> 5 Hz) and a narrow spike duration (< 0.2 ms). In these data sets, pyramidal cells typically produce complex spike bursts of two–seven spikes at 3–10 ms ISIs, as reported previously (Ranck, 1973). Thus, the average first moment of the autocorrelogram within a window of ± 50 ms was used as a supportive criterion (Csicsvari et al., 1998). Using KlustaKwik, 208 and 9 units were identified as pyramidal cells and interneurons, respectively. Similarly, all units detected from identical data sets using ICSort produced two clusters in a scatter plot (Fig. 2B), which can be divided on the basis of the identical criteria. Using ICSort, 268 and 9 units were identified as pyramidal cells and interneurons, respectively.
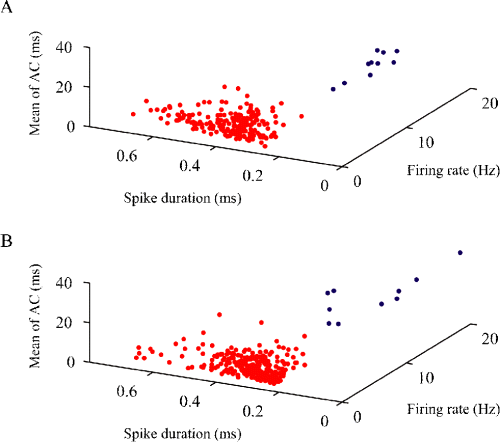
Physiological identification of pyramidal cells and interneurons. (A and B) Three-dimensional scatter plots of firing rate, spike duration and average first moment of autocorrelogram with window of ± 50 ms (mean of autocorrelogram) for each unit detected using KlustaKwik (A) and ICSort (B). Note that in both plots, clusters of pyramidal cells (red) and interneurons (blue) are clearly separated. AC, autocorrelogram.
Physiological identification of units on the basis of magnitude of attenuation in spike amplitude within bursts
Some in vitro studies of the dendrites of pyramidal cells (Stuart et al., 1997, 1999) have suggested that, in contrast to somatic spikes (spikes originating from the soma), dendritic spikes (spikes originating from the dendrite) show significant activity-dependent attenuation in spike amplitude within a burst. We tested the significance of the amount of attenuation in spike amplitude within a burst against that within a non-burst in a single unit (see Materials and methods). In the detected units using KlustaKwik and ICSort, approximately 45% (94/208) and 27% (72/268) of the overall pyramidal cells show significant attenuation in spike amplitude within a burst, respectively, whereas only 11% (1/9) and 0% (0/9) of the overall interneurons show significant attenuation in spike amplitude within a burst, respectively. To investigate the difference between information coded by the soma and that coded by the dendrite of single cells, a sufficient number of units were required. Therefore, we focused on pyramidal cells in the following analyses.
In this study, we divided pyramidal units into four types. With regard to units detected using KlustaKwik, pyramidal units showing significant attenuation in spike amplitude within a burst were defined as Type I. The other units were defined as Type II. With regard to units detected using ICSort, pyramidal units showing significant attenuation in spike amplitude within a burst were defined as Type III. The other units were defined as Type IV.
Temporal correlations between Type I and Type II units, and between Type III and Type IV units
To check whether the backpropagating spikes from the soma to the dendrite of a single cell can be examined using the conventional and ICSort spike-sorting techniques, we calculated cross-correlograms between all possible pairs of units recorded from one electrode and examined the position of the peaks in the cross-correlograms. As mentioned in the Introduction, KlustaKwik has a spike-overlapping problem; an averaged cross-correlogram between all possible pairs of the Type I and Type II units detected from one electrode using KlustaKwik, within a window of ± 5 ms, showed suspicious troughs around zero delay (the reference unit is Type II; Fig. 3A). In contrast, because ICSort can separate overlapping spikes, an averaged cross-correlogram between all possible pairs of the Type III and Type IV units detected from one electrode using ICSort showed large, sharp peaks with an approximately +0.1-ms delay and small peaks with an approximately −0.1-ms delay (the reference unit is Type IV; Fig. 3B). Typically, there were large peaks only on the positive side (skewness: 3.0; Fig. 3C). Figure 3D shows a typical pair of the Type III and Type IV units showing unidirectional connections within a 0.2-ms range. Note that the delay of spike timings between the Type III (blue) and Type IV (red) units led to the formation of irregular shapes of the original, raw spike waveforms (black; Fig. 3G–I). ICSort can separate such overlapping spikes by maximizing an approximation of negentropy of neuronal signals as a measure of non-Gaussianity using the FastICA (Hyvarinen, 1999; see Materials and methods).
First- and last-spike amplitudes within bursts of Types I–IV units
Extracellular signals may be integrated from both the soma and the dendrite. In addition, in contrast to somatic spikes, dendritic spikes show significant activity-dependent attenuation within a burst. Thus, the effect of the spike amplitude integrated from the soma and dendrite of a single cell would prominently appear on the first-spike amplitude within a burst. We compared the first-spike amplitude within a burst between the Type I and Type II units, and between the Type III and Type IV units. As a consequence, the first-spike amplitude within a burst of the Type I units was significantly larger than that of the Type II units (Mann–Whitney U-test, P < 10−5; Fig. 4A; Table 1). In contrast, there was no significant difference between the first-spike amplitude within a burst of the Type III and Type IV units (Mann–Whitney U-test, P > 0.05; Fig. 4B; Table 1).
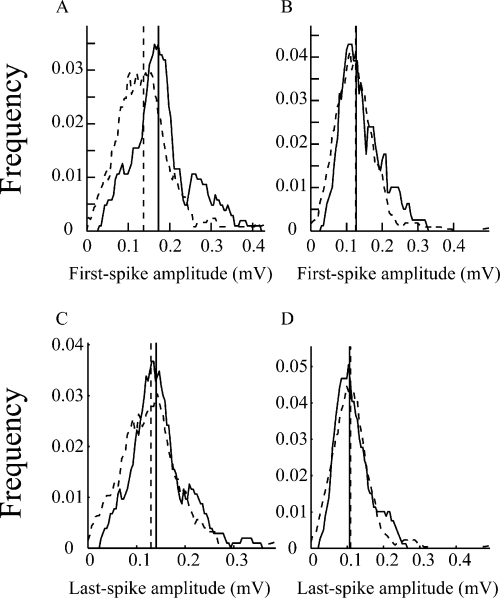
Smoothed frequency distributions of mean amplitudes (measured from maximum to minimum voltages) of first and last spikes within bursts of Type I (A and C; solid line), Type II (A and C; dotted line), Type III (B and D; solid line) and Type IV (B and D; dotted line) units. The vertical lines are medians. With regard to the first-spike amplitude, in contrast to the difference between the Type III and Type IV units, there was a significant difference between the Type I and Type II units.
| Pyr(KlustaKwik) | Pyr(ICSort) | |||
|---|---|---|---|---|
| Type I units | Type II units | Type III units | Type IV units | |
| Number of units | 94 | 114 | 72 | 196 |
| First-spike amplitude (µV) | 183 ± 7 | 141 ± 6* | 146 ± 7 | 130 ± 4 |
| Last-spike amplitude (µV) | 149 ± 6 | 129 ± 5 | 118 ± 5 | 115 ± 4 |
| Number of units with place fields | 61 (65%) | 73 (64%) | 44 (61%) | 150 (77%)* |
| Number of place fields per unit | 0.7 ± 0.1 | 0.8 ± 0.1 | 0.6 ± 0.1 | 0.9 ± 0.1* |
| Size of place fields (bins) | 36.3 ± 2.9 | 25.8 ± 1.8* | 36.0 ± 3.7 | 32.0 ± 1.4 |
| Firing rate (Hz) | 2.1 ± 0.1 | 1.6 ± 0.1* | 1.9 ± 0.1 | 1.0 ± 0.1* |
| SIC (bits/spike) | 0.43 ± 0.04 | 0.41 ± 0.04 | 0.41 ± 0.04 | 0.59 ± 0.04* |
| SIR (bits/s) | 0.68 ± 0.05 | 0.53 ± 0.05* | 0.55 ± 0.05 | 0.39 ± 0.02* |
| Sparsity | 0.65 ± 0.02 | 0.65 ± 0.02 | 0.65 ± 0.02 | 0.57 ± 0.02* |
| SIC2 (bits/spike) | 0.61 ± 0.01 | 0.59 ± 0.01* | 0.59 ± 0.01 | 0.75 ± 0.01* |
- Data are expressed as mean ± SEM. Pyr(KlustaKwik): pyramidal units detected using KlustaKwik with manual adjustment; Pyr(ICSort): pyramidal units detected using ICSort. *Indicates significant difference between Type I and Type II units, or between Type III and Type IV units. SIC2 indicates the SIC measure recalculated from 100 random subsets of each unit. SIC, spatial information content; SIR, spatial information rate.
To examine the possibility that burst activities in the analysed units affect the identification of unit types, we have analysed last-spike amplitudes within bursts to compare attenuated spike amplitudes with non-attenuated spike amplitudes. We compared the last-spike amplitude within bursts between the Type I and Type II units, and between the Type III and Type IV units. The result shows that the last-spike amplitude within the bursts of the Type I units was slightly larger than that of the Type II units (Mann–Whitney U-test, P > 0.02; Fig. 4C; Table 1). There was no significant difference in the last-spike amplitude within bursts between the Type III and Type IV units (Mann–Whitney U-test, P > 0.5; Fig. 4D; Table 1).
Time course of changes in amplitude attenuation
A previous study (Quirk et al., 2001) suggested that the reduction of activity-dependent attenuation in spike amplitude within a burst is experience dependent during traversing between the ends of a linear track. We checked this phenomenon by constructing averaged time courses of attenuation in amplitude within a burst of each type of unit pooled across all our data sets. In contrast to the previous study (Quirk et al., 2001), there was no significant change in the averaged attenuation in spike amplitude within a burst for both Type I (solid line) and Type III (dotted line) units over the 10-min period (Type I: F = 0.07, P > 0.9; Type III: F = 0.23, P > 0.9; anova; Fig. 5).
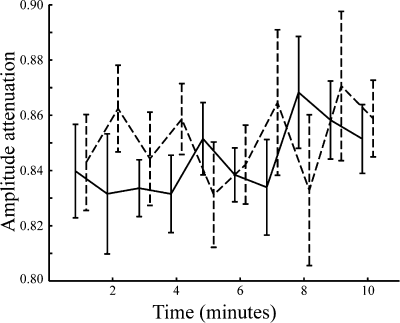
Time courses of changes in amplitude attenuation within bursts during behavior. The average (± SEM) amplitude attenuations within the bursts of Type I (solid line) and Type III (dotted line) units as a function of the time when the rats stayed in their environment are shown.
Firing rate of Types I–IV units
Some in vitro and in vivo experiments (Golding & Spruston, 1998; Kamondi et al., 1998) suggested that not all dendritic spikes produce somatic action potentials. To check this phenomenon, we compared the firing rates between the Type I and Type II units, and between the Type III and Type IV units, respectively. The results suggested that the firing rates of the Type I units were significantly higher than those of the Type II units (Mann–Whitney U-test, P < 0.01; Fig. 6A; Table 1). Similarly, the firing rates of the Type III units were markedly higher than those of the Type IV units (Mann–Whitney U-test, P < 10−5; Fig. 6B; Table 1).
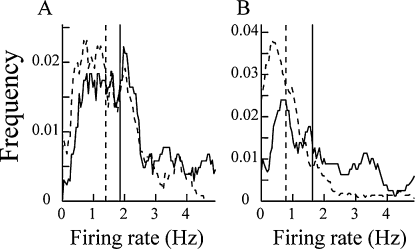
Smoothed frequency distributions of mean firing rates of Type I (A; solid line), Type II (A; dotted line), Type III (B; solid line) and Type IV (B; dotted line) units. The vertical lines are medians. There were significant differences between the Type I and Type II units, and between the Type III and Type IV units.
Place fields and spatial information coded by Types I–IV units
As previously reported (O'Keefe & Dostrovsky, 1971; Wilson & McNaughton, 1993), most of the pyramidal units detected using KlustaKwik and ICSort preferentially fired as the rat occupied certain locations in the field (place fields; 7, 8). The proportion of the Type I units having place fields was similar to that of the Type II units, whereas the proportion of the Type III units having place fields was smaller than that of the Type IV units (χ2 test, χ2 = 6.26, d.f. = 1, P < 0.05; Table 1). Most of the units had only one place field. Although the units indicated sufficient and good isolation qualities (see Materials and methods), seven of 94 (7%) Type I units, 17 of 114 (15%) Type II units, one of 72 (1%) Type III units and 23 of 196 (12%) Type IV units had two or three place fields. There was no significant difference between the average number of place fields per unit of the Type I and Type II units (Mann–Whitney U-test, P > 0.5), whereas the Type IV units significantly had more place fields than the Type III units (Mann–Whitney U-test, P < 0.01; Table 1). The average size of the place fields of the Type I units was larger than that of the Type II units (Mann–Whitney U-test, P < 0.01), whereas there was no significant difference in the average size of the place fields between the Type III and Type IV units (Mann–Whitney U-test, P > 0.3; Table 1).
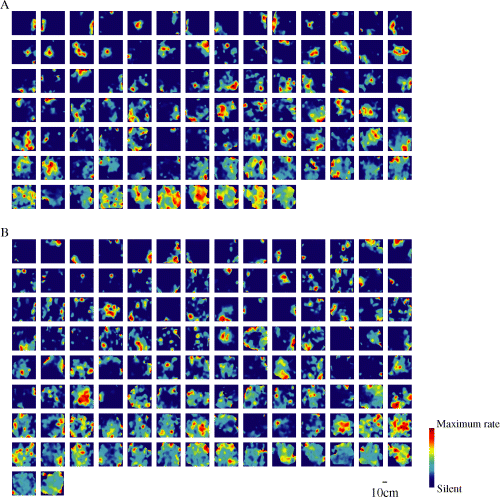
Spatial firing maps (place maps) of 94 Type I (A) and 114 Type II (B) units. Each panel represents the spatial distribution of the firing for one unit in the open field. The scale bar at the bottom shows 10 cm. As shown in the color scale bar on the bottom right side, red indicates maximal firing rates, which are different for each unit, and dark blue indicates no firing. In (A) and (B), the units are arranged depending on their SIC in the descending order (from left to right, top to bottom).
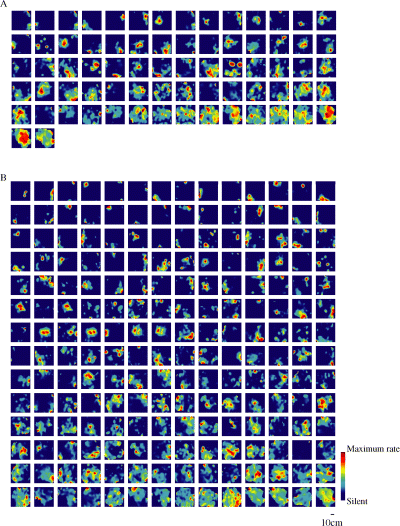
Spatial firing maps (place maps) of 72 Type III (A) and 196 Type IV (B) units. All parameters are the same as those shown in Fig. 7.
To examine information coded by the four types of pyramidal units, we checked three types of spatial information, namely, SIC, SIR and sparsity, in the familiar open environment (see Materials and methods). The SIC of the Type I units was similar to that of the Type II units (Mann–Whitney U-test, P > 0.4; Fig. 9A; Table 1). The sparsity of the Type I units was also similar to that of the Type II units (Mann–Whitney U-test, P > 0.7; Fig. 9B; Table 1). However, the SIR of the Type I units was significantly higher than that of the Type II units (Mann–Whitney U-test, P < 0.01; Fig. 9C; Table 1). In contrast to the units detected using KlustaKwik, the SIC of the Type III units was slightly lower than that of the Type IV units (Mann–Whitney U-test, P < 0.05; Fig. 9E; Table 1). The sparsity of the Type III units was significantly higher than that of the Type IV units (Mann–Whitney U-test, P < 0.01; Fig. 9F; Table 1). Similar to the units detected using KlustaKwik, the SIR of the Type III units was significantly higher than that of the Type IV units (Mann–Whitney U-test, P < 0.01; Fig. 9G; Table 1).
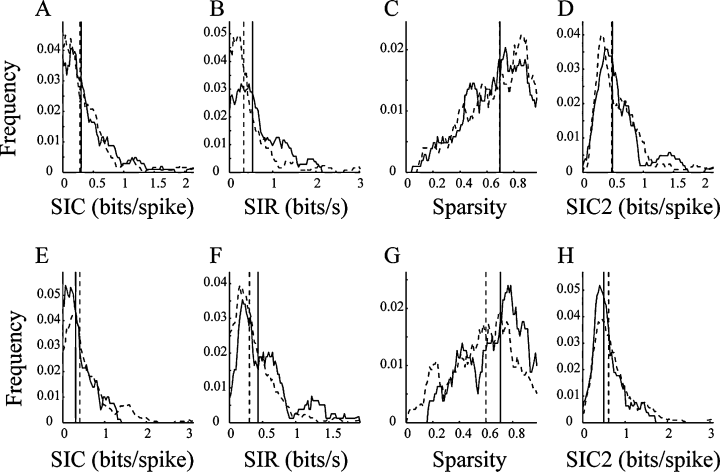
Smoothed frequency distributions of spatial information content (SIC), spatial information rate (SIR), sparsity and SIC of random subsets (SIC2) of Type I (A–D; solid line), Type II (A–D; dotted line), Type III (E–H; solid line) and Type IV (E–H; dotted line) units. The vertical lines are medians. There were significant differences only for (B) SIR and (D) SIC2 between the Type I and Type II units, whereas there were significant differences for (E) SIC, (F) SIR, (G) sparsity and (H) SIC2 between the Type III and Type IV units.
According to several previous reports (Jung et al., 1994; Markus et al., 1994; Harris et al., 2001), the SIC may be affected by the low firing rates. To compensate for the possibility of sampling bias for units with low firing rates, we randomly selected 100 spikes from each unit and randomly shifted the spike sequence in time from the rat location time series (see Materials and methods). We constructed 100 such random subsets for each unit, and then calculated SIC to retest the difference. As a consequence, the SIC of the Type I units was significantly higher than that of the Type II units (Mann–Whitney U-test, P < 10−6; Fig. 9D; Table 1). Similar to the results described above, the SIC of the Type III units was markedly lower than that of the Type IV units (Mann–Whitney U-test, P < 10−90; Fig. 9H; Table 1).
Discussion
Physiological identification of units by extracellular recordings
We identified pyramidal cells and interneurons on the basis of frequently used parameters (firing rate, spike duration and burstness; Ranck, 1973; Csicsvari et al., 1998). Furthermore, to divide pyramidal cells into units predominantly originating from the soma and the dendrite, we identified those units on the basis of significant attenuation in spike amplitude within a burst, because some in vitro studies (Stuart et al., 1997, 1999; Hausser et al., 2000) suggested that the dendritic spikes of a pyramidal cell show significant amplitude attenuation within a burst, and the simultaneous intra- and extracellular measurements in a previous study (Henze et al., 2000) suggested that extracellular signals can be approximated by the first deviation of the intracellular measurement. In our data sets, some of the pyramidal cells showed significant attenuation in amplitude within a burst, whereas, similar to the other previous studies (Ranck, 1973; Csicsvari et al., 1998), interneurons rarely showed the attenuation. Because an in vitro study (Martina et al., 2000) suggested that spikes originating from the dendrite of an interneuron do not show significant attenuation in amplitude within a burst, it is difficult to physiologically identify the soma and dendrite of an interneuron using only extracellular recordings. Hence, we analysed only pyramidal cells and divided these cells into two types for different units detected using either KlustaKwik or ICSort.
ICSort separates signals integrated from the soma and dendrite of a cell
Recently, several studies have suggested that somatic spikes can backpropagate to the dendritic tree, and that dendrites are capable of generating spikes mediated by voltage-gated Na+ and/or Ca2+ channels (Stuart et al., 1997; Svoboda et al., 1997; Golding & Spruston, 1998; Kamondi et al., 1998; Hausser et al., 2000). In addition, some lines of evidence obtained from multiunit recordings (Buzsaki et al., 1996; Cohen & Miles, 2000) and field potential recordings (Buzsaki & Kandel, 1998) support the view that extracellularly recorded signals may be integrated from both the soma and proximal dendrites of a cell. From these viewpoints, the degree of the mixture of spikes originating from both the soma and the proximal dendrites depends on the position where the tips of the electrode are placed along the soma-dendritic axis (Buzsaki et al., 1996). On the other hand, some in vitro and in vivo studies of the dendrites of pyramidal cells (Buzsaki et al., 1996; Stuart et al., 1997, 1999; Kamondi et al., 1998) suggested that, in contrast to somatic spikes, dendritic spikes show significant activity-dependent attenuation in spike amplitude within a burst. Moreover, in our analysis burst activities did not affect the classification of units as determined on the basis of the significance of spike amplitude attenuation within a burst because the attenuated spike amplitude within the bursts of the Type I and Type III units was not markedly different from the non-attenuated spike amplitude within the bursts of the Type II and Type IV units, respectively. Therefore, if the tips of the electrode are placed far from the soma, the integration weight of dendritic spikes is large, causing a significant attenuation in spike amplitude within a burst.
With regard to the units detected using KlustaKwik, the recorded spikes may be a mixture of the somatic and dendritic spikes of a single cell when the somatic spikes backpropagate to the dendritic tree. A significant attenuation in amplitude would appear if the effects of the dendritic spikes are more prominent than those of the somatic spikes and vice versa. On the other hand, with regard to the units detected using ICSort, the mixture of the somatic and dendritic spikes would be separated even if there are soma-dendritic backpropagations. In this study, we found two observations to support such hypotheses. First, the first-spike amplitude of the bursts of the Type I units was significantly larger than that of the Type II units, whereas there was no significant difference between the first-spike amplitude of the bursts of the Type III and Type IV units, suggesting that there was an integration of the somatic and dendritic spikes in the raw extracellular recordings. Second, cross-correlograms between units detected from one electrode using ICSort preferentially showed unidirectional connections from the Type IV units to the Type III units with a high probability, suggesting that soma-dendritic backpropagations in a single cell exist in the extracellular recordings. However, although the cluster quality measures of all analysed units show a high quality, it cannot be completely guaranteed that the Type III units were not contaminated with the Type IV units simultaneously monitored from the identical dodecatrode. Therefore, we conclude that the Type I units predominantly originated from both the soma and proximal dendrite of a single cell; the Type II units predominantly originated from the soma of a single cell; and the Type III and Type IV units predominantly originated from the dendrite and soma of a single cell, respectively.
The numbers of detectable units by ICSort and conventional KlustaKwik were in the approximate ratio of 1.3 : 1. As discussed above, Type I units are thought to be a mixture of the signals originating from both the soma and the proximal dendrite. Because ICSort can separate overlapping spikes, one Type I unit can be split into units predominantly originating from the soma and proximal dendrite. Therefore, the sum of the numbers of Type I and Type II units (208) was nearly equal to the number of Type IV units (196). This result also supports the views that extracellular signals are integrated from both the soma and the dendrite, and that ICSort can separate those integrated signals to the somatic and dendritic spikes of a single cell.
Spikes may be locally generated in dendritic trees of pyramidal cells of behaving rats
Using ICSort, cross-correlograms between units detected from the same electrode preferentially showed unidirectional connections from the units predominantly originating from the soma (Type IV) to the units predominantly originating from the dendrite (Type III) with a high probability. This may suggest that some soma-dendritic backpropagating spikes occur in a single cell. However, given that dendritic spikes fire only after somatic spikes, we cannot explain why the firing rates of the Type III units were markedly higher than those of the Type IV units. Recent in vivo and in vitro studies (Kamondi et al., 1998; Stuart et al., 1999; Gasparini et al., 2004) have shown that locally excited dendritic spikes occur under certain conditions. In reference to those findings, the result of this study may suggest that individual dendritic compartments can generate local excitation spikes innervated by presynaptic cells in the hippocampal CA1 of behaving rats. Furthermore, cross-correlograms showed weak connections from the putative dendritic units (Type III) to the putative somatic units (Type IV) with a low probability, suggesting that locally excited dendritic spikes rarely trigger somatic spikes. To elucidate these mechanisms of dendritic spikes, we need additional considerations and advanced experiments with intracellular and/or whole-cell recordings.
Efficiency of dodecatrodes in separating somatic and dendritic units
ICA, which is a core thread of ICSort, has a limitation in that the number of channels (microwires) is more than that of recordable cells (Takahashi et al., 2002). To overcome this ICA limitation, we have developed ICSort, consisting of a combination of ICA and a conventional clustering method (Takahashi et al., 2003a,b). According to our previous simulations with realistic noises (Takahashi & Sakurai, 2005), however, ICSort with conventional four-wire tetrodes can only separate overlapped spikes from two units at most. On the other hand, ICSort with 12-wire dodecatrodes can separate overlapped spikes from a maximum of nine units. Given that somatic spikes of closely neighboring pyramidal cells recorded from one electrode frequently backpropagated to the dendritic tree and coincidently co-fired within a 1-ms range, two or more somatic and dendritic spikes must be overlapped on one electrode. Therefore, we suggest that the use of ICSort with dodecatrodes is efficient in separating somatic and dendritic units even under such spike-overlapping conditions.
Using silicon probes with a linear arrangement of recording sites along the soma-dendritic axis in the hippocampal CA1, a few previous studies (Buzsaki et al., 1996; Buzsaki & Kandel, 1998) showed the possibility of the existence of soma-dendritic backpropagation. However, using such silicon probes alone cannot completely separate somatic and dendritic units owing to the spike-overlapping problem. As the arrangement of the recording tips of the silicon probe can provide us detailed anatomical information of the recorded cells, the combination of ICSort and the silicon probes might enable us to identify somatic and dendritic units with anatomical information about the basal, apical or distal parts of cells. However, the distances between recording sites in the conventional silicon probe (≥ 20 µm) are much larger than those of the dodecatrode (< ∼10 µm; Takahashi & Sakurai, 2005), indicating that ICSort cannot precisely separate spikes detected by the silicon probe. Advances in silicon technology (Csicsvari et al., 2003) for arranging closer recording sites or optimizing the algorithm of ICSort for the current silicon probes will be required to obtain detailed additional anatomical information on the recorded cells.
There was no significant change in attenuation in spike amplitude within a burst in the open field
In contrast to a previous study (Quirk et al., 2001), our result suggests that there is no significant change in attenuation in spike amplitude within a burst for the recording session. The experience-dependent changes in the magnitude of amplitude attenuation within a burst were consistent with previously reported experience-dependent changes in activity of place cells (Mehta et al., 1997). In previous studies, rats were trained to traverse a linear track. In contrast, our rats were trained to forage randomly scattered food pellets in open environments. Some previous reports suggested that place cells are directional when an animal traverses limited tracks, but non-directional when wandering randomly in an open field (McNaughton et al., 1983; Markus et al., 1994; Muller et al., 1994). In addition, during the random foraging of scattered food pellets in an open environment, the activity of hippocampal CA1 place cells remained constant (Fyhn et al., 2004; Leutgeb et al., 2005). We suppose that such differences in the animal behavior and environment result in the inconsistency between the previous report and the present results. Therefore, in our study, the experience-dependent changes do not affect the present results.
Spatial information can be sharpened along the dendrosomatic axis of a pyramidal cell
The main differences between the Type I and Type II units in terms of spatial firing properties and spatial information are as follows: (1) the sizes of the place fields of Type I units are larger than those of the Type II units; (2) the firing rates of the Type I units are higher than those of the Type II units; (3) the SIRs of the Type I units are higher than those of the Type II units. The Type III and Type IV units showed two similar differences: (1) the Type III units discharge more than the Type IV units; (2) the Type III units have more SIRs than the Type IV units. The effect of integration from the soma and dendrite of a single cell can simply lead to these results. However, there are additional differences between the Type III and Type IV units. In the previous subsection we concluded that, unlike the Type I and Type II units, the Type III and Type IV units can be regarded as units predominantly originating from the dendrite and soma, respectively. Therefore, the results showing that the Type IV units showed higher spatial specificity, lower sparsity and lower firing rate than the Type III units and had place fields with a high probability suggest that in pyramidal cells the somatic spikes are spatially more informative than the dendritic spikes, and that the dendrites receive redundant spatial information from the presynaptic neurons in the hippocampal CA3 and the entorhinal cortex (Freund & Buzsaki, 1996; Leutgeb et al., 2007). Consequently, the present results suggest that a hippocampal pyramidal cell transforms redundant spatial information received from upstream neurons via the dendrites to more place-specific information along the dendrosomatic axis and transmits this information to downstream neurons via the soma and axon.
Some studies on spatial firing properties (Wilson & McNaughton, 1993, 1994; Jung et al., 1994) suggested that there exists the sparsity of firing of place cells as well as the lack of spatial overlap among the cells recorded using the same electrode. According to this suggestion and an assumption that KlustaKwik loses only some coincident spikes that overlap within 1 ms among neighboring cells, the units sorted by KlustaKwik and ICSort should show relatively minor differences. However, this study shows a high possibility of putative soma-dendritic backpropagations, that is, large, sharp peaks with ∼0.1-ms delay in the cross-correlogram between the Type III and Type IV units (Fig. 3) that conventional spike-sortings without the separation of overlapped spikes cannot show. The results of this study therefore can be generally reproduced using spike-sortings with ICSort instead of conventional spike-sorting methods.
Future challenge
Using ICSort with dodecatrodes, we distinctively detected units predominantly originating from the soma and dendrite in behaving rats, and showed that they coded different spatial information. However, it is possible that the dendritic spikes cannot be sorted accurately as somatic spikes because their shape might dramatically change during bursts (Stuart et al., 1999). This possibility could affect the spatial information that each unit codes. To minimize this possibility, we have selected units showing high cluster quality values as analysed data of units. To accomplish more elaborate analysis of the information difference between the somatic and dendritic units of single cells and discuss the results in reference to previous findings of in vitro studies using acute and cultured brain slice preparations (London & Hausser, 2005), further confirmation and improvement of the performance of ICSort will be required. One desirable and ideal experiment for confirming and improving the validity of ICSort would be simultaneous intrasomatic, intradendritic and dodecatrode measurements in the brain of behaving animals. Although such an experiment will be very difficult in many technical aspects, it should be carried out in the near future.
Acknowledgements
This work was supported by 21st Century COE Program, Grants-in-Aid for Scientific Research (18047012 and 16330140) and JST CREST Program (Y.S.).
Abbreviations
-
- ICA
-
- independent component analysis
-
- ISI
-
- interspike interval
-
- SIC
-
- spatial information content
-
- SIR
-
- spatial information rate.


