Synchronous oscillations and phase reorganization in the basal ganglia during akinesia induced by high-dose haloperidol
Abstract
Movement disorders such as tremor and akinesia observed in Parkinson's disease have been attributed to dopamine (DA) depletion in the basal ganglia. The changes in subcortical neuronal discharge patterns that follow DA depletion have been a matter of much discussion. Here, we implanted rats with chronic recording electrodes bilaterally in the striatum (CPu) and external globus pallidus (GPe), and induced both acute and repeated DA blockade by administration of high-dose haloperidol. Recordings were made in baseline states, as well as before and after haloperidol injections, which rendered rats akinetic. The immediate physiological effect of pharmacological DA blockade was the development of prominent oscillatory firing in the 6–8 Hz range in both CPu and GPe. Importantly, this oscillatory pattern was not accompanied by consistent changes in the firing rate of either CPu or GPe neurons. Cross-correlation analysis further indicated that neurons within the CPu and GPe fired synchronously after DA blockade. Furthermore, although phase lags between neuronal discharges in the GPe and CPu were uniformly distributed prior to haloperidol administration, CPu significantly lagged GPe discharges after repeated DA blockade. Our results demonstrate that acute DA blockade is sufficient to produce synchronous oscillatory activity across basal ganglia neuron populations, and that prolonged DA blockade results in phase lag changes in pallidostriatal synchrony.
Introduction
It is recognized that basal ganglia dopamine (DA) transmission is important for expression of motor behavior (Poirier et al., 1975). DA is required for normal feeding, locomotion, posturing, grooming and reaction time (Amalric & Koob, 1987; Fletcher & Starr, 1987; Zhou & Palmiter, 1995). DA denervation is the characteristic feature of Parkinson's disease (PD; Shimohama et al., 2003), manifesting as degeneration of substantia nigra compacta and decreased extracellular striatal DA (Schober, 2004). DA denervation is functionally similar to pharmacological DA antagonism (Koob et al., 1984; Fowler et al., 1990). Specifically, DA antagonists inhibit the ability to initiate movement (Fowler et al., 1984) and produce depolarization blockade in nigral neurons, causing decreased extracellular striatal DA (Moore et al., 1998).
Effects of DA depletion on electrophysiological characteristics of individual neurons have been well characterized, with excitability and firing frequency as primary measures. DA denervation increases striatal neuron excitability (Calabresi et al., 1993), an effect duplicated by perfusion of D2 antagonists into the striatum (CPu; West & Grace, 2002). The effect of DA blockade on firing rate is unclear, and varies by region (Lloyd, 1977; Sanderson et al., 1986; Pan & Walters, 1988; MacLeod et al., 1990; Calabresi et al., 1993; Burbaud et al., 1995; Chesselet & Delfs, 1996; Levy et al., 1997; Murer et al., 1997; Rohlfs et al., 1997; Ni et al., 2000; Chen et al., 2001; Magill et al., 2001). Recently, more attention has been paid to firing pattern in addition to rate (Bergman et al., 1994; Brown et al., 2002; Brown, 2003, 2004). Rhythmicity and synchrony have been examined as potential mechanisms of parkinsonian motor deficits. In vitro preparations have shown basal ganglia oscillations in the absence of DA signaling (Plenz & Kital, 1999). This is consistent with studies indicating that nigrostriatal lesions in monkeys change external globus pallidus (GPe) output to continuous bursting (Filion, 1979). Dual-single-unit studies in lesioned primates have shown that CPu and Gpe neuron pairs develop coherent oscillatory firing after lesioning (Nini et al., 1995; Raz et al., 2001), and studies of human PD patients support this (Levy et al., 2000, 2002; Magnin et al., 2000). Examining neuronal populations, increased corticostriatal synchrony has been demonstrated in mice during acute hypodopaminergic states, that produce akinesia (Costa et al., 2006).
It appears that oscillatory discharges in the basal ganglia may cause movement disorders associated with PD. However, their source and spread across brain structures remains uncertain. To clarify this, we sought to characterize synchronous oscillatory activity from neuronal populations in akinetic animals. We performed multiple single-unit recordings in rat GPe and CPu in subjects treated with high-dose haloperidol. Haloperidol has been shown to produce akinesia, and can be used to model PD in rodents (Fowler et al., 1990; Verhagen-Kamerbeek et al., 1993; Cenci et al., 2002; Invernizzi et al., 2003; Lebsanft et al., 2005; Pinna et al., 2005), and replicates neurological correlates of nigrostriatal lesions (Filion, 1979). Because it has been shown that synchronous oscillations develop after both nigrostriatal lesion and acute DA depletion, we hypothesized that acute DA blockade would result in the same. Here, we report that basal ganglia neuron populations show synchronous and coherent oscillatory activity, and a shift in firing phase lag in striatopallidal and pallidostriatal projections, subsequent to repeated high-dose haloperidol injection.
Materials and methods
Subjects
Thirteen experimentally naïve, adult male Sprague–Dawley rats (Harlan) initially weighing 350–400 g were used for these experiments. Animals were housed under a normal dark–light cycle (lights off at 18.00 h). Experimental procedures were performed during the light phase of the cycle. Animals had free access to food and water at all times except during recording sessions, and were maintained within the standards set forth for the care and use of laboratory animals by the National Institutes of Health. All protocols used to complete this study were reviewed and approved by the Animal Care and Use Committee at Wake Forest University Health Sciences.
Surgery
Following arrival from the supplier, animals were allowed to acclimate to the facility for at least 3 days. Animals were implanted with microwire arrays (Biographics, Winston-Salem, NC, USA). Animals were anesthetized with isofluorane, and a prophylactic dose of antibiotics was administered prior to surgery. Body temperature was maintained at 35 °C. Aseptic surgical procedures were observed. After placing the rat in a stereotaxic apparatus, the scalp was shaved, swabbed with iodine and a central incision was made to expose the skull. Small holes were drilled in the skull, and four arrays of eight stainless steel, Teflon-coated microwires (45–62 µm in diameter) were lowered bilaterally into the CPu and GPe. For the CPu, the coordinates used were: anterior/posterior, +0.7 mm from bregma; medial/lateral, ± 2.4; dorsal/ventral, −5.4 from skull surface. The microwires implanted into the CPu were arranged in three rows containing three, three and two microwires, respectively, each spaced 250 µm apart. The entire array cluster was 0.75 mm in diameter. For the GPe, the coordinates used were: anterior/posterior, −0.85; medial/lateral, ± 2.8; dorsal/ventral, −6.8, and the microwires were configured in four rows of two microwires each. Uncoated stainless steel ground wires were positioned 2–3 mm ventral to the skull surface and wrapped around skull screws. The recording headstage was then secured to the cranium with dental acrylic using skull screws as anchors. Subjects received topical lidocaine around the headstage immediately post-surgery, and oral Tylenol for pain on the day following surgery. Subjects were housed individually and given at least 10 days to recover after surgery before beginning any experimental procedures.
Recording protocol
Distributed neural activity was recorded in the CPu and GPe under control and experimental conditions using well-defined protocols (Chang et al., 1994). Neuroelectric signals were amplified and filtered (0.5 and 5 kHz 3 dB cut-offs) via software control. Signals were digitized (50 kHz per channel), and spikes from single units were sorted from background and other units via movable Windows-based parameters using software from Spectrum Scientific (Dallas, TX, USA). Time codes of valid spikes were digitized and recorded. Neuronal firings were recorded continuously for the duration of the session at 1 ms resolution.
Before undergoing any experimental manipulation, each animal was subjected to a 60-min acclimation session where the subject was tethered to the recording system and allowed to move freely in the recording chamber, which consisted of a Plexiglas chamber (dimensions: 20 × 23 × 20 cm) placed within a sound-attenuating box.
Immediately prior to every experimental session, subjects were massed. Subjects were placed in the experimental chamber and tethered to the recording system. Movement was unrestricted during all sessions. Thirty minutes of pre-injection data was recorded. After 30 min, subjects were injected with saline (1 mL/mg i.p.) for the initial session and haloperidol (5 mg/kg i.p. at 5 mg/mL) for all subsequent sessions. Each subject completed 10 sessions total, with one session per day. Neural activity 100 s before and after the injection was excluded from analysis in order to eliminate changes due to injection stress, handling or arousal. The pre-injection period was used as a baseline for each session. Data from saline-injection sessions, Day 1 haloperidol sessions and Day 9 haloperidol sessions were used for analysis. Nine days is generally agreed to be the longest period haloperidol can be continuously administered before tardive dyskinesias begin to appear (Kinon et al., 1984; Steinpreis et al., 1993), so it provides a useful long-term yet still subchronic period for neuronal activity.
Statistical analysis
Analyses of mean firing rates, rate histograms, interspike interval histograms and correlograms were performed using the STRANGER (Biographics) and NEx (Plexon) software packages. Power spectra and statistical comparisons were computed using MatLab (Mathworks). Before including neural signals in a data set, autocorrelograms were performed on each channel record to assure that single neurons were separated from background noise. Criteria used to identify a single neuron across days included consistency of firing rate, shape of extracellular waveform and autocorrelogram pattern across recording sessions.
Power spectrum analysis
Power spectra of the spike train series were computed for 0–30 Hz via MatLab, as described in previous literature (Jarvis & Mitra, 2001; Compte et al., 2003). Power spectra were computed in successive 100-s intervals spanning 1700 s of the pre- and post-injection conditions, and averaged together (excluding the 100 s immediately after injection). Confidence intervals (CI) for the average spectrum were computed based on the variance of the successive power spectra, using a jack-knife method (Compte et al., 2003). To avoid detecting changes in power spectrum shape caused by possible changes in the mean firing rate of a neuron before and after treatment, each power spectrum was normalized by the power spectrum of a Poisson process with equal mean firing rate (Compte et al., 2003). Separate spectra and CIs were calculated for the pre-injection and post-injection periods for each neuron. A peak was considered significant if the 95% CI deflected over the average power of the neuron.
Correlation analysis
Cross-correlograms were computed using the NEx software. A correlogram was considered significant if at least three peaks, each at least three bins wide, deflected outside the 95% CI at a regular frequency (Raz et al., 2000).
Localization of recording electrodes and immunohistochemistry
To visualize electrode placement animals were deeply anesthetized with pentobarbital (100 mg/kg i.p.). A 12-s current of 10–15 µA was passed through at least four electrodes of each eight-electrode array to mark with local electrolytic lesions the loci of the microwires. The animals were then terminally perfused transcardially with a 0.9% saline wash followed by a 2% potassium ferrocyanide in 10% buffered formalin fixative to create a Prussian blue spot marking electrode placement. The brains were removed and stored in 2% potassium ferrocyanide in 10% buffered formalin fixative at 4 °C. Prior to sectioning, the brains were cryoprotected overnight in a 20% sucrose solution at 4 °C. Fifty-micrometre coronal sections were cut on a sliding microtome. Free-floating sections with Prussian blue marks were collected and stored serially in 0.1 m phosphate buffer (PB), pH 7.2. Sections not designated for immunostaining were serially mounted on gelatin-subbed slides, stained with neutral red, passed through an alcohol/xylene series and coverslipped with Permount.
Six sections each from the CPu and the GPe containing Prussian blue staining were stained with an antibody against calbindin (CPu) or parvalbumin (GPe) to localize electrodes using the ABC method. Free-floating sections were washed with phosphate-buffered saline (PBS), pH 7.2. To reduce non-specific binding, sections were blocked for 1 h in 10% normal horse serum in PBS containing 1% Triton X-100, 1% bovine serum albumin and 0.1 m l-lysine at room temperature. Sections were incubated in the primary antibody (Sigma; calbindin, 1 : 10 000 dilution; parvalbumin, 1 : 12 000) containing 1% normal horse serum and 0.1% Triton X-100 in PBS for 12–14 h at 4 °C. Sections were rinsed three times with PBS, and then immersed in biotinylated anti-mouse IgG diluted 1 : 500 in PBS for 60 min at room temperature with constant agitation. Following exposure to the secondary antibody, sections were washed in three 10-min PBS rinses. The sections were incubated in ABC solution (Vector Laboratories) for 60 min with constant agitation and washed in three 10-min PBS rinses. Sections were reacted with 0.05% 3,3-diaminobenzidine tetrahydrochloride and nickel cobalt in PB and 0.01% hydrogen peroxide in PB for 1–3 min to produce a black reaction product. The reaction was terminated by rinsing the sections in 0.1 m PB. After rinsing in 0.1 m PB, sections were serially mounted on gelatin-subbed slides, counterstained with neutral red, passed through an alcohol/xylene series, and coverslipped with Permount.
Control sections for non-specific binding underwent the same experimental procedure, except for the omission of primary antibody in the first overnight exposure. Analysis and photomicroscopy were conducted using an Olympus BX60 microscope and a digital camera.
Results
Identification of neurons and anatomical confirmation
Electrophysiological parameters were used to identify putative neurons on a window discriminator. A neuron was required to exhibit minimally 100 spike events over the course of a session, and show at least a 1-ms gap centered at zero on an autocorrelogram in order to be included in subsequent analyses. By these criteria, 177 neurons were recorded in the saline-injection condition, 167 in the Day 1 haloperidol condition, and 181 in the 9-day haloperidol condition. Day 1 was chosen as a measure of the drug-naive response to haloperidol. Day 9 provided a subchronic measure while still being a sufficiently short time course to avoid tardive dyskinetic effects associated with prolonged neuroleptic administration. Distribution of recorded neurons by region is shown in Table 1.
| CPu | Gpe | |||
|---|---|---|---|---|
| Left | Right | Left | Right | |
| Saline | 63 | 57 | 43 | 14 |
| Day 1 | 63 | 44 | 44 | 16 |
| Day 9 | 71 | 51 | 45 | 14 |
- Number of neurons recorded from each region. The differences in numbers of recorded neurons across treatment conditions can be attributed to haloperidol-induced changes that pushed neuron activity above or below the threshold for inclusion, and/or prolonged recovery from the implantation surgery. CPu, striatum; GPe, external globus pallidus.
Immunohistochemical analysis indicated that the included neurons were recorded from microwires localized within the CPu and GPe. Valid signals were recorded from regions other than the CPu or GPe, but were not included in subsequent analyses. Recordings were made from the left CPu in 13 subjects, right CPu in 11 subjects, left GPe in seven subjects and right GPe in two subjects.
Behavioral effects
In agreement with established literature (De Ryck et al., 1980; De Ryck & Teitelbaum, 1983; Carey & Kenney, 1987; Lebsanft et al., 2005), rats invariably became immobile, rigid and tremulous within minutes of haloperidol injection. Akinesia persisted over the 60-min course of each recording session (data not shown). All subjects were fully mobile and exhibited no signs of haloperidol-mediated akinesia prior to the start of each recording session. No akinesia was observed after injection of saline. Also in agreement with established literature (Kinon et al., 1984; Steinpreis et al., 1993), the treatment course was sufficiently short that tardive dyskinesias did not appear.
Firing rate
We sought to determine whether DA blockade by haloperidol administration induced significant changes in basal ganglia firing rate, and if that could account for the observed movement deficits. Firing rate was computed for each neuron for pre- and post-injection periods, excluding the 100 s immediately prior to and subsequent to injection. Pre- and post-injection mean firing rate was calculated separately for CPu and GPe neurons, and for each of the saline, Day 1 and Day 9 conditions. Pre- and post- rates were compared to determine any changes in firing rate subsequent to injection.
The mean firing rates (± SEM) for the saline and haloperidol conditions are shown in Fig. 1. Repeated-measures anova indicated no significant effect of injection for either CPu (F1,178 < 1, n.s.) or GPe (F1,142 = 1.96, n.s.). On the other hand, there was a significant effect of day of treatment in both CPu (F2,177 = 6.18, P < 0.05) and GPe (F2,141 = 8.29, P < 0.05); firing rate decreased in both areas after 9 days of haloperidol treatment, and this reduction in firing rate was present both before and after injection. There was also a significant injection condition × day of treatment interaction in both CPu (F5,174 = 3.16, P < 0.05) and GPe (F5,138 = 4.21, P < 0.05). Multiple comparisons confirmed that no single condition showed any significant differences subsequent to injection. However, CPu post-injection firing rate was significantly lower in both the Day 1 and Day 9 conditions compared with the saline post-injection firing rate (P < 0.05), but not compared with the pre-injection firing rate. In the GPe, Day 9 post-injection firing rate was significantly lower than both saline pre- and post-injection firing rates (P < 0.05). These results suggest that although DA blockade did have some effect upon firing rate over the 10 days of the experiment, the effect did not correlate directly with post-injection akinesia. No significant changes in firing rate were ever observed immediately subsequent to haloperidol injection (Fig. 1).
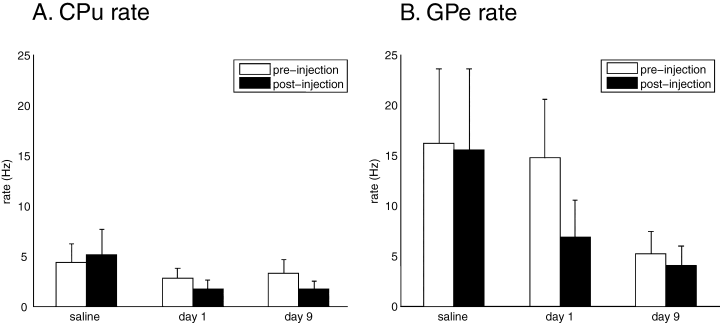
Neuronal firing rates. Pre- and post-injection rates did not differ significantly for any individual condition. (A) Decrease in striatal rate. Day 1 and Day 9 post-injection rates are significantly different (P < 0.05) to saline post-injection. (B) Decrease in pallidal rate. Day 9 post-injection rate is significantly different (P < 0.05) to saline pre-injection and saline post-injection. CPu, striatum; GPe, external globus pallidus.
Oscillation analysis
Next, we examined firing patterns of individual neurons, to determine if there was any alteration in firing mode subsequent to DA blockade. Rasterized traces of rate data suggested periodic firing subsequent to haloperidol injection (Fig. 2; Day 9 shown). To determine any preferential firing frequencies, power spectra were computed for all neurons for the pre- and post-injection periods, excluding the 100 s immediately prior to and subsequent to injection. Areas where the 95% CI deflected outside the mean power were defined as significant.
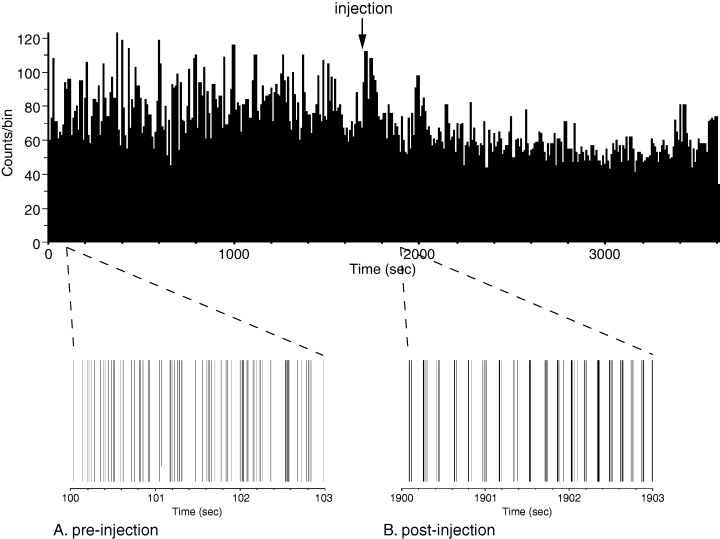
Raster histograms with overall rate histogram from a pallidal neuron, treatment Day 9. (A) Pre-injection raster. (B) Post-injection raster. Oscillatory activity is apparent subsequent to haloperidol injection.
Examination of power spectra of the firing rate function of individual neurons showed preferential firing frequencies in the theta band subsequent to haloperidol injection. Mean frequencies were 6.3 ± 0.5 Hz, 6.7 ± 0.3 Hz and 6.6 ± 0.2 Hz, for the saline, Day 1 and Day 9 conditions, respectively (data given ± SEM). Representative power spectra are shown in Fig. 3. In the saline condition, the spectrum of a representative GPe neuron shows no significant peak post-injection (Fig. 3A). Overall, there was no significant difference in the percentage of neurons that exhibited significant spectral peaks pre- and post-saline injection for either the CPu and GPe (chi-square test, P > 0.05). However, after the first day of haloperidol injection, neurons such as the GPe neuron illustrated in Fig. 3B exhibited significant spectral peaks. There were significantly more post-haloperidol injection peaks in both CPu and GPe (chi-square test, P < 0.05) compared with the pre-injection condition. Likewise, after Day 9, there were significantly more post-injection peaks than pre-injection peaks in both CPu and GPe (chi-square test, P < 0.05), with no significant increase in pre-injection peaks on Day 9 (Fig. 3C and D). Figure 4 illustrates the number of significant spectra observed across all conditions. These results indicate a significant increase in the proportion of neurons displaying oscillatory discharges following injection of haloperidol, but not saline, and this increase was observed even after prolonged treatment. Oscillatory peaks were also seen evident in autocorrelation histograms (Fig. 5). Across all conditions, the exact preferred frequency varied slightly across subjects (range: 6–8 Hz), but was conserved within subjects across all significant neurons and over all conditions, indicating increased coherence. The development of these oscillatory discharges paralleled the onset and occurrence of the haloperidol-induced akinesia.
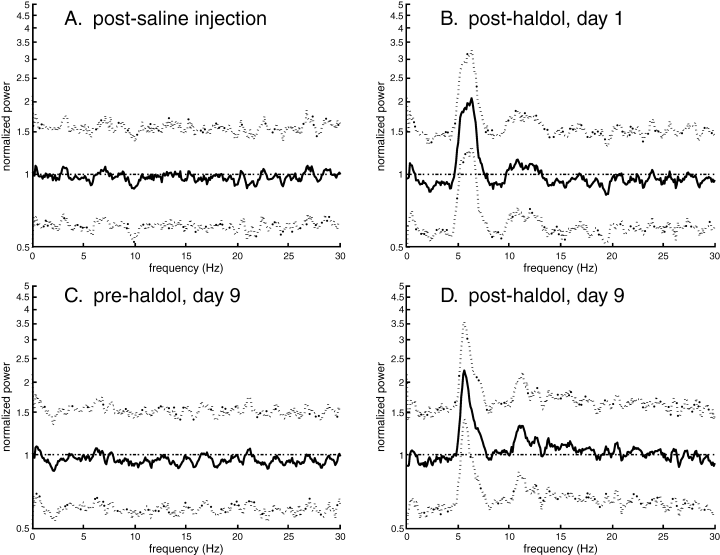
Representative power spectra from a pallidal neuron. Power is shown by the central black line, 95% CI by the dotted lines. The horizontal dotted line denotes average power. (A) Spectrum of a neuron after saline injection. No significant peaks are present. (B) Post-injection spectrum on Day 1 of haloperidol administration. Note the significant deflection at ∼6.5 Hz. (C) Pre-injection spectrum on Day 9 of haloperidol administration. No significant peaks are an indication that continuous haloperidol has not resulted in any build-up effects. (D) Post-injection spectrum on Day 9 of haloperidol administration, showing a significant deflection at ∼6.5 Hz.
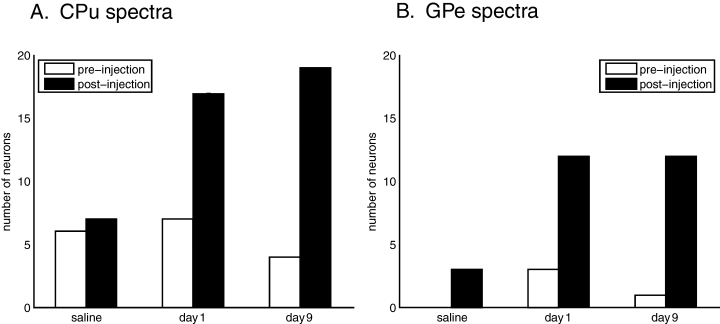
Significant spectral peaks pre- and post-injection. Peaks all occurred in the 6–8 Hz range. *Significantly more post-injection peaks on Day 1 (P < 0.05). **Significantly more post-injection peaks on Day 9 (P < 0.05). (A) Significant striatal neuron peaks. (B) Significant pallidal neuron peaks. CPu, striatum; GPe, external globus pallidus.
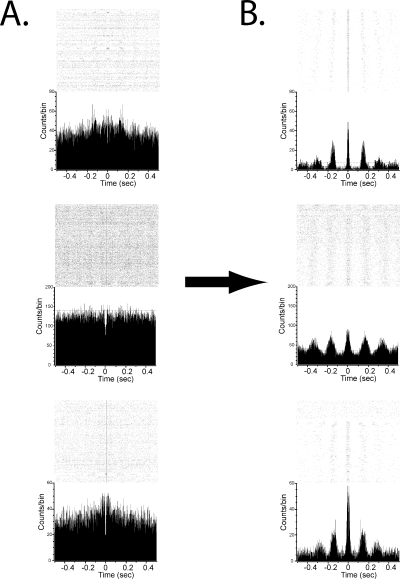
Representative autocorrelograms with rasters from pallidal (top and middle rows) and striatal (bottom row) neurons. Mean counts/bin is shown by the dotted line, 95% CI by the dashed lines. Rasters illustrate individual firings of a neuron around time zero. Each dot illustrates the activity of a neuron over repeated trials, relative to its own firing. Trials are ordered chronologically, with the earliest trials at the top and latest trials at the bottom of the raster plot. The reference point is centered at time zero. (A) Pre-injection autocorrelograms. There are no regular deflections over the CI. (B) The same neurons after 5 mg/kg haloperidol show regular periodic deflections over the 95% CI.
Synchrony analysis
Having established the existence of coherent oscillatory firing in single neurons, we next sought to determine they were synchronous, and whether this activity spreads to neuronal populations and, if so, where the origin of this activity is located. Cross-correlograms were computed, which depict the probability distribution of interspike intervals between the firing of a neuron and the successive firing of a second neuron. Activity patterns of neuron populations can be observed and quantified in this way. We utilized cross-correlation oscillatory analysis to examine population synchrony and oscillatory activity (Raz et al., 2000; see Materials and methods). By examining phase shift between the oscillatory peaks of two neurons, it can be determined if the neurons are synchronous, or if one neuron leads or lags the other. From the phase relationships, the origin of any synchronous population activity can be deduced by backtracking to the earliest-firing neurons.
Pre- and post-injection cross-correlograms were computed for all possible neuronal pairings within a treatment condition, excluding the 100 s immediately prior to and subsequent to injection. A 95% CI was calculated for each pairing and overlaid onto its cross-correlogram. We defined periodic deflections over and/or under the 95% CI as significant oscillatory firing. Pre- and post-injection cross-correlograms were compared to assess the development or loss of any significant oscillatory population activity and the phase relationship between pairs. Significant cross-correlated oscillatory activity was observed in nine of 13 subjects. In the saline condition 1399 pairings were examined. Within this population, 26 pairs (1.9%) exhibited significant oscillatory cross-correlation post-injection. Both the Day 1 and Day 9 conditions exhibited significantly more significant oscillatory cross-correlations post-injection than the saline condition (chi-square test, P < 0.05). In the Day 1 condition, 142 of 1275 examined pairs (11.1%) developed significant oscillatory cross-correlation. In the 9-day treatment condition, 174 of 1488 pairs (11.7%) developed a significant cross-correlation. Representative cross-correlograms are shown in Fig. 6. Consistent with previous results (Bergman et al., 1994), only 11 pairs (0.7%) displayed any pre-injection oscillatory activity, which was not significantly different from saline-injection measures (P > 0.05), indicating that haloperidol build-up had no significant influence on the Day 9 results.
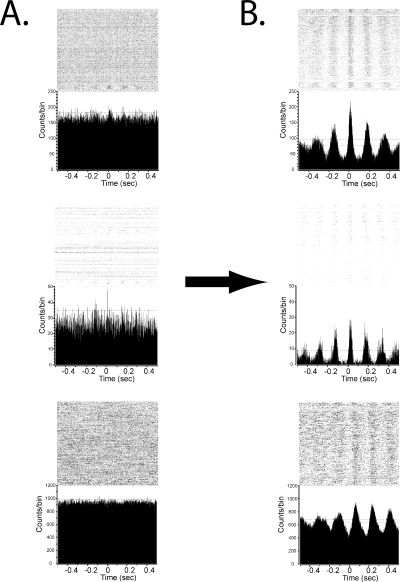
Representative cross-correlograms with rasters of a striatal neuron referenced to a striatal neuron (top row), striatal neuron referenced to a pallidal neuron (middle row) and a pallidal neuron referenced to a pallidal neuron (bottom row). The mean counts/bin is shown by the dotted line, 95% CI by the dashed lines. Rasters illustrate individual firings of a neuron around time zero. Each dot illustrates the activity of a neuron over repeated trials, relative to the firing of the reference neuron. Trials are ordered chronologically, with the earliest trials at the top and latest trials at the bottom of the raster plot. The reference neuron activity is centered at time zero. (A) Pre-injection cross-correlograms on Day 9 of haloperidol administration. Pairings are all non-significant, as there are no regular deflections over the CI. The lack of significant cross-correlated activity in the Day 9 pre-injection period indicates that continuous haloperidol has not caused any build-up effects. (B) Cross-correlograms for the same pairings after haloperidol injection. Regular periodic deflections over the 95% CI indicate significance.
Multiple types of cross-correlational pairings were possible in the experimental paradigm; the distribution of pairings observed and percentages of total pairs for each condition is shown in Table 2. The frequency of cross-correlated oscillation ranged from 6.5 to 7.5 Hz. As with power spectra analysis, exact frequency varied between subjects but was consistent within an individual subject and across all treatment conditions.
| Numbers of significantly cross-correlated neuron pairs | ||||||
|---|---|---|---|---|---|---|
| GPe, singlenucleusn (%) | CPu, singlenucleusn (%) | GPe, bothhemispheresn (%) | CPu, bothhemispheresn (%) | Different nuclei,same hemispheren (%) | Different nuclei, different hemispheres n (%) | |
| Saline | 1 (0.6) | 9 (3.3) | 0 (0.0) | 10 (3.5) | 4 (1.3) | 2 (0.6) |
| Day 1 | 42 (20.6) | 17 (8.9) | 0 (0.0) | 25 (11.7) | 31 (9.6) | 27 (9.5) |
| Day 9 | 62 (32.8) | 23 (8.6) | 0 (0.0) | 25 (8.7) | 40 (10.7) | 24 (7.0) |
- The number of significantly cross-correlated neuron pairs for each treatment condition broken down by type of pairing (with percentage of total for each type of pairing in the given condition pairings observed in parentheses).
The phase relationship between cross-correlated neurons varied in a regional manner. Neurons within a nucleus exhibited strong phase-locked activity with zero lag. Striatal neurons were also phase-locked bilaterally with zero lag. Striatal-pallidal cross-correlation varied depending upon treatment condition. During the first day of haloperidol treatment, phase relationship was approximately normally distributed (mean = +3.0 ± 1.3 ms, not significantly different than zero; t-test, P > 0.05). After 9-day haloperidol treatment, however, striatal neurons significantly lagged pallidal neurons of the same hemisphere consistently by ∼10 ms (mean = −9.4 ± 1.1 ms, Wilcoxon-Mann–Whitney P < 0.05; 7, 8). Additionally, it bears note that the phase realignment appeared rapidly, being fully present by Day 5 of recording (data not shown). It is apparent that subchronic treatment with haloperidol results in a phase realignment between striatal and pallidal neurons, causing CPu to consistently lag GPe.
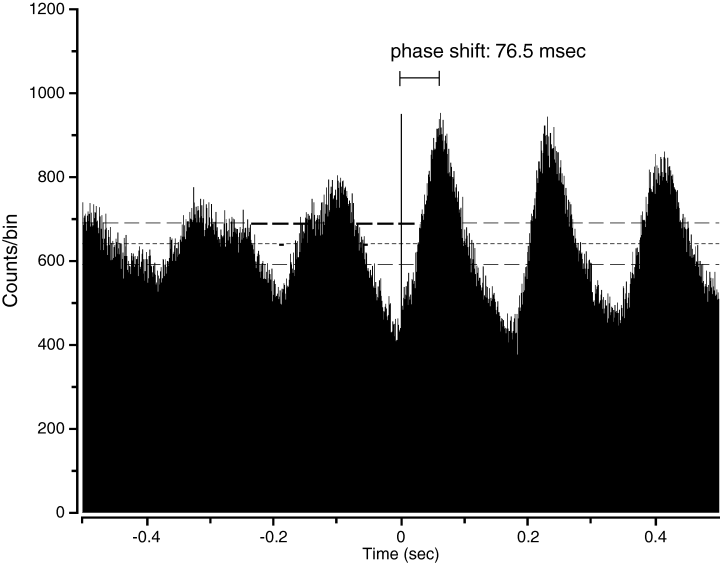
Phase shift illustrated. The oscillatory peak-to-time zero (indicated by horizontal bar) is 76.5 ms.
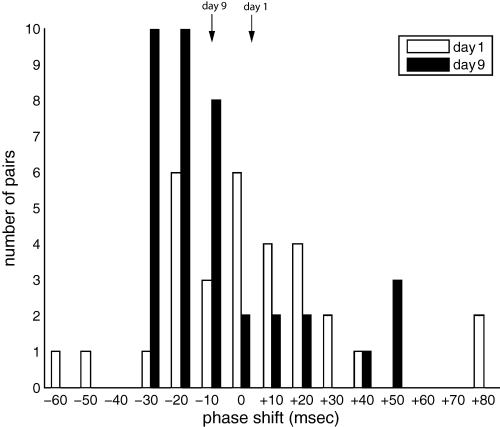
Distribution of striatal-pallidal cross-correlation phase relationships. The Day 1 distribution is approximately random. The Day 9 distribution shows a phase reorganization, favouring ∼10 ms lag. The mean phase shift for Day 1 (+3.0 ms) and Day 9 (−9.4 ms) are denoted by arrows.
Discussion
Our data indicate the occurrence of synchronous oscillatory firing across basal ganglia neuron subpopulations in the theta band subsequent to DA blockade, and a phase reorganization between CPu and GPe neurons after prolonged haloperidol treatment. Rhythmic firing in individual neuron spike trains and rhythmic cross-correlation emerged after haloperidol treatment, both in the 6–8 Hz range. Cross-correlated activity occurred most commonly in the same hemisphere between pairs of pallidal neurons and between pallidal and striatal neurons. Furthermore, within a hemisphere, GPe activity, while significantly correlated to CPu activity, initially exhibited a synchronous phase lag relationship with CPu; however, after 9 days of haloperidol, pallidal neurons consistently led striatal neurons by ∼10 ms, on average. The development of synchronous oscillations paralleled the haloperidol-induced akinesia in the subjects. In contrast, firing rate did not seem to account for behavioral effects of haloperidol. While there was a general decrease in rate after haloperidol administration in both CPu and GPe neurons, it was not significant in any single condition. Furthermore, the reduced Day 1 GPe post-injection rate was present in the Day 9 baseline rate with no corresponding change in kinesis, indicating that rate is not predictive of behavioral outcomes of DA blockade. Taken together, these results strongly suggest that synchronous oscillations are a pathological hallmark of parkinsonian akinesia
Origin of oscillatory firing
Oscillatory firing has been previously observed experimentally in both humans and non-human primates (Bergman et al., 1994; Brown et al., 2002; Brown, 2003, 2004). In organotypic cultures, it has been shown that the GPe and subthalamic nucleus (STN) form a pacemaker circuit that can burst synchronously, favoring low-frequency oscillations (Plenz & Kital, 1999). Furthermore, anesthetized 6-hydroxydopamine-lesioned rats exhibit low-frequency oscillations in substantia nigra pars reticulata neurons, which are reduced by STN lesions (Tseng et al., 2001). Computational modeling suggests two activity modes (rhythmic and irregular) in the STN-GPe pacemaker circuit (Terman et al., 2002), which arises from the reciprocal activities of the STN and GPe. It has been suggested that the oscillatory STN-GPe circuit requires rebound burst firing from STN neurons (Bevan et al., 2000). In vitro preparations show that sufficiently large γ-aminobutyric acid (GABA)ergic inhibitory postsynaptic potentials tend to reset the intrinsic oscillation of STN neurons to the same zero point and cause a rebound burst depolarization (Bevan et al., 2002a). Rebound bursting from the STN in turn realigns the phase of GPe neuron firing, resulting in synchronous GPe activity (Stanford, 2003). This feedforward loop can then propagate to other basal ganglia regions (Bevan et al., 1998).
It has been hypothesized that low-frequency, synchronous oscillations arising in awake animals should be considered a neurological substrate of parkinsonian akinesia (Bevan et al., 2002b). Primate studies have shown some support for this hypothesis, as well as some behavioral correlates of this neurological phenomenon. In a 1-methyl 4-phenyl 1,2,3,6-tetrahydropyridine (MPTP) model of PD, vervet monkeys show significant oscillatory synchrony between GPe and internal GP (Raz et al., 2000). In human patients with PD, unit studies show DA-sensitive oscillatory synchrony between STN and internal pallidus neurons (Brown et al., 2001), as well as synchronous oscillation between STN neuron pairs (Levy et al., 2000) during both tremor and non-tremor states.
Recent studies suggest that striatal and cortical neurons exhibit increased entrainment of their discharges to local field potentials during akinetic states in a knockout mouse model of DA depletion (Costa et al., 2006). Furthermore, this entrainment was most pronounced to delta- and theta-frequency oscillations. Taken together with our current findings, these results suggest that the spread of low-frequency, rhythmic discharges across multiple brain regions is a generalized effect of DA-dependent akinesia, regardless of the model used.
Implications of oscillations
Our results are in agreement with the previous work showing alterations in synchrony and oscillatory activity in the basal ganglia (Bergman et al., 1994; Nini et al., 1995; Hutchison et al., 1997, 2004; Raz et al., 2000, 2001; Brown et al., 2002; Goldberg et al., 2002, 2004; Brown, 2003, 2004; Sharott et al., 2005a,b; Magill et al., 2006). Here we extend this work to show the occurrence in neuron populations in awake, freely moving subjects, in a haloperidol model. Additionally, we find that oscillatory activity propagates to CPu as well, though the mechanism and pathway of propagation is not clear. We observed consistent low-frequency spectral peaks, which are conserved within subjects and significant cross-correlated oscillatory activity between neurons in different regions and hemispheres, likewise in the same frequency range. All of the observed effects were coincident with the neuroleptic-induced akinetic state. These phenomena appear sporadically in the baseline state, but become far more prevalent subsequent to DA blockade.
We should note that individual neurons can and did spontaneously enter the oscillatory state even during normal DA signaling, and this phenomenon has been observed previously (Raz et al., 2000, 2001). However, this effect occurs only intermittently. Additionally, while it is not the majority of neurons that enter the synchronous oscillatory state subsequent to DA blockade, this subpopulation appears to be enough to effect the akinetic state.
Implications of phase shifts
The CPu synchrony and lack of phase shift across hemispheres indicate that a subpopulation of CPu neurons are firing in bilateral synchrony. There are two possible explanations for this: the striatal nuclei in both hemispheres independently generate oscillations at the same intrinsic frequency and have the same zero-point for their oscillations by chance, or there is some form of bilateral cross-talk and regulation creating a central pacemaker. The first explanation appears highly improbable. The second indicates coordination through thalamic nuclei and/or cortex via one or more of the interhemispheric structures. Two implications arise from this explanation: first, that basal ganglia involvement in parkinsonian motor deficits is far broader than generally assumed; and second that unilateral lesions, a common model of PD, might not fully capture the neurological correlates of idiopathic PD.
Pallidostriatal activity
The cross-correlational relationships observed between CPu and GPe were unexpected, and give rise to a number of theoretical implications. The pallidostriatal projection, though long-since documented (Staines et al., 1981), has not been characterized in detail. Characterization of this projection has relied upon anatomical means (Staines et al., 1981; Kuo & Chang, 1992; Rajakumar et al., 1994; Miwa et al., 1998, 2001; Kita & Kita, 2001), although there have been some electrophysiological investigations (Walker et al., 1989; Bevan et al., 1998). The shift from an approximately random distribution of lead and lag between CPu and GPe neurons to GPe leading CPu in a consistent, temporally regular manner suggest an alteration in basal ganglia firing modality. Whereas during baseline conditions and acute DA blockade the activities of the striatopallidal and pallidostriatal pathways appear to equilibrate, long-term DA blockade seems to push pallidostriatal activity to the dominant tone. It has been hypothesized that pallidostriatal projections preferentially target striatal interneurons (Bevan et al., 1998), resulting in a potent modulatory influence upon the CPu by the GPe. This has implications for the classical direct/indirect pathway approach to PD, as if the GPe is in fact modulating the CPu by way of interneurons it is possible that the ‘indirect pathway’ is indirectly modulating the ‘direct pathway’. Although it is not possible to make definitive conclusions of directionality based upon phase lead and lag alone, strong and reasonable inferences may be made. We observed an average phase lag of approximately 10 ms between CPu and GPe neurons (corresponding to 11° of phase difference of a 7 Hz oscillation). This phase lag is in the order of striatopallidal fibre conduction latencies, which have been estimated to be 5.1–9.8 ms, indicating conduction velocities of 0.4–0.8 m/s (Park et al., 1982).
It is not entirely clear why this phase realignment does not occur with the initial haloperidol injection, particularly when considering that subjects exhibited profound akinesia in both treatment conditions. It is possible that subchronic treatment with haloperidol insufficient to cause build-up effects is of sufficient duration to cause depolarization blockade as mentioned previously (Moore et al., 1998). If this is the case, the resultant decreased striatal DA levels could influence this phase realignment. A second possibility is that the reorganization is a consequence of loss of glutamatergic synapses on striatopallidal neurons (Day et al., 2006). It is not known if 9 days of high-dose haloperidol injections is sufficient to cause the synaptic degeneration seen with DA depletion; however, that possibility cannot be discarded.
Given that the observed phase reorganization does not occur with the initial injection, but full and profound akinesia does, the reorganization cannot be a substrate of acute DA-associated akinesia, although it could be important for the changes observed after prolonged DA blockade. One would think that after prolonged DA blockade the GPe drives CPu activity, perhaps patterning the oscillatory activity seen in CPu neurons. However, this mean reorganization was not present on Day 1 of haloperidol injection, while CPu oscillatory activity was. Furthermore, the bilateral synchrony among CPu neurons would appear to require a central regulatory mechanism. This would necessitate synchronous activity among GPe neurons bilaterally. We observed no such bilateral synchrony among GPe neurons.
The data presented here indicate that neurological correlates of DA dysfunction encompass far more than just alterations in firing rate or a shift from a direct to an indirect pathway. The present data document in freely moving animals the development of rhythmicity, associations between neurons and phase relationships between structures in a pharmacological model of PD. Synchronous oscillation in CPu and GPe neurons, bilaterally synchronous CPu oscillation, and enhanced pallidostriatal tone occurred coincident to a pharmacologically induced DA-blockaded state. The gradual development of these oscillations paralleled the development of dyskinetic phenomena induced by haloperidol. Taken as a whole, these data strongly suggest that synchronous oscillation and enhanced pallidostriatal activity are substrates of parkinsonian akinesia.
Acknowledgement
This work was supported by NINDS grant P50 NS019608 and AA13199 to D.J.W.
Abbreviations
-
- CI
-
- confidence interval
-
- CPu
-
- striatum
-
- DA
-
- dopamine
-
- GPe
-
- external globus pallidus
-
- PB
-
- phosphate buffer
-
- PBS
-
- phosphate-buffered saline
-
- PD
-
- Parkinson's disease
-
- STN
-
- subthalamic nucleus.


