Developmental changes of neurotrophin mRNA expression in the layers of rat visual cortex
Abstract
Neurotrophins are essential factors for the structural, neurochemical and functional maturation of the brain including developmental and adult plasticity. Northern blots and polymerase chain reaction revealed the expression of neurotrophin 4 (NT4), neurotrophin 3 (NT3), brain-derived neurotrophic factor (BDNF) and nerve growth factor (NGF) in the cortex. The cellular producers of NT3 and BDNF have been characterized by anatomical methods as being mostly pyramidal, and the tyrosine kinase B (TrkB) receptor is expressed by many cortical neurons. However, these methods have so far failed to identify the cells producing NT4 and NGF mRNA. These factors are much lower in expression than, e.g. BDNF, and apparently remain below detection levels of in situ hybridization. Given their specific actions on cell types and afferent systems, knowledge about the producing cell types is highly desirable. To narrow down on the producing cell types, we quantified by reverse transcriptase-polymerase chain reaction (RT-PCR) the developmental changes of BDNF, NT3, NT4, NGF and TrkB mRNA expression in total visual cortex lysates, and in the cortical layers dissected by tangential cryostat sectioning. We found dramatic changes in laminar expression of NT3 and NGF, mild changes of NT4, and no changes of BDNF and TrkB mRNA. For instance, NT3 is important early on for thalamocortical axons, and we found transient peaks of NT3 mRNA expression first in layer VI, then in layer IV. NT4 mRNA was in layers IV and VI, suggesting NT4 protein production in thalamorecipient layers, but peak expression gradually shifted to upper layers as did NGF expression. The layer-specific developmental expression shifts of neurotrophin mRNAs correlate with morphogenetic processes.
Introduction
Neurotrophins are essential for cortical maturation and plasticity. They regulate cell growth and dendritogenesis (McAllister, 2001; Wirth et al., 2003), the expression of functional markers in cortical interneurons (Carnahan & Nawa, 1995; Wahle et al., 2003; Patz et al., 2003, 2004 Wirth et al., 2005), plasticity (Thoenen, 2000; Lodovichi et al., 2000; Lessmann et al., 2003) and even the expression of neurotrophins (Patz & Wahle, 2004). However, the site of action might not be the site of production of the factor. Neurotrophins are cell type- and circuit-specific functional markers involved in retrograde, anterograde and even transcellular signalling (Wirth et al., 2005) via axonal transport, and this way support afferent neurons and neurons in efferent target areas. For instance, exogenous neurotrophin 4 (NT4) delivered into visual cortex accelerates the maturation of neurons in the lateral geniculate nucleus (Wahle et al., 2003) and prevents their shrinkage after monocular deprivation (Riddle et al., 1995). Moreover, cortical NT4 accelerates growth of γ-aminobutyric acid (GABA)ergic neurons in the optic layers of the superior colliculus (Wahle et al., 2003), and this argues for anterograde axonal supply. These observations are interpreted as being part of the biological actions of NT4 produced in the cortex. The same accounts for nerve growth factor (NGF), which is produced in the cortex as target-derived neurotrophin for cholinergic afferents (Phillips et al., 2004). A prerequisite for this assumption is that the cortical neurons involved in these circuits produce these factors. However, knowledge about the producing cell types is limited. Northern blots and polymerase chain reaction (PCR) revealed the mRNAs of all neurotrophins in the cortex. Histological studies showed that neurotrophin 3 (NT3) and brain-derived neurotrophic factor (BDNF) are produced by cortical pyramidal neurons, as are tyrosine kinase B (TrkB) and TrkC, whereas interneurons express TrkB, but not BDNF, and only rarely TrkC (Ringstedt et al., 1993; Gorba & Wahle, 1999; Vigers et al., 2000; Tropea & Domenici, 2001; Tropea et al., 2001; Ma et al., 2002). NT4 and NGF are expressed in amounts escaping histological detection. Some information exists on NGF protein-expressing cells in macaque cortex (Miller, 2000), but the producers of NT4 are unknown. To narrow down on producing cell types and layer-specific actions of the factors, we quantified by reverse transcriptase (RT)-PCR the developmental changes of BDNF, NT3, NT4, NGF and TrkB mRNA expression in total visual cortex lysates, and in the cortical layers dissected by tangential cryostat sectioning of flat-mounted visual cortex. Flat-mounting and surface-parallel sectioning has been used in the past to, e.g. unravel the anatomy of ocular dominance architecture. We adopted the procedure to dissect the layers of the lissencephalic rat cortex.
Materials and methods
Layer preparation
Pigmented rats aged postnatal day (P)1, P5, P10, P15, P20, P30, P40 and adult were killed with an overdose of Narcoren (60 mg/kg bodyweight) and transcardially perfused with ice-cold 1 × standard sodium citrate. The visual cortex of both hemispheres was dissected as square blocks of 2–3 mm edge length, and immediately shock-frozen as flat-mount between glass coverslips. To determine the thickness of the cortical layers, one block was mounted in a coronal plane into a Leica 2800E cryostat having an object holder with a ball-and-socket joint. Twenty-micrometre-thick coronal sections were slide-mounted from the cryostat, immersion-fixed in 4% buffered paraformaldehyde and stained with thionin, dehydrated and coverslipped with DEPEX. The depth of the laminar boundaries was measured from the pial surface to the white matter with an object micrometre. From these distance measures, the numbers of tangential 20-µm sections (starting with section #1 at the pial surface) to be sampled from the second block was calculated. Sections (resp., numbers) overlapping the laminar boundaries were noted, they were later on discarded to reduce cross-contamination (Fig. 1). In addition, coronal sections were collected in tissue-lysis buffer to determine the developmental changes over age in the ‘total cortex lysate’.
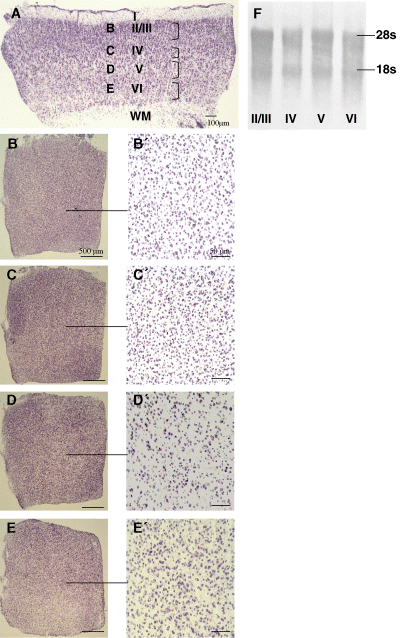
Histological and molecular correlates of the layer separation procedure. (A) Coronal section through P15 visual cortex taken from a flat-frozen cortex block; layers are given, and the brackets indicate the cortical depths from which sections were sampled. Sections from the gaps between the brackets overlapped laminar boundaries and were discarded to avoid cross-contamination. (B–E) Tangential sections through layers II/III, IV, V and VI, respectively, at low magnification. (B′–E′) Higher-magnification photomicrographs reveal packing density and size of somata in the four laminar compartments. (F) Methylene blue-stained Northern blot of total RNA isolated from the layers reveals the integrity of the 18 s/28 s ribosomal RNAs.
The second block was mounted in lysis buffer (in mm: Tris–HCl (pH 8.0), 100; LiCl, 500; EDTA (pH 8.0), 10; 1% LiDS) into the cryostat. The block was adjusted via the ball-and-socket joint of the object holder such that the pial surface was parallel to the knife. Sections through layer I had to be destroyed in order to adjust the optimal cutting angle. Horizontal sections of 20 µm thicknesses through layers II/III, IV, V and VI were cut. Sections were transferred with a pointed scalpel into tubes with lysis buffer, and already during the transfer they thawed in the presence of the denaturing RNA-protecting buffer.
As proof-of-principle control for the layer enrichment in P15 rat cortex, we prepared histologically stained coronal and tangential sections slide-mounted from the cryostat at the determined cortical depths to reveal the laminar characteristics in soma size and packing density. Sections were fixed and stained. Figure 1A shows a thionin-stained coronal section used to measure the laminar depths. Figure 1B–E shows tangential sections of layers II/III, IV, V and VI at the positions indicated in Fig. 1A. The low-magnification overviews reveal the overall integrity of the sections. Figure 1B′–E′ shows higher magnifications, and the typical packing densities of the cortical layers are evident, with layer IV displaying the highest and layer V the lowest cell density and larger somata.
Further, total RNA was isolated from the tangential sections for a Northern blot. For this we pooled sections of layer I white matter separated from four hemispheres. Total RNA was isolated with a Versagene RNA purification kit according to the manufacturer's protocol (Gentra Systems, MI, USA). The entire amount isolated from every laminar compartment was loaded on a 1.5% agarose MOPS–formaldehyde gel. After separation, RNA was blotted to HybondN (Amersham). The blot was stained with methylene blue. Figure 1F shows the integrity of the ribosomal RNAs and reveals that about equal amounts of RNA were harvested from every laminar compartment.
PCR
The mRNA was prepared from the total cortex and layer-enriched lysates using a Dynabead mRNA Direct Kit (Dynal, Hamburg, Germany). cDNA libraries were synthesized with Sensiscript reverse transcriptase (20 U/µL; Qiagen, Hilden, Germany) at 37 °C for 60 min. PCR was performed in a total volume of 50 µL with Taq DNA Polymerase (0.5 U/µL; Qiagen). The single-band amplicons were base pairs 158–393 for BDNF (30 cycles: 1 min 94 °C, 1 min 55 °C, 1 min 72 °C), base pairs 158–634 for NT3 (36 cycles: 1 min 94 °C, 1 min 55 °C, 2 min 72 °C) (Maisonpierre et al., 1990), base pairs 309–605 for NT4 (36 cycles: 1 min 94 °C, 1 min 57.5 °C, 1 min 72 °C) (Berkemeier et al., 1991), base pairs 456–946 for NGF (33 cycles: 1 min 94 °C, 1 min 57 °C, 2 min 72 °C) (Ming et al., 1999), and base pairs 1422–1931 for TrkB kinase domain (30 cycles: 1 min 94 °C, 1 min 55 °C, 1 min 72 °C) (Middlemas et al., 1991); in addition, base pairs 1394–1724 of the ether a go-go potassium channel (Eag2) (30 cycles: 1 min 94 °C, 1 min 55 °C, 1 min 72 °C) (Saganich et al., 2001) and base pairs 137–363 of parvalbumin (PARV, 30 cycles: 40 s 94 °C, 40 s 55 °C, 1 min 72 °C) (Patz et al., 2004) were amplified for control. Glucose-6-phosphate dehydrogenase was used as standard (G6PDH) (base pairs 2112–2272, 30 cycles: 1 min 94 °C, 1 min 55 °C, 1 min 72 °C) (Ho et al., 1988). PCR conditions were kept within the linear range determined for every product. The relative mRNA expression was determined with six PCR reactions run with cDNA libraries from at least three animals. In every set of layer-enriched libraries, all eight mRNAs were amplified.
Analysis
PCR gels were scanned, relative band intensities were densitometrically determined (Eagle Eye System®, Stratagene) and normalized to G6PDH expression. For the developmental profiles, the expression level at P1 was set to 100%. For the laminar profile, the expression in the age-matched ‘total cortex lysate’ was set to 100% and the amplicon intensities in the individual layers were expressed in percent from total.
Results
PARV and Eag2 mRNA expression
To control the layer separation procedure, we employed two markers with a known laminar expression. PARV mRNA is enriched in middle cortical layers, and high densities of PARV neurons are in layer V of the rat visual cortex. PARV expression starts during the second week (Patz et al., 2004), and it had a pronounced expression in layer V from P20 onwards (Fig. 2A). In addition, the Eag2 was used because it is strongly enriched in layer IV and expressed at earlier stages (Saganich et al., 2001). As expected, Eag2 mRNA showed the highest mRNA expression in layer IV (Fig. 2B). For the following, only cDNA library sets showing these profiles were accepted as ‘layer-enriched’ and used to determine the neurotrophin expression.
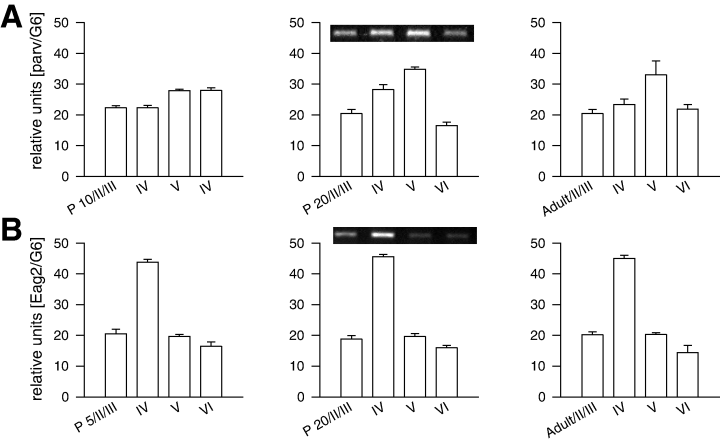
Parvalbumin (PARV) and ether a go-go potassium channel (Eag2) mRNA expression in layers II/III, IV, V and VI at different ages. (A) Laminar PARV mRNA expression at P10, P20 and adult. (B) Laminar Eag2 mRNA expression at P5, P20 and adult. The insets show representative PCRs of the corresponding ages.
BDNF mRNA expression
In total cortex lysates (Fig. 3A), the expression of BDNF mRNA increased slowly after birth, and dramatically after eye opening between P10 and P20. Peak expression was reached at P20, and remained high during the critical period of visual plasticity. Thereafter, BDNF mRNA expression decreased slightly towards adulthood. This confirms previous reports (Castren et al., 1992; Schoups et al., 1995; Gorba et al., 1999). BDNF mRNA was expressed equally in all layers, and the relative amounts remained the same during development (Fig. 3B), whereas the other mRNAs identified in the very same sets of layer-enriched cDNA libraries revealed either strong laminar peaks or shifts in expression. This suggested that BDNF becomes upregulated to about the same degree in all layers.
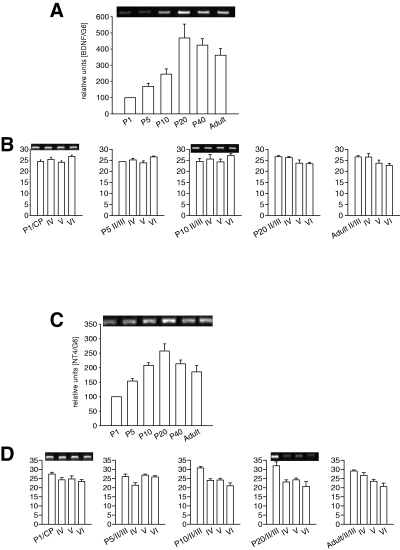
Brain-derived neurotrophic factor (BDNF) and neurotrophin 4 (NT4) mRNA expression. (A) Developmental profile of BDNF mRNA expression. (B) Laminar BDNF mRNA expression at P1, P5, P10, P20 and adult. (C) Developmental profile of NT4 mRNA expression. (D) Laminar NT4 mRNA expression at P1, P5, P10, P20 and adult. CP, cortical plate; the insets show representative PCRs of the corresponding ages.
NT4 mRNA expression
In total cortex lysates (Fig. 3C) NT4 mRNA expression doubled until P10, reaching a peak at about P20 followed by a slight decrease until adulthood. NT4 mRNA was expressed in all layers including the immature cortical plate at perinatal stages and layer IV at older stages. Relative strength of expression remained the same until P5. At P10 and P20, expression was strongest in supragranular layers II/III, and this supragranular-high to infragranular-low gradient persisted at P40 and adult (Fig. 3D).
TrkB mRNA expression
In total cortex lysates (Fig. 4A), TrkB mRNA expression decreased transiently after birth, and recovered to newborn level around eye opening. A slightly higher plateau was observed at P20 and P40. Towards adult, TrkB mRNA expression decreased to a level lower than that seen at P1. Despite these fluctuations, TrkB mRNA expression was expressed equally in the four laminar compartments, and the relative amounts remained the same during development (Fig. 4B). The increase during the critical period of visual plasticity thus occurred in all layers of the visual cortex.
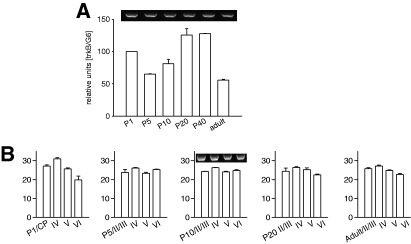
Tyrosine kinase B (TrkB) mRNA expression. (A) Developmental profile of TrkB mRNA expression. (B) Laminar TrkB mRNA expression at P1, P5, P10, P20 and adult. CP, cortical plate; the insets show representative PCRs of the corresponding ages.
NT3 mRNA expression
In total cortex lysates (Fig. 5A), NT3 mRNA expression remained at about the same level during postnatal development. However, the laminar analysis revealed a striking shift in relative expression strength (Fig. 5B). At P1, NT3 expression was strongest in layer VI, and relatively low in layer V. At P5, the strongest expression occurred in layer IV. These changes were true laminar shifts because the expression in the total cortex lysate remained constant at these ages. At P10 and P20, the supragranular layers displayed the strongest expression. In the adult, the relative strength of NT3 mRNA expression was similar in the four laminar compartments.
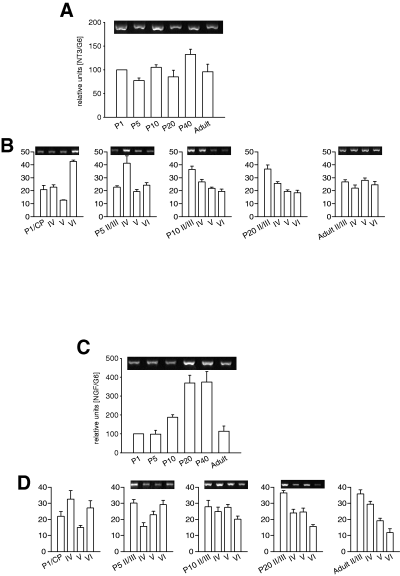
Neurotrophin 3 (NT3) and nerve growth factor (NGF) mRNA expression. (A) Developmental profile of NT3 mRNA expression. (B) Laminar NT3 mRNA expression at P1, P5, P10, P20 and adult. (C) Developmental profile of NGF mRNA expression. (D) Laminar NGF mRNA expression at P1, P5, P10, P20 and adult. CP, cortical plate; the insets show representative PCRs of the corresponding ages.
NGF mRNA expression
In total cortex lysates (Fig. 5C), NGF mRNA expression remained low until P5. A moderate increase until P10 was followed by a sharp increase until P20. This peak level remained until P40 followed by a dramatic decline to the level seen in newborn. The laminar analysis revealed striking changes in expression. At P1, NGF mRNA was highest in layers IV and VI. By P5, NGF mRNA was lowest in layer IV. Again, this was a true laminar shift because the expression in the total cortex lysate did not change between P1 and P5. At P10, NGF mRNA was expressed in about equal amounts in the four laminar compartments. By P20 supragranular layers II/III displayed the strongest expression, and layer VI was lowest. The supragranular-high to infragranular-low gradient became even steeper in the adult cortex (Fig. 5D).
Discussion
Our results show quite dramatic laminar changes of NT3, NT4 and NGF mRNA expression in the developing visual cortex, both in the presence and in the absence of concurrent changes in the expression level in total cortex lysates. For instance, the expression strength of BDNF and TrkB mRNA did not change in the layers, although both mRNA underwent developmental expression changes. By contrast, the relative expression strength of NT3 and NGF mRNA amplified in the very same sets of cDNA libraries showed dramatic laminar shifts in the absence of changes in the total level. The tissue sampling procedure is similar to laser microdissection followed by PCR, but the total yield is high enough to synthesize layer-enriched cDNA libraries that serve to amplify many mRNAs of interest in direct comparison.
A general point of discussion concerns the dendritic export of neurotrophin and TrkB mRNA. These mRNAs were detected by our PCR approach, but are possibly not seen by histology in brain sections, leading to certain discrepancies with previous findings (see below). Therefore, our developmental laminar changes are not solely the results of changes in somatic expression. This accounts in particular for BDNF and TrkB (Tongiorgi et al., 2006). Whether or not the other neurotrophin mRNAs are transported into dendrites is currently unknown. However, all four peptides are secreted from dendrites in part in an activity-dependent manner (Brigadski et al., 2005) to act on synaptic plasticity (see Lessmann et al., 2003 for review).
BDNF mRNA expression
The developmental BDNF expression profile confirms previous studies (Castren et al., 1992; Schoups et al., 1995; Gorba et al., 1999). The massive increase during the critical period for visual plasticity is apparently due to an equal upregulation in all four laminar compartments. In situ hybridization revealed about equal staining intensities in all layers in young rat visual cortex (Tropea et al., 2001). BDNF mRNA redistribution from layers V/VI to layers II/III reported around eye opening in the cat visual cortex (Lein et al., 2000) did not occur in rat, and could be a species difference. Further, the numerical decrease of BDNF mRNA-expressing neurons in adult rat (Capsoni et al., 1999) was not mirrored in our analysis. Possibly, any decline in somatic expression strength is compensated by BDNF mRNA transported into dendrites (Tongiorgi et al., 2006).
TrkB mRNA expression
Developmental TrkB mRNA expression was biphasic. A high expression in the newborn was expected because TrkB receptor-mediated signalling is strongest at this age (Knuesel et al., 1997). However, the transient decrease at P5 was surprising. A methodological artefact is unlikely because other mRNAs either remained constant or increased at these time points. The transient decrease might relate to the gradual disappearance of cohorts of migrating cortical pyramidal cells and interneurons that commence laminar formation and settle in the layers, respectively, and migration is TrkB-dependent (Behar et al., 1997; Gates et al., 2000; Polleux et al., 2002). However, the decrease remains peculiar with respect to the observation that BDNF and NT4 expression concurrently increase, and the BDNF increase is likely driven by sensory stimulation. The increase in ligand expression might be temporally compensated by a decrease in receptor expression either to protect immature neurons at this developmental stage or to dampen the morphogenetic actions of the ligands. Cortical layers have largely formed at about P10. Now TrkB mRNA expression started to increase to peak levels during the critical period of visual plasticity, and this upregulation apparently proceeds in all layers as laminar differences or expression shifts were not observed. Similar results were obtained with hybridization histology (Tropea & Domenici, 2001), suggesting that staining differences in the cortical layers are due to neuronal size. Densely packed small neurons, e.g. of layer IV, produce the same amount of mRNA than loosely packed large neurons of layer V. Moreover, TrkB mRNA is transported into dendrites (Tongiorgi et al., 2006) that grow dramatically between P5 and P20, possibly masking any developmental layer-specific transcriptional differences. After the critical period, TrkB mRNA expression decreased, and the adult level was similar to that seen at P5. This is in line with data showing that the amount of TrkB protein in the adult is similar to amounts observed shortly after birth (Tropea & Domenici, 2001).
NT4 mRNA expression
The NT4 mRNA expression increased 2.5-fold after birth, and earlier than the major BDNF increase. Hybridization data claim NT4 mRNA selectively in layer IV of somatosensory cortex (Bozzi & Borrelli, 1999). However, the PCR detected NT4 mRNA in all layers gradually accumulating with age in supragranular layers. It might be possible that the NT4 mRNA escapes in situ hybridization because it is targeted to dendrites, and supragranular layers certainly have a rich dendritic neuropil. Yet, NT4 mRNA was expressed in the thalamorecipient layers IV and VI. Cortically infused NT4 accelerates somatic maturation and prevents shrinkage of geniculocortical neurons after monocular deprivation (Riddle et al., 1995; Wahle et al., 2003). This suggests that the NT4 actions on thalamic neurons and functional stabilization of deprived-eye afferents after monocular deprivation (Lodovichi et al., 2000) are biological actions. NT4 is supplied to thalamic neurons by layer IV and VI target neurons or with anterograde delivery by layer VI corticothalamic projections. Besides, the TrkB ligands may also serve other afferent systems, because, for instance, basal forebrain and noradrenergic projections express TrkB receptors (Alderson et al., 1996).
NT3 mRNA expression
Postnatal cortical NT3 expression is controversially discussed. NT3 is expressed prenatally followed by a transient expression of mRNA and protein in the early postnatal rat cortex (Lauterborn et al., 1994; Katoh-Semba et al., 1998), whereas Kaisho et al. (1994) report only marginal amounts of NT3 protein after birth. In cat visual cortex, NT3 mRNA-expressing cells become detectable in layer IV around eye opening, but levels decrease until the end of the critical period (Lein et al., 2000). Our results now reveal that NT3 mRNA is fairly constantly expressed during postnatal development, confirming data by Vigers et al. (2000). However, the relative strength of expression showed dramatic laminar shifts. Transient peaks occur at P1 in layer VI, and at P5 in layer IV; the latter is in line with Lein et al. (2000), albeit it occurs earlier than in the cat. In rat, the peaks correlate with the ingrowth of thalamic afferents (Kageyama & Robertson, 1993; Lund & Mustari, 1997). Thalamic TrkC receptor expression increases after birth until P7, and decreases until P30 (Ringstedt et al., 1993; Altar et al., 1994). NT3 signalling seems essential for thalamocortical projections. NT3 promotes the growth of thalamic axons in all cortical layers of a P7 cortex slice adjacent to the thalamic explant (Hanamura et al., 2004). The strongest elongation is seen in supragranular layers, which at P7 presumably have acquired a higher NT3 protein production because the mRNA expression peak has shifted to upper layers. In contrast, NT3 knockout mice show misrouting of afferents and deficits in synaptic interactions resulting in cortical blindness (Ma et al., 2002). Later, NT3 seems to become less important because it does not prevent ocular dominance shifts after monocular deprivation (Lodovichi et al., 2000). Further, the expression shifts of NT3, NT4 and NGF correlate with the ‘inside-out’ gradient of morphogenesis (Miller, 1981), arguing for autocrine and paracrine dendritogenetic actions (McAllister, 2001; Wirth et al., 2003).
NGF mRNA expression
Cortical NGF is important for basal forebrain afferents that retrogradely transport NGF (Domenici et al., 1994) for synthesis of acetylcholine, an essential transmitter for cortical morphogenesis (Hohmann & Berger-Sweeney, 1998) and function. NGF mRNA expression increased after birth and was high during the critical period, confirming previous results (Large et al., 1986). Cholinergic fibres invade layer VI perinatally, which corresponds to the NGF peak at P1 in layer VI. The fibres innervate all cortical layers by P6 (Calarco & Robertson, 1995) and become mature at about P30 (Mechawar & Descarries, 2001). NGF mRNA expression was present in all layers, but during the critical period and in the adult became most prominently expressed in supragranular layers, whereas expression in layer VI became low. In fact, the adult supragranular layers display the highest and layer VI the lowest cholinergic fibre density (Eckenstein et al., 1988). The massive NGF expression at P1 in layer IV seems not directly correlated with maturation of cholinergic afferents. However, even a diffuse supply of NGF via intracerebroventricular injections has been shown to promote the correct target innervation of cholinergic afferents in NGF-deficient mice (Phillips et al., 2004), suggesting that any spatially restricted source could also serve the purpose. Later in development, refinement or maintenance of cholinergic synapses might require local NGF signals in the main target layers. An alternative function for the transient NGF peak in layer IV could be the induction of cholinergic receptors. NGF promotes the expression of α3, 4, 7 and β2, 4 nicotinergic cholinergic receptors (Henderson et al., 1994), and α3/β4 receptors become strongly expressed in layer IV shortly after birth (Winzer-Serhan & Leslie, 1997). A spatially restricted expression of NGF could thus enhance the responsiveness of layer IV neurons to the maturing cholinergic input. Moreover, the NGF peak might serve ingrowing noradrenergic fibres that are known to express TrkA and to retrogradely transport NGF (Van Bartheld et al., 1996), and which accumulate below the cortical plate shortly after birth (Latsari et al., 2002).
The question is how the transient neurotrophin peaks become induced. Possibly, the glutamatergic thalamic input contributes to the transient upregulation of NGF in layers VI and IV because the fibres arrive in their target layers shortly before these layers display the NGF peaks, and NGF is induced by activity (Thoenen, 2000). In turn, the NGF peak in layer IV at P1 might have promoted the NT3 peak observed in the same layer at P5 because NGF promotes NT3 expression (Patz & Wahle, 2004). Specific inductive properties of afferent systems and the possible involvement of anterogradely supplied factors remain to be determined.
Acknowledgements
This work was supported by DFG SFB 509 and GRK 736. We thank M. Diße for technical help.
Abbreviations
-
- BDNF
-
- brain-derived neurotrophic factor
-
- Eag2
-
- ether a go-go potassium channel
-
- G6PDH
-
- glucose-6-phosphate dehydrogenase
-
- NGF
-
- nerve growth factor
-
- NT3
-
- neurotrophin 3
-
- NT4
-
- neurotrophin 4
-
- P
-
- postnatal day
-
- PARV
-
- parvalbumin
-
- PCR
-
- polymerase chain reaction
-
- RT
-
- reverse transcriptase
-
- TrkB/C
-
- tyrosine receptor kinase B/C


