Functional segregation of plural regions representing cardinal contours in cat primary visual cortex
Abstract
Our previous data based on an imaging study suggested that, in cat area 17, the representations of cardinal orientations overlap less than the representation of their nearby angles. The purpose of this study was to further investigate the underlying single-cell properties. Optical imaging was performed first to map the cortical regions corresponding to the four principal contours, the two cardinals and the two obliques. The cortical region activated by a principal orientation but not by the +10° or −10° neighbouring angles, namely the area with optically relative independent orientation selectivity (RIOS), was mapped together with the regions that overlapped with the +10° and/or −10° neighbouring angles (non-RIOS). Electrode penetrations were targeted to the RIOS and non-RIOS regions in each of the four orientations. A comparison between the RIOS and the non-RIOS regions documented a significantly higher percentage of cells with the orientation preference of the cardinal orientations in the cardinal RIOS region than that seen in the other regions. Additionally, the difference in the tuning width of cells between the RIOS and non-RIOS in the cardinal region was significantly larger than the difference between the RIOS and non-RIOS in the oblique region. The cells in the cardinal RIOS region were tuned more sharply and the cells in cardinal non-RIOS region more broadly than the oblique RIOS and/or the non-RIOS region, which showed no significant difference. These data strongly suggest the existence of functional segregation in the region corresponding to the cardinal contours.
Abbreviation
-
- RIOS
-
- relative independent orientation selectivity
Introduction
Extensive attempts have been made to explain the neurobiological basis of the greater sensitivity of the visual system to vertically or horizontally orientated information than to information presented at oblique angles. Recent imaging studies reported unequal representation of cardinal and oblique contours in the primary visual cortex. Investigators reported that, in both developing and adult cats or ferrets, larger areas were activated by horizontal and vertical contours than by oblique contours (Chapman et al., 1996; Rao et al., 1997; Chapman & Bonhoeffer, 1998; Coppola et al., 1998; Müller et al., 2000; Dragoi et al., 2001; White et al., 2001; Wang et al., 2003a; Wang et al., 2003b). Some physiological single-cell studies in the primary visual cortex (V1) of monkey (Poggio & Fischer, 1977; Mansfield & Ronner, 1978; De Valois et al., 1982) and the cat (Pettigrew et al., 1968; Kennedy & Orban, 1979; Payne & Berman, 1983; Bauer & Jordan, 1993; Li et al., 2003) have reported that more cortical cells tend to display horizontal or vertical than oblique preferences. However, other investigations in monkeys and cats failed to find significant differences in the numbers of cells tuned to different orientations (Campbell et al., 1968; Hubel & Wiesel, 1968; Rose & Blakemore, 1974; Finlay et al., 1976; Poggio et al., 1977). Differences in orientation tuning specificity have also been studied. Neurons in V1 with horizontal or vertical preferences have been reported to exhibit narrower orientation tuning widths (Rose & Blakemore, 1974; Nelson et al., 1977; Kennedy & Orban, 1979; Orban & Kennedy, 1981). In other studies, however, orientation-specific differences in tuning width were not observed (Finlay et al., 1976; Mansfield, 1974).
One possible explanation for the controversy could be that anisotropies are only exhibited in a subpopulation of neurons. It has been reported that the orientation preference anisotropy is exclusively due to simple cells (Rose & Blakemore, 1974; Nelson et al., 1977; Orban & Kennedy, 1981) although other studies do not agree with this theory (Albus, 1975; Payne & Berman, 1983) and, spatially, the controversy might be because of the difference in recording sites. It has been reported that the anisotropies are only true in the foveal region and not in the periphery (Mansfield, 1974; Leventhal & Hirsch, 1977; Kennedy & Orban, 1979; Orban & Kennedy, 1981). Also, there are several studies which indicate that there was a difference in the cell orientation tuning property; for example, adjacent cells in a ‘pinwheel’ centre display large differences in orientation preference (Maldonado & Gray, 1996; Maldonado et al., 1997).
In our previous studies which were based on a signal extraction method for a single stimulus condition (Wang et al., 1996; Wang et al., 1998), quantitative comparisons were performed to evaluate activation areas for each orientation. We have found, on the average, cardinal orientations activated 7.81% more cortical area than did oblique orientations, and the representation of cardinal contours in cat area 17 overlaps less the representation of their nearby angles than do the oblique contours (Wang et al., 2003a; Wang et al., 2003b). For each of the four principal axes, the overlap with the +10° or −10° neighbouring angles was investigated. Interestingly, a cortical region was activated by one of the four principal orientations without interaction with the +10° or −10° neighbouring angles, thus confirming an area with an optically relative independent orientation selectivity (RIOS). Additionally, the areas activated by horizontal and vertical contours displayed less overlap with neighbouring angles than was found for the two oblique contours, and this area had a larger size than that for the oblique. To examine the details of this region, we applied single-cell recordings at these specific plural regions under the guidance of optical imaging results.
Materials and methods
Anaesthesia
Anaesthesia was induced using ketamine hydrochloride (10–20 mg/kg body weight, i.m.) Throughout both optical imaging and single-cell recording sessions, animals were immobilized using pancuronium bromide, and anaesthesia was maintained under artificial ventilation with a 70 : 30 mixture of N2O and O2, supplemented with isoflurane (up to 2%). The level of anaesthesia was monitored by electrocardiography. Atropine sulphate was administered subcutaneously to reduce salivation. End-tidal CO2 was maintained at 3.8–4.2%. Body temperature was kept constant at 38 °C using a thermostatically controlled heating pad. Continuous infusion of glucose–Ringer solution via a gastric catheter compensated for fluid loss. All wound margins were infiltrated with lidocaine. In most cases, recordings from each cat continued for ≈ 24 h, with the cats killed with an injection of an overdose of pentobarbital sodium (80 mg/kg, i.v.) at the end of the experiment. Cats were cared for in accordance with the Guiding Principles for the Care and Use of Animals in the Field of Neuroscience of the Japan Neuroscience Society and the regulations of Kagoshima University Animal Care Committee.
Optical imaging of intrinsic signals
For optical imaging, a chamber 18 mm in inner diameter was fixed to the skull and centred on the midline (Horsley-Clarke P5). The optics of the eyes were measured to select appropriate contact lenses, and photographs of the fundus were taken to determine the position of the fovea prior to recording. Pupils were dilated with local application of 0.5% tropicamide and 0.5% phenylephrine. Corneas were covered with contact lenses of an appropriate power to focus the image on a 22-inch MultiSync FP1350 CRT display (NEC, Japan) positioned 57 cm from the eyes onto the retina. The skull and dura in the chamber were removed to expose the region for imaging. The chamber was sealed using a glass coverslip and filled with silicone oil to minimize movement of the brain during recording. Response images were obtained using light tuned to 605 nm (bandwidth 10 nm). Light from a tungsten lamp was directed through an interference filter and guided to the chamber through a fibreoptic bundle. Reflected images from the cortical surface were obtained using a high-resolution video capture board equipped with a charge-coupled device (CCD). Two commercially available lenses with large numerical apertures were connected face-to-face to focus the image onto the detector chip of the CCD camera (Ratzlaff & Grinvald, 1991). The size of the imaged area was adjusted by selecting an appropriate combination of lenses with differing focal distances of 35 and 50 mm. The CCD camera was focused on a plane 300 µm below the cortical surface.
Large field (31° × 40°) binocular stimulation was performed. Stimuli comprised full-screen square-wave gratings drifting back and forth at 1.5 °/s, presented in eight different orientations: starting from the horizontal at 0, 22.5, 45, 67.5, 90, 112.5, 135 and 157.5°. Spatial frequency ranged from 0.5 to 2.0 cycles/°. The same spatial frequency was used for all orientations in a given recording session. Stimuli were randomly interleaved, and each was generally presented 40 times. In one trial, a uniform grey screen was displayed on the monitor for the first 3 s, followed by the stimulus for 5 s. After that, the screen was changed to the uniform grey screen again as the acquisition of data was completed. In order to prevent intertrial influence from previous stimulus presentation, the grey screen was displayed between trials for at least 13 s. All stimuli were presented on a 22-inch MultiSync FP1350 CRT display (NEC, Japan) under the control of a personal computer with a spatial resolution of 1600 × 1200 pixels and a frame rate of 85 Hz.
We considered the possibility that artifacts might arise from the characteristics of the CRT monitor used for the stimulus presentation, for example, aliasing problems which are only seen in oblique lines and not in cardinal lines. Experiments were performed with the monitor tilted at 45° relative to the cat. Thus in this situation the former oblique stimuli drove the cardinal columns while the cardinal stimuli drove the oblique columns. From four hemispheres of two cats, we performed optical imaging during the presentation of 0-, 45-, 90- and 135°-orientated lines using both monitor positions. Activated areas responding to the 0, 45, 90 and 135° lines displayed high correlation coefficients (0.984 for cat 1, left hemisphere; 0.995 for cat 1, right hemisphere; 0.997 for cat 2, left hemisphere; 0.991 for cat 2, right hemisphere) between the four activated area values obtained with the upright and tilted monitor. In response to identical stimuli in the hemisphere, the difference in the cortical size between those obtained with the upright and the tilted monitor was ≈ 1.2%. Thus to exclude the possibility of CRT artifacts, in this study, the oblique contours were presented using a CRT monitor with cardinal lines but with the monitor tilted at the targeted angles.
Data analysis was performed using MATLAB (The MathWorks, USA). Raw images from individual trials were visually inspected to remove distorted images in which signals had overshot the dynamic range of the amplifier. Binning (2 × 2 pixels combined into a single pixel) was performed in some cases, but no further spatial filtering was performed prior to statistical evaluation of the activation points. The cumulative mean was obtained for stimulus image data recorded 500–3000 ms postpresentation to allow for the delay of the intrinsic signal after stimulus presentation and the optical signal self-sustaining time. To compute the t-map, the response image for each orientation was first paired with the image obtained just before presentation of the stimulus. The t-value was then computed on the pixel base between the two data sets, and intensity values were replaced with the corresponding t-values to construct t-maps.
Single-cell recordings
After optical imaging, unit recording was performed extensively in the same area as the optical imaging. Extracellular recording with microelectrodes of single-cell activities were made according to the methods described previously (Kobatake et al., 1998). Topography of visual field representations within the striate cortex was determined by relating positions of receptive fields for single neurons or small clusters of neurons to locations of corresponding recording sites. Receptive field positions were determined by manually moving small rectangles of light of various sizes and orientations. Penetrations were targeted to a region and guided according to the results of the optical imaging. Recording was from whole layers, but a subset sampled from upper cortical layers (above 700 µm) was used in this study. After a single unit was identified by the waveform of its response, the receptive field size, optimal spatial frequency and orientation were measured quantitatively using sinusoidal gratings. Orientation tuning curves were measured using drifting gratings at the optimal size and spatial frequency for each cell. Gratings drifted at a temporal frequency of 2 Hz and were presented monocularly to the dominant eye. Contrast was chosen to elicit a robust response. The cell's response to a different stimulus orientation ranging from 0 to 360° in 15° steps was recorded. Stimuli were intermixed and presented 10 times, for durations of 1 s, with 2-s blank intervals between trials. The magnitude of the responses was determined as mean firing rate during stimulus presentation minus the spontaneous firing rate during the 1-s period immediately preceding stimulus presentation. Considering response latency, the time window for response was shifted within a range of 0–250 ms from the precise onset of stimulus presentation, to maximize mean firing rate. The statistical significance of responses was determined by comparing mean firing rates within the window for 10 individual responses with 10 spontaneous firing rates immediately preceding each stimulus presentation, using the Kolmogorov–Smirnov test. Optimal orientation and tuning width (full width at half height) were estimated from a Gaussian fit to the orientation tuning data by use of the maximum likelihood method. According to the goodness of fitting, cells were classified into three types. Cells were classified as type A if a single Gaussian function could explain > 90% of the variance. Type C cells were those without clear tuning, for which the values for the (maximal response − minimal response)/(maximal response) were < 20%. The cells other than type A or C were defined as type B.
Evaluation of the activity map for a single orientation
In order to facilitate quantitative comparisons, a method proposed previously was used to extract activation regions (Wang et al., 2003b). This method uses both amplitude of optical changes and statistical significance of resulting data to evaluate activation. An amplitude map was obtained by dividing responses to a single orientation by a composite map constructed using mean responses to all eight orientations. To quantitatively define responsive areas, a threshold was selected based on the threshold vs. the extracted area curve. When the threshold was increased from minimum (Min) to maximum (Max) intensity among all eight images obtained during presentation of the contours with the eight orientations, the extracted area changed from 0 to 100% of the cortical area. In the 40–70% range of (Max − Min), the relationship between the threshold and extracted area were almost linear. In this study (1 − 1/e) of (Max − Min) was used to calculate the threshold. We calculated the (1 − 1/e) × (Max − Min) intensity value for each image and the delineated points displaying this value. Contours delineated by these spots were referred to as 1/e-drop contours.
The amplitude map is highly sensitive to fluctuations in the cortical surface, such as those occurring with pulsations or movement. In addition to the amplitude map, a statistical parametric map, t-map, was introduced to evaluate the response. In the curve of the threshold at the level of significance vs. extracted area for all cases, with a decreasing level of statistical confidence, which corresponds to a lower t-value, the extracted area changed from 0% to 100% of the cortical area. In the range from t = −4.5 to t = −1.0, the change in area size was close to linear. In this study, the widely accepted value of P < 0.05, corresponding to t = −1.68 (stimulus repetitions = 40), was selected as the threshold for the t-map to denote the significance of optical changes.
The activation area for each single stimulus was that area both included in the 1/e-drop contour and displaying a t-value with P < 0.05.
Results
Recording site and the RIOS/non-RIOS regions
Six young adult cats ranging in size from 2.5 to 3.5 kg were used in the present study. Experiments were performed on area 17 under aseptic conditions. Analysis was focused on the central area retinotopically corresponding to the eccentritis, ≈ 0–15°. Single-cell recording was performed in one cat to confirm that the corresponding cortical region was in the central vision. An example is shown in Fig. 1, with Fig. 1b illustrating the receptive fields recorded at the cortical location shown in Fig. 1a. Recordings were made from the right hemisphere, with receptive fields extending from −1° to +2° azimuth and from −2° to +4° elevation. As in previous reports, representation of the area centralis was located on the crown of the lateral gyrus near the junction of the lateral and posterior lateral gyri. The lower vertical meridian was represented rostrally, whereas representation of the upper vertical meridian extended caudally along the posterior lateral gyrus onto the tentorial surface and finally into the posterior portion of the splenial sulcus. Representation of the horizontal meridian extended across the lateral gyrus onto the interhemispheric surface, into the superior bank of the middle portion of the splenial sulcus and finally into the fundus of the same sulcus.
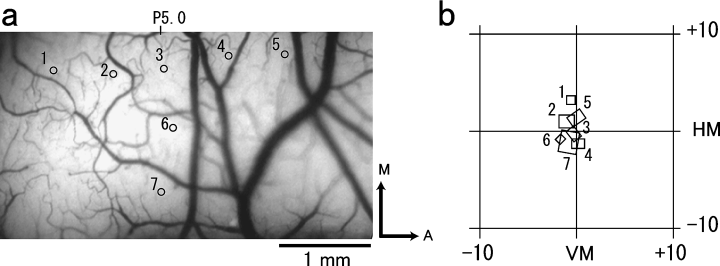
Mapping of imaged area with multiple electrode penetrations. (a) Blood vessel map showing electrode penetration sites. In a right hemisphere, the numbers from 1 to 7 represent the seven penetrations that were performed in the area used for optical imaging, centred at Horsley-Clarke P5. (b) Electrophysiological mapping of the visual field representation within the imaged area. Numbers correspond to numbers shown in (a). Scale bar, 1 mm.
To determine the electrode penetration sites, optical imaging was performed before extensive single-unit recording. Optical imaging was made from both hemispheres simultaneously. A typical exposed area on each hemisphere was ≈ 5 mm wide and 10 mm long. Response images were obtained during the presentation of contours at orientations of 0, 22.5, 45, 67.5, 90, 112.5, 135 and 157.5°, and +10 and −10° around the four principal orientations of 0, 45, 90 and 135°. The cortical area that showed optical response to the presented contours was defined as the ‘0° region’, the ‘45° region’ and so on. In each of these regions, the cortical region was further separated based on whether or not the area overlapped with the representations of the +10 or −10° angles. As shown in Fig. 2, the area that responded only to the presented orientation but not to the +10 and/or −10° separated angles, namely the RIOS area, is indicated by the red colour. The remaining part is referred to as the ‘non-RIOS’ in this paper and is indicated by yellow in the figure. For example, the ‘RIOS 45° region’ indicates the region that showed an optical response only to a 45° oblique contour, and not to 35 or 55° contours. The ‘non-RIOS 45° region’ indicates the region that optically responded to the 45° orientation as well as to both or one of the two 10° separated angles.
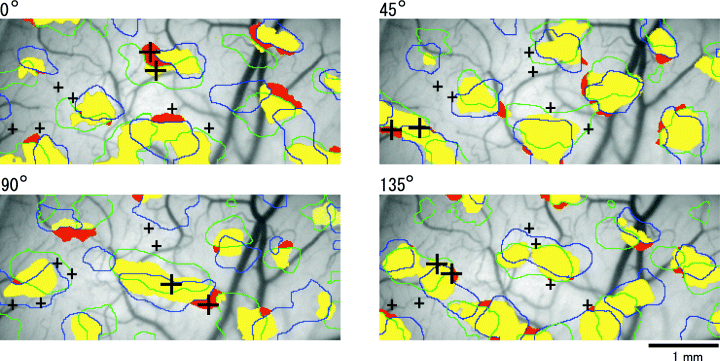
Maps showing electrode penetration sites. Orientation selectivity of cortical regions extracted during presentation of the 0, 45, 90 and 135° contours. Overlap of areas evoked by each of the four principal orientations and +10°- and −10°-orientated grating were plotted. Activation area for the presentation of the principal angles is plotted in yellow. Contours for +10° and −10° were plotted in green and blue contours, respectively. Red indicates the area activated by the principal angle but not by +10°- or −10°-separated orientation. The electrode penetration sites are marked by crosses. Extracted regions are superimposed on the vessel images. In each of the four maps, at least two penetrations, one in the RIOS region and one in the non-RIOS region, were performed as indicated by the large crosses. Scale bar, 1 mm.
Cell properties in cardinal RIOS, cardinal non-RIOS, oblique RIOS and oblique non-RIOS regions
Single-unit recording was performed after optical imaging, and the penetrations of electrodes were targeted to the RIOS and non-RIOS regions in the 0, 45, 90 and 135° regions. An example is shown in Fig. 2. In a total of the 12 hemispheres from six cats, 421 cells were recorded from 119 penetrations. In 119 penetrations, 35 penetrations were made in the cortical region that showed an optical response to 0° contours, 31 were from the 45° region, 27 were from the 90° region and 26 were from the 135° region. In each of the regions, the penetrations were made in both the RIOS and non-RIOS regions. This therefore resulted in 52 cells that were recorded from the RIOS 0° regions, 50 cells from the non-RIOS 0° region, 56 cells from the RIOS 45° region, 49 cells from the non-RIOS 45° region, 60 cells from the RIOS 90° region, 47 cells from the non-RIOS 90° region, 52 cells from the RIOS 135° region and 55 cells from the non-RIOS 135° region.
The responsiveness of cells recorded in the 0, 45, 90 and 135° regions was investigated. Cells were classified as responsive if there was a statistical significance in the spiking rate during the presentation of the test orientation as compared to the spontaneous spiking rate, irrespective of whether it was the maximum in all the tested orientations. The percentages of unresponsive cells were 9.6% in the 0° region, 8.0% in the 45° region, 8.9% in the 90° region and 10.2% in the 135° region. Therefore, the percentages of responsive cells were 90.4% in the 0° region, 92.0% in the 45° region, 91.1% in the 90° region and 89.8% in the 135° region. For all the cases, the variation in the percentage among the four regions was small. Comparisons were done for all the possible pairs, and no statistically significant difference was found in any pair (P > 0.082).
In each of the four regions, the cells that showed electrophysiological responses to the orientation-evoked optical changes could be classified into three types according to their tuning curves. The percentages of type A, type B and type C cells were plotted and are shown in Fig. 3. In all of the regions, regardless of the angle or whether it was in the RIOS or not, type A cells made up the largest proportion of the cells, with type B and type C cells being equally divided in the remaining portion. The (mean ± SEM) percentage of type A cells was 78.4 ± 1.3%, type B was 10.8 ± 2.1% and type C was 11.1 ± 1.6%. No difference was found between any pair of RIOS and non-RIOS points in each of the four regions, or between the cardinal and oblique orientations.
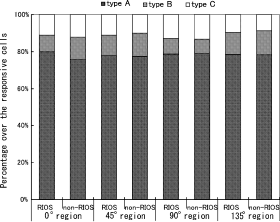
Distribution of cell types in the RIOS and non-RIOS regions of the 0, 45, 90 and 135° regions. Three types of cells, according to their tuning curves, were included. No significant difference was found between any of the pairs.
Cardinal vs. oblique: optimal orientation preference of cells in the RIOS and non-RIOS regions
Examples of response properties of single units recorded in the cardinal RIOS, cardinal non-RIOS, oblique RIOS and oblique non-RIOS areas are shown in Fig. 4. To assess the variance in orientation preference, we used circular statistics (Maldonado et al., 1997). Using vectorial addition, we computed the mean and SD of the orientation preferences of all cells at each site. SD was used to evaluate the variance at each site. In the example shown in Fig. 4, neurons from the cardinal RIOS area exhibit a low variance in orientation preference whereas cells from the other areas show a large variance. The mean ± SD of the standard deviations in the cardinal RIOS, cardinal non-RIOS, oblique RIOS and oblique non-RIOS regions were 12.4 ± 8.8, 15.6 ± 7.9, 15.1 ± 8.7 and 14.8 ± 7.6, respectively. Although statistical significance was not confirmed, the SD in the cardinal RIOS had a much smaller average value than that seen for the others.
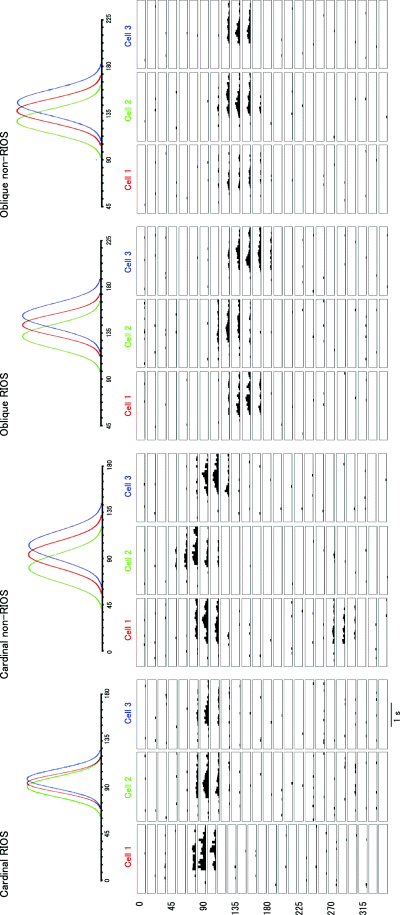
Examples of response properties of single units recorded in the cardinal RIOS, cardinal non-RIOS, oblique RIOS and oblique non-RIOS areas. Three neurons recorded in each of the areas are shown. Numbers (1, 2 and 3) and colours are used to label the tuning curves from cells whose peristimulus time histograms (PSTHs) are shown below. In this example, neurons from the cardinal RIOS area exhibit a wider variance in orientation preference, and neurons from the cardinal non-RIOS area have a broader tuning width.
A summary of the cell selectivity properties is shown in Fig. 5. In Fig. 5a, in the 0° region and the 90° region, 95.7 and 95.9% of the type A cells recorded in the RIOS region were tuned maximally to the horizontal and vertical contours, respectively. However, only 89.1 and 88.4% of the type A cells recorded in the 0 and 90° non-RIOS region showed maximal responses to the horizontal and vertical contours, respectively. However, in the case of the oblique region, the percentages in both the RIOS region and the non-RIOS region exhibited similar numbers (45° RIOS, 88.2%; 45° non-RIOS, 88.6%; 135° RIOS, 87.5%; 135° non-RIOS, 86.8%).
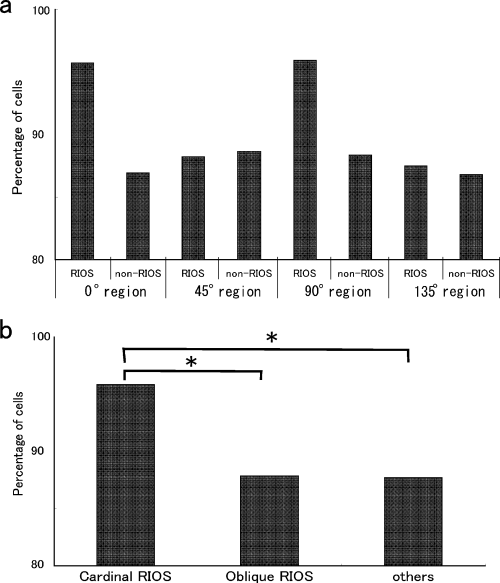
The percentage of type A cells that showed electrophysiological responses optimally to the orientation-evoked optical changes in the cardinal RIOS, cardinal non-RIOS, oblique RIOS and oblique non-RIOS regions. (a) The proportion of type A cells was further divided into those recorded in the RIOS and those in the non-RIOS regions. (b) Reorganization of graph (a). Comparison was made among the cardinal RIOS, oblique RIOS and other regions. *P < 0.05.
The data are regrouped in Fig. 5b according to the cardinal RIOS, oblique RIOS and non-RIOS regions. The percentage of cells tuned to the cardinal orientations in the cardinal RIOS region was as high as 95.8%. In the oblique RIOS region, it was 87.9%, which was very similar to the percentage in the non-RIOS region, 87.7%. A χ2 test was performed to test the statistical significance of the difference between the cardinal RIOS and the other areas. Significant differences were found between the percentages of cardinally tuned type A cells in the cardinal RIOS and oblique RIOS regions (χ2 = 4.197, d.f. = 1, P < 0.05), and the cardinal RIOS and non-RIOS regions (χ2 = 5.277, d.f. = 1, P < 0.05). However, no significant difference was found between the oblique RIOS and non-RIOS regions (χ2 = 0.01, d.f. = 1, P = 0.919). Cardinal RIOS exhibited a difference from the other cortical regions.
The results were consistent over the hemispheres. A comparison was made between the percentages of the cells recorded in the RIOS and non-RIOS regions. In each of the principal four angles, the percentages in both hemispheres from the six cats were examined by comparing the RIOS vs. the non-RIOS data. In 10 of the 12 hemispheres in the 0° regions, a higher percentage was observed in the RIOS region, and a lower percentage was recorded in the non-RIOS. In the 90° region, the cell percentage was also higher in the RIOS than non-RIOS region in 10 of the 12 hemispheres. In the cortical area responding to the cardinal contours, a consistently higher percentage was observed in the RIOS than in the non-RIOS region. In contrast, in the regions that showed an optical response to the 45 and 135° contours, in five out of 12 and six out of 12 hemispheres, respectively, cell percentages in the RIOS region were higher than in the non-RIOS region. This implies that no clear bias was confirmed between the RIOS and non-RIOS region in the cortical area that showed an optical response to the oblique contours.
Cardinal vs. oblique: tuning width difference of the cells in the RIOS and non-RIOS regions
To further understand the tuning property, we investigated the width of tuning curves for the cells recorded in various sites. The results for the cells recorded in the total 0, 45, 90 and 135° regions were compared first. The means and SDs for the widths of tuning were 32.0 ± 7.6, 33.0 ± 5.6, 33.1 ± 7.9 and 32.7 ± 5.4°, respectively. No significant difference was found between any pair among these four results. However, when we were further divided the regions into RIOS and non-RIOS parts (as plotted in Fig. 6a), the tuning width in the 0 and 90° RIOS regions showed lower values (0°, 27.8°; 90°, 28.8°) than the tuning width of the cells in the other regions. In contrast, the cells in the 0 and 90° non-RIOS region were tuned more broadly than those in the others (0°, 36.9°; 90°, 38.5°). In the two oblique regions, cells had similar tuning widths (RIOS 45°, 33.0°; non-RIOS 45°, 33.0°; RIOS 135°, 33.0°; non-RIOS 135°, 32.3°).
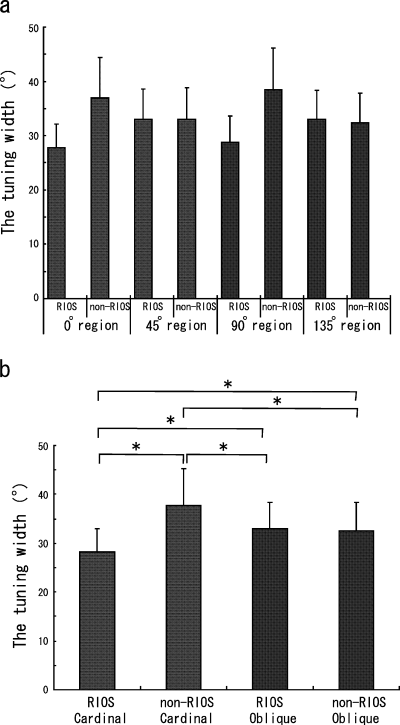
Summary of cell orientation tuning width. Averaged tuning width of the cells recorded in the RIOS and non-RIOS regions in the 0, 45, 90 or 135° regions. Reorganization of graph (a). *P < 0.0001.
The results obtained from the cells recorded in the RIOS and non-RIOS regions were combined and are shown in Fig. 6b. The 0 and 90° regions were combined as the cardinal group, and the 45 and 135° regions were combined as the oblique group. In the cardinal region, the mean and SD values were 28.3 ± 4.6 and 37.7 ± 7.6° in the RIOS and non-RIOS regions, respectively, and these differences were found to be statistically significant (Fisher's PLSD, P < 0.0001). In the oblique regions, the cells in the RIOS and non-RIOS regions showed similar tuning widths of 33.0 ± 5.4 and 32.6 ± 5.6°, respectively, and the difference was not significant (Fisher's PLSD, P = 0.9362). A statistically significant smaller tuning width in the cardinal RIOS region was also found when compared to the tuning width for the oblique cells (cardinal RIOS vs. oblique RIOS, P < 0.0001; cardinal RIOS vs. oblique non-RIOS, P < 0.0001) and in the cardinal non-RIOS region the tuning widths were significantly larger than those in the oblique regions (cardinal non-RIOS vs. oblique non-RIOS, P < 0.0001; cardinal non-RIOS vs. oblique RIOS, P < 0.0001). Cells in the cardinal RIOS region were tuned more sharply and cells in the cardinal non-RIOS region were tuned more broadly than those observed in the oblique regions.
Individual differences were checked and the results are shown in Fig. 7. The averaged tuning widths of cells recorded in each hemisphere were compared in an analysis of the RIOS vs. the non-RIOS. In the 0° region, cells in 11 out of the total 12 hemispheres in the RIOS region showed smaller values than the cells in the non-RIOS, which indicates that the cells in the RIOS region were tuned more sharply than the cells in non-RIOS region. Similar patterns were seen in the 90° region, where 11 of the 12 hemispheres showed narrower widths in the cardinal vs. the oblique. In the cardinal regions, in 92% (11/12) cases, cells in the RIOS region were tuned more sharply than the cells in the non-RIOS region. For both the 45 and 135° regions, seven of the 12 hemispheres showed a greater width in the RIOS than the non-RIOS region. There was no clear consistency over the hemispheres which could be confirmed.
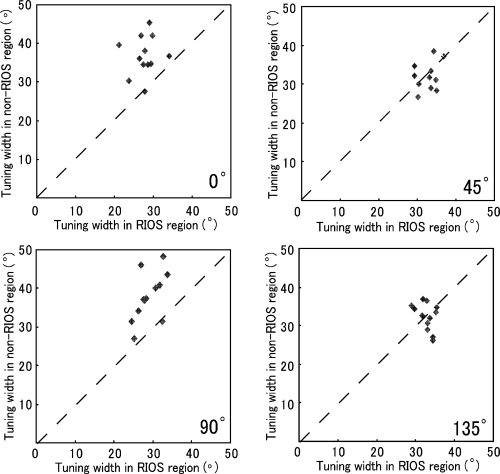
Comparison of averaged orientation tuning width for the RIOS cells vs. the averaged orientation tuning width for the non-RIOS cells. The average was taken over all the cells recorded in each of the categorized cortical regions. Each point represents one hemisphere.
Discussion
In this study, we have compared the single-cell property for the cell recorded in the cortical regions of two cardinal and two oblique orientations. Differences were not found, either in the proportion of responsive cells or in the cell orientation tuning width. However, when we separated the areas into the RIOS and non-RIOS regions an unequal representation was observed between the cardinal and oblique regions. A higher percentage of cells maximally responsive to the cardinal orientations was found in the cardinal RIOS region than the other regions, and in the cardinal region the difference in the tuning width of the cells between the RIOS and non-RIOS was significantly larger than the difference between the RIOS and non-RIOS in the oblique region. The cells in the cardinal RIOS region were tuned more sharply and the cells in the cardinal non-RIOS region were tuned more broadly than the cells in the oblique RIOS and/or non-RIOS region. The cardinal RIOS region functionally showed a clearer difference than that found for the other regions.
The RIOS regions are areas where the optical signal is strong only for a stimulus at a particular angle but weak with regard to responses to the ±10° orientation differences. One would expect that the neurons located in these regions would therefore be sharply tuned to these orientations. However, we have found this to be the case only for the cardinal orientations and not for the obliques. One possible explanation for this observation could be the contradiction that is seen between the electrophysiological and optical signals, as the former records the action potentials while the latter reflects more complex signal sources, including those for the subthreshold synaptic activity. Another possibility may be the difference in the stimuli used in the electrophysiological and optical recording sessions. In this study, instead of the optimal size that was used in the electrophysiological recording sessions, full-screen stimuli were used for the optical imaging, and this could potentially cause strong surround suppression. It is well established that both excitation and inhibition have similar orientation tuning profiles in the primary visual cortex (DeAngelis et al., 1994; Sengpiel et al., 1998; Sceniak et al., 2001; Cavanaugh et al., 2002; Walker et al., 2002; Ozeki et al., 2004). Based on these data, it is reasonable to assume that the inhibition from the cells in the cardinal non-RIOS region will have a broader tuning profile that is similar to the cells we recorded in the cardinal non-RIOS regions. This broader inhibition from the nearby cardinal non-RIOS cells may cause a stronger inhibition of the cardinal RIOS cell activity than the one that is seen for the oblique cells. Therefore, the cardinal RIOS and oblique RIOS would look similar under full-screen stimulation. Further confirmations based on other techniques such as iontophoretic administration are necessary to confirm this point.
Optical imaging experiments have revealed that orientation selectivity is not organized in parallel bands but rather in iso-orientation domains that are arranged radially in a pinwheel-like fashion in the primary visual cortex (Bonhoeffer & Grinvald, 1991). There are several studies which have shown that cells near the pinwheel centre have a large variation in orientation preference (Maldonado & Gray, 1996; Maldonado et al., 1997). In our study, the optical signal extraction method that we used was based on only a single stimulus condition and additionally the activation area was defined based on one single orientation. Because the principles of the algorithm obtaining pinwheel type of studies are different from the current study, we cannot directly compare our data with their findings. However, our results suggest that a functional segregation in the domains is selectively responding to the cardinal contours.
In the primary visual cortex of both the monkey and cat, the difference between cardinal and oblique areas remains confusing with regard to the percentage of responsive cells. Some physiological single-cell studies in the primary visual cortex have reported that more cortical cells tend to display horizontal or vertical preferences than oblique cells (Pettigrew et al., 1968; Poggio & Fischer, 1977; Mansfield & Ronner, 1978; Kennedy & Orban, 1979; De Valois et al., 1982; Payne & Berman, 1983; Bauer & Jordan, 1993; Li et al., 2003), but other studies have failed to find significant differences in the numbers of cells tuned to different orientations (Hubel & Wiesel, 1968; Campbell et al., 1968; Rose & Blakemore, 1974; Finlay et al., 1976; Poggio et al., 1977). It has been reported that anisotropies are only true in the foveal region and not in the periphery (Mansfield, 1974; Leventhal & Hirsch, 1977; Kennedy & Orban, 1979; Orban & Kennedy, 1981). In this study, the recording site was limited to the central region. We did not find any significant difference between the cortical cardinal and oblique regions in the percentage of cells responsive to the contours with the orientation that evoked an optical response. We could only confirm a difference if the region was further divided into the RIOS and non-RIOS regions. Our results may imply that even in the foveal region the difference in the electrode penetration site may produce confusing results.
In the case of orientation tuning width, there were no differences in orientation tuning width found between the cardinal and oblique but, similar to the responsive cell number data, when further separated into the RIOS and non-RIOS regions a significant difference was noted. This may explain the controversy over whether neurons in the primary visual cortex with horizontal or vertical preferences exhibit narrower orientation tuning widths (Rose & Blakemore, 1974; Nelson et al., 1977; Kennedy & Orban, 1979; Orban & Kennedy, 1981) or not (Finlay et al., 1976; Mansfield, 1974). In this study, narrower orientation tuning width was only observed in the cardinal RIOS region. Interestingly, cells in the cardinal non-RIOS region showed an even broader orientation tuning width. This feature in the primary visual cortex may be a result of the visual environment, in which more horizontal and vertical lines exists (Coppola et al., 1998; Dragoi et al., 2001).
Acknowledgements
This study was supported by Grants-in-Aid (no. 12210120, no. 12780601) from the Ministry of Education, Science, Sports and Culture of Japan to G.W.


