Electron microscopic findings in non-alcoholic fatty liver disease: Is there a difference between hepatosteatosis and steatohepatitis?
Abstract
Background and Aims: Non-alcoholic fatty liver disease has long been accepted as benign; however, recent evidence suggests that the disease may progress to cirrhosis and hepatocellular carcinoma, although the natural course of the disease is still unclear. This study was designed to comparatively evaluate electron microscopic features of non-alcoholic fatty liver (NAFL) and non-alcoholic steatohepatitis (NASH).
Methods: Quantitative and semi-quantitative ultrastructural evaluations were performed on liver biopsies from 23 patients, 10 with NAFL and 13 with NASH.
Results: No statistically significant difference was noted between NAFL and NASH patients in ultrastructural features of hepatocytes including megamitochondria, intramitochondrial crystalline inclusions, mitochondrial matrix granules, foamy cytoplasmic appearance, electron-lucent and glycogen-containing nuclear regions, lipofuscin granules, or an increased frequency of vesicles containing electron-dense material in peribiliary Golgi zone; however, the mitochondrial diameter was significantly higher in the NASH patients. Intercellular distance and microvilli between hepatocytes, collagen and electron-dense material accumulation in the space of Disse, electron-dense material accumulation and microvillus density in bile canaliculi did not differ significantly between the groups.
Conclusions: Our data show that, although NAFL and NASH can be distinguished by their distinct light microscopic features, ultrastructural characteristics are similar, which suggests that NAFL may also have the potential to progress to fibrosis and cirrhosis like NASH.
Introduction
Non-alcoholic fatty liver disease (NAFLD) describes a wide clinicopathological spectrum ranging from simple steatosis (non-alcoholic fatty liver [NAFL]) and non-alcoholic steatohepatitis (NASH) to fibrosis and cirrhosis.1–3 In 1980, Ludwig first described NAFLD in obese, nondiabetic women who did not use alcohol and whose liver biopsies showed macrovesicular steatosis with Mallory's hyaline, mixed inflammatory infiltrate and focal hepatocyte necrosis.4 Obesity, type 2 diabetes and hyperlipidemia are now recognized as the most common causes of NAFLD, with insulin resistance as the presumed etiology for pathogenesis. NAFLD is estimated to affect 15% to 24% of the general population; 5–7 prevalence rates are increased in certain subpopulations in which obesity and type 2 diabetes are common.8,9
Clinical evaluation, biochemical markers and imaging techniques are presently inadequate for diagnosing NAFLD and determining the extent of hepatic parenchymal damage. Therefore, liver biopsy remains the gold standard for assessing liver pathology and providing a definitive diagnosis. NAFLD has long been accepted as benign; however, recent evidence suggests that the disease may progress to cirrhosis and hepatocellular carcinoma, although the natural course of NAFLD is still unclear.10 Owing to its high prevalence and the possibility of progression, NAFLD is gaining increased attention worldwide.
Although liver biopsy specimens from NAFLD patients are routinely evaluated by light microscopy, electron microscopic studies that have been conducted to reveal the ultrastructural features of the disease have enrolled a limited number of patients, predominantly those with NASH.11–15 Therefore, this study was designed to evaluate electron microscopic features of liver biopsies from NAFL and NASH patients, and to perform quantitative and semiquantitative comparisons of both conditions to clarify the natural course of NAFLD.
Methods
Twenty-three patients with liver-biopsy-confirmed NAFLD were enrolled in this study, including 10 with NAFL and 13 with NASH. All patients had at least a six-month history of elevated aminotransferases without any other identifiable cause (viral infection, autoimmune disease, metabolic disorder, or alcohol use). Four patients were hypertensive and six were diabetic; two patients had both hypertension and diabetes. Of four patients with hypertension, three were using angiotensin converting enzyme inhibitors and one was using a calcium channel blocker (amlodipine). Of six diabetic patients, two were treated with dietary modification, three with biguanides (metformin), and one with insulin. Except these eight patients, none had an additional disease and/or used a concomitant medicament. The study protocol was approved by the Ethical Committee of Istanbul Faculty of Medicine. All patients provided written informed consent prior to enrollment.
Medical history, family history and physical examination were performed for each patient. Body mass index (weight [kg]/height [m2]) was calculated and waist and hip circumferences were measured. History, physical examination, and body measurements for all patients were performed by the same physician.
Blood specimens for each patient were obtained following a 12-h overnight fast. Glucose, uric acid, alanine aminotransferase, aspartate aminotransferase, alkaline phosphatase, γ-glutamyl transpeptidase, total bilirubin, triglycerides, total cholesterol, high-density lipoprotein, low-density lipoprotein, albumin, γ-globulin, high sensitivity C-reactive protein, ferritin, and whole blood counts were determined by autoanalyzer (Roche Modular System). Insulin level was determined by radioimmunoassay. Insulin resistance was calculated using the Homeostasis Model Assessment (fasting insulin [µIU/mL] × fasting glucose [mg/dL]/405).16 Patients with Homeostasis Model Assessment values greater than 1.64 were considered insulin-resistant. Presence or absence of metabolic syndrome was assessed according to the National Cholesterol Education Program Adult Treatment Panel III 2005 guidelines.17
Hepatitis B surface antigen and hepatitis C antibody were also assessed. Autoantibodies including antinuclear antibody, smooth muscle antibody, liver/kidney microsomal antibody type 1, antibodies to soluble liver antigen, and anti-mitochondrial antibody were assessed by enzyme-linked immunosorbent assay. Serum ceruloplasmin levels were assessed by radioimmunodiffusion assay, and 24-h urine copper level and tissue copper level were determined by atomic absorption.
Liver biopsies were obtained by the Menghini technique using a 16-G Braun needle. For electron microscopy, one-third of the biopsy material was cut into 1-mm3 blocks and immediately fixed in 2.5% glutaraldehyde in 0.1 M cacodylate buffer containing 0.1 M sucrose. The samples were then post-fixed in 1% osmium tetroxide and embedded in Epon. Ultra-thin sections (70 nm) were stained with uranyl acetate and lead citrate and examined under a transmission electron microscope (JEOL 1011, Japan) equipped with a CCD camera (MegaView III, Soft Imaging System, GmBH, Germany). Images were obtained and measurements were performed using image analysis software (analySIS Docu 3.2, Soft Imaging System, GmBH, Germany). Blinded quantitative and semi-quantitative hepatic ultrastructure evaluations were performed by a single electron microscopist.
In quantitative evaluations, the diameters of hepatocyte mitochondria, bile canaliculi and hepatocyte microvilli in bile canaliculi, and the intercellular distance between adjacent hepatocytes were measured for each patient. The microvillus density in bile canaliculi was calculated as the number of canalicular hepatocyte microvilli divided by the bile canaliculi area. Hepatocyte intra-mitochondrial granules were quantified. An average of 25 values was obtained per variable from at least five different electron microscopic fields per patient. The presence or absence of megamitochondria, intramitochondrial crystalline inclusions, electron-lucent and glycogen-containing nuclear regions, frequent vesicles containing electron-dense material in the peribiliary Golgi zone in hepatocytes, microvilli between adjacent hepatocytes, electron-dense material accumulation in the space of Disse and bile canaliculi were noted. The frequency of lipofuscin granules, degree of foamy cytoplasmic appearance due to glycogen accumulation and smooth endoplasmic reticulum (SER) dilation in hepatocytes, and the degree of collagen and electron-dense material accumulation in the space of Disse were semi-quantitatively determined as normal, slightly increased, moderately increased or severely increased. The frequency of hepatocyte microvilli facing the space of Disse was determined semi-quantitatively as decreased, normal or increased.
The remaining two-thirds of the biopsy material were fixed with formaldehyde and paraffin block sections were stained with hematoxylin–eosin, Masson's trichrome and Prussian blue. Histological findings were evaluated by a single pathologist according to the Clinical NASH Research Network's Pathology Committee Scoring System.18 This scoring system designates a non-alcoholic fatty liver disease activity score (NAS) of 0–2 as not diagnostic of steatohepatitis and a NAS ≥ 5 is diagnosed as steatohepatitis. NAS of 3 and 4 are divided almost evenly among the three diagnostic categories (not NASH, borderline, and NASH). In this study, 13 patients with NAS ≥ 3 were considered as having NASH, while 10 patients with NAS ≤ 2 were considered as having NAFL. Light microscopic features, NAS and fibrosis stages of patients with NAFL and NASH are shown in Tables 1 and 2, respectively.
| Patient no. | Steatosis | Lobular inflammation | Hepatocyte ballooning | NAS | Fibrosis stage |
|---|---|---|---|---|---|
| 1 | 1 | 1 | 0 | 2 | 1 |
| 2 | 1 | 0 | 0 | 1 | 0 |
| 3 | 1 | 0 | 1 | 2 | 0 |
| 4 | 1 | 0 | 0 | 1 | 0 |
| 5 | 1 | 0 | 0 | 1 | 0 |
| 6 | 1 | 0 | 0 | 1 | 1 |
| 7 | 1 | 0 | 0 | 1 | 0 |
| 8 | 1 | 0 | 0 | 1 | 0 |
| 9 | 2 | 0 | 0 | 2 | 0 |
| 10 | 2 | 0 | 0 | 2 | 1 |
- NAS, non-alcoholic fatty liver disease activity score.
| Patient no. | Steatosis | Lobular inflammation | Hepatocyte ballooning | NAS | Fibrosis stage |
|---|---|---|---|---|---|
| 1 | 1 | 3 | 1 | 5 | 2 |
| 2 | 2 | 1 | 2 | 5 | 2 |
| 3 | 2 | 1 | 1 | 4 | 1 |
| 4 | 1 | 1 | 1 | 3 | 2 |
| 5 | 1 | 1 | 1 | 3 | 0 |
| 6 | 1 | 2 | 2 | 5 | 1 |
| 7 | 2 | 1 | 1 | 4 | 1 |
| 8 | 2 | 1 | 2 | 5 | 1 |
| 9 | 1 | 1 | 1 | 3 | 0 |
| 10 | 1 | 3 | 1 | 5 | 3 |
| 11 | 2 | 2 | 2 | 6 | 1 |
| 12 | 3 | 0 | 2 | 5 | 0 |
| 13 | 2 | 1 | 2 | 5 | 0 |
- NAS, non-alcoholic fatty liver disease activity score.
Statistical analysis
For between-group comparisons, continuous variables were analyzed using the Mann–Whitney U-test and nominal and categorical data were analyzed using the χ2-test. A P-value of less than 0.05 was considered statistically significant.
Results
The mean patient age was 45.57 ± 9.70 years (range, 18–63 years). Fifteen patients (65%) were women and eight (35%) were men. Demographic and biochemical characteristics of the patients with NAFL and NASH are shown in Table 3. No significant differences were noted between NASH and NAFL patients in terms of age, sex, body mass index, or waist or hip circumference. Insulin resistance was significantly more common in patients with NASH. Glucose, insulin, triglyceride, total cholesterol, aspartate aminotransferase, alanine aminotransferase, high-density lipoprotein, low-density lipoprotein, albumin, γ-globulin, uric acid, ferritin and high-sensitivity C-reactive protein levels did not differ significantly between groups. Total bilirubin was significantly higher in NASH patients, whereas γ-glutamyl transpeptidase and alkaline phosphatase were significantly higher in patients with NAFL.
| Demographic and biochemical characteristics (mean ± SD) | NAFL (n = 10) | NASH (n = 13) | P-value |
|---|---|---|---|
| Age (years) | 47.20 ± 9.16 | 44.31 ± 10.28 | 0.456 |
| Sex* (female/male) | 7 (70)/3 (30) | 8 (62)/5 (38) | 0.673 |
| BMI (kg/m2) | 30.45 ± 6.44 | 30.23 ± 5.11 | 0.686 |
| Waist circumference (cm) | 101.80 ± 18.65 | 97.38 ± 12.26 | 0.616 |
| Hip circumference (cm) | 121 ± 24.81 | 108.54 ± 10.92 | 0.385 |
| Glucose (NR: 70–100 mg/dL) | 111.60 ± 64.84 | 107 ± 38.46 | 0.535 |
| Insulin (NR: 2.6–24.9 µIU/mL) | 15.64 ± 7.25 | 18.67 ± 9.50 | 0.535 |
| HOMA-IR | 4.64 ± 4.36 | 4.95 ± 3.15 | 0.495 |
| Insulin resistance* | 7 (70) | 13 (100) | 0.034 |
| AST (NR: 5–42 IU/L) | 47.80 ± 21.91 | 49.77 ± 19.59 | 0.515 |
| ALT (NR: 5–45 IU/L) | 82.70 ± 32.94 | 80.15 ± 21.57 | 0.828 |
| ALP (NR: 90–260 IU/L) | 249.60 ± 77.70 | 176.54 ± 56.11 | 0.044 |
| GGT (NR: 5–85 IU/L) | 108.70 ± 68.28 | 46.92 ± 28.74 | 0.018 |
| Total bilirubin (NR: 0.2–1 mg/dL) | 0.70 ± 0.24 | 0.98 ± 0.42 | 0.048 |
| Triglycerides (NR: 40–170 mg/dL) | 135.20 ± 58.20 | 144.77 ± 66.75 | 0.852 |
| Total cholesterol (NR: 130–200 mg/dL) | 237.30 ± 99.53 | 209.08 ± 34.15 | 0.877 |
| HDL (NR: 35–80 mg/dL) | 49.67 ± 15.17 | 41.15 ± 7.93 | 0.256 |
| LDL (NR: 100–130 mg/dL) | 139 ± 31.54 | 136.46 ± 27.59 | 0.664 |
| Albumin (NR: 3.2–5.5 g/dL) | 3.90 ± 0.58 | 4.16 ± 0.30 | 0.288 |
| γ-globulin (NR: 0.9–1.7 g/dL) | 1.26 ± 0.24 | 1.40 ± 0.29 | 0.608 |
| hsCRP (NR: 0–5 mg/L) | 3.13 ± 3.10 | 3.51 ± 3.05 | 0.688 |
| Uric acid (NR: 2.5–7.5 mg/dL) | 4.63 ± 1.13 | 5.34 ± 1.48 | 0.261 |
| Ferritin (NR female: 13–150 ng/mL; male: 30–400 ng/mL) | 143.76 ± 149.93 | 134.33 ± 93.78 | 0.867 |
- * Number of patients (%).
- ALP, alkaline phosphatase; ALT, alanine aminotransferase; AST, aspartate aminotransferase; BMI, body mass index; hsCRP, high sensitivity C-reactive protein; GGT, γ-glutamyl transpeptidase; HDL, high-density lipoprotein; HOMA-IR, homeostasis model assessment-insulin resistance; LDL, low-density lipoprotein; NAFL, non-alcoholic fatty liver; NASH, non-alcoholic steatohepatitis; NR, normal range.
Results from quantitative and semi-quantitative electron microscopy of liver biopsy specimens are shown in Table 4. Ultrastructurally, hepatocytes showed mitochondria with condensed matrices and reduced cristae (Fig. 1). Megamitochondria were detected in nine patients (39%) (Fig. 1), but the difference between NASH and NAFL patients was statistically insignificant. Although mean mitochondrial diameters were within normal limits, diameters were significantly higher in NASH patients compared to NAFL patients (P = 0.041). Intramitochondrial crystalline inclusions were found in 10 patients (43%) (Fig. 1); however, the difference between the two groups failed to reach statistical significance. The number of intra-mitochondrial matrix granules was not different between NASH and NAFL patients (Fig. 1).
| Electron microscopic findings (mean ± SD) | NAFL (n = 10) | NASH (n = 13) | P-value |
|---|---|---|---|
| Mitochondrial diameter (NR: 500–1500 nm) | 629.30 ± 64.66 | 731.67 ± 144.95 | 0.041 |
| Megamitochondria* | 3 (30) | 6 (46) | 0.673 |
| Intramitochondrial crystalline inclusions* | 3 (30) | 7 (54) | 0.252 |
| Number of intramitochondrial granules | 1.34 ± 0.61 | 1.49.± 1.00 | 0.901 |
| Electron-lucent and glycogen-containing nuclear regions* | 3 (30) | 5 (38) | 0.673 |
| Degree of foamy cytoplasmic appearance (normal/slightly increased/moderately increased/severely increased) | (–)/2/7/1 (–)/(20)/(70)/(10) | (–)/4/9/(–) (–)/(31)/(69)/(–) | 0.460 |
| Frequency of lipofuscin granules* (normal/slightly increased/moderately increased/severely increased) | 4/3/2/1 (40)/(30)/(20)/(10) | 6/4/2/1 (46)/(31)/(15)/(8) | 0.985 |
| Frequent vesicles containing electron-dense material in the peribiliary Golgi zone* | 8 (80) | 10 (77) | 0.859 |
| Intercellular distance between hepatocytes (nm) | 197.13 ± 58.83 | 228.66 ± 87.32 | 0.264 |
| Microvilli between adjacent hepatocytes* | 6 (60) | 11 (85) | 0.183 |
| Degree of collagen deposition in the space of Disse* (normal/slightly increased/moderately increased/severely increased) | 4/3/2/1 (40)/(30)/(20)/(10) | 5/3/3/2 (39)/(23)/(23)/(15) | 0.968 |
| Frequency of microvilli of hepatocytes facing the space of Disse* (decreased/normal/increased) | 2/6/2 (20)/(60)/(20) | 4/8/1 (31)/(62)/(7) | 0.634 |
| Electron-dense material accumulation in the space of Disse* | 8 (80) | 13 (100) | 0.092 |
| Bile canaliculi diameter (nm) | 921.84 ± 179.77 | 890.80 ± 129.69 | 0.852 |
| Microvillus density in bile canaliculi (n/µm2) | 28.30 ± 9.00 | 31.21 ± 4.16 | 0.510 |
| Diameter of microvilli in bile canaliculi (nm) | 119.22 ± 10.87 | 112.95 ± 7.47 | 0.264 |
| Accumulation of electron-dense material in the bile canaliculi* | 2 (20) | 4 (31) | 0.560 |
- * Number of patients (%).
- NAFL, non-alcoholic fatty liver; NASH, non-alcoholic steatohepatitis; NR, normal range.
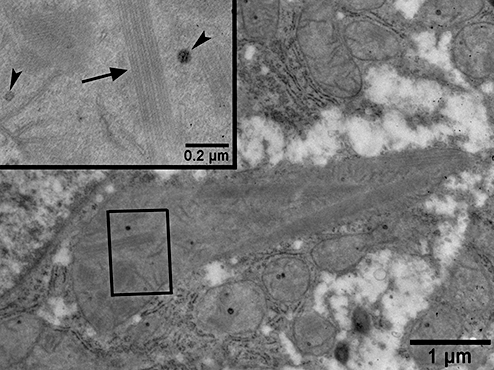
Electron micrograph from a patient with non-alcoholic steatohepatitis showing a megamitochondrion in the cytoplasm of a hepatocyte. In the inset, high magnification of the rectangle depicts the crystalline inclusions (arrow) and matrix granules (arrowheads).
Hepatocyte chromatin was peripherally marginalized in eight patients (35%), creating electron-lucent glycogen-containing nuclear areas (Fig. 2), but the difference between patients with NASH and NAFL showed no statistical significance. All patients had varying degrees of foamy hepatocyte cytoplasm due to glycogen accumulation and SER dilation (Fig. 2). In semi-quantitative analyses, most patients with NAFL and NASH showed a moderate increase, while no significant difference was noted between the two groups. Heterogeneous lipofuscin pigment granules of various sizes and shapes were occasionally increased in number (Fig. 3); however, no significant difference was found between the patients with NAFL and NASH in the semi-quantitative assessment of lipofuscin frequency. In 18 patients (78%), the frequency of vesicles containing electron-dense material and occasional concentric lamellar structures were increased in the hepatocyte peribiliary Golgi zone (Fig. 4), but the difference between the two groups was found to be insignificant. Peroxisomes were rarely observed in NASH or NAFL hepatocyte cytoplasm.
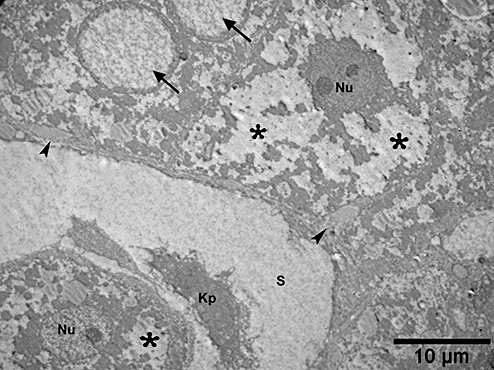
Electron micrograph from a patient with non-alcoholic steatohepatitis. In the upper left, a hepatocyte has two nuclei with electron-lucent and glycogen containing inner regions (arrows). Note the hepatocyte's foamy cytoplasm resulting from glycogen accumulation and smooth endoplasmic reticulum dilation (asterisks). The space of Disse contains increased collagen fiber bundles (arrowheads) and electron-dense material. S, sinusoid; Kp, Kupffer cell; Nu, hepatocyte nucleus.
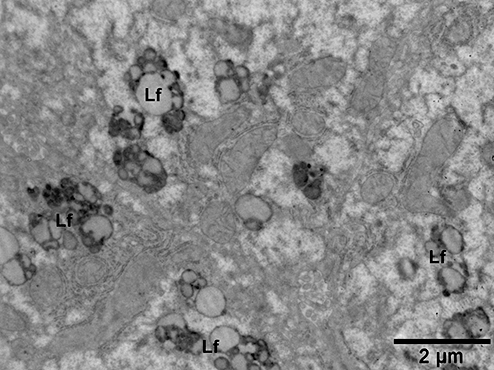
Electron micrograph from a patient with non-alcoholic steatohepatitis showing an increased number of lipofuscin granules (Lf) in a hepatocyte.
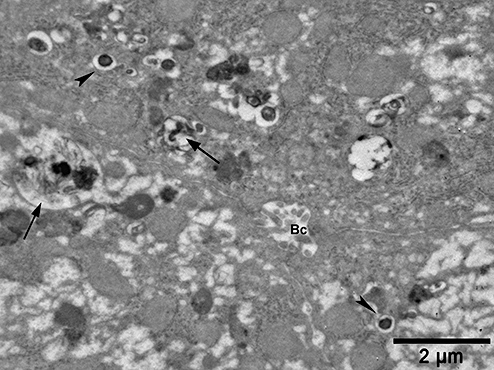
Electron micrograph from a patient with non-alcoholic fatty liver. Note the frequent vesicles containing electron-dense material (arrows) and membrane-bound inclusion bodies (arrowheads) in the peribiliary Golgi zone. Bc, bile canaliculus.
The intercellular distance between hepatocytes in the hepatic lobule was increased in both groups (Fig. 5). Hepatocyte microvilli were frequently observed along the intercellular distance between hepatocytes in 17 patients (74%) (Fig. 5). No significant difference was found when the two groups were compared for both findings.
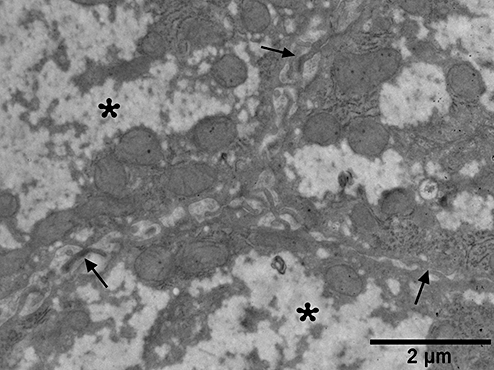
Electron micrograph from a patient with non-alcoholic steatohepatitis. The intercellular spaces (arrows) between hepatocytes are widened and contain microvilli. Note the foamy cytoplasm (asterisk).
In the space of Disse, there were no significant differences in the levels of collagen accumulation (2, 6) and hepatocellular microvilli (Fig. 7) for patients with NASH and NAFL. Twenty-one patients (91%) had accumulation of electron-dense material in the space of Disse (2, 7), but no significant difference was found between the two groups. In both groups, hepatic stellate cells in the space of Disse and Kupffer cells in sinusoidal lumens were ultrastructurally normal.
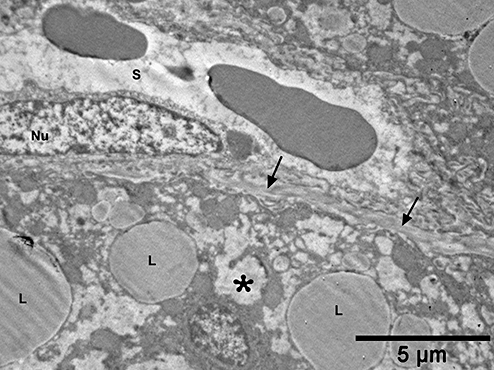
Electron micrograph from a patient with non-alcoholic fatty liver showing increased collagen bundles (arrows) along the space of Disse. Note that hepatocyte microvilli (arrowhead) are sparse and the foamy cytoplasmic appearance (asterisk) is mildly increased. S, sinusoid; L, lipid droplet; Nu, endothelial cell nucleus.
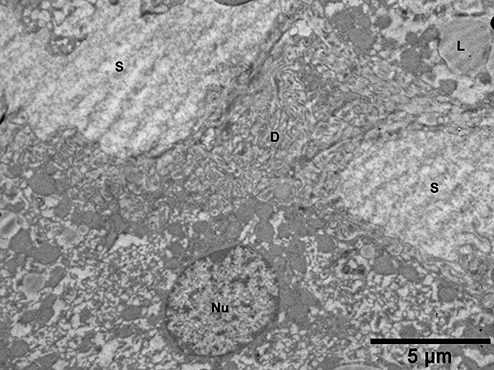
Electron micrograph from a patient with non-alcoholic fatty liver. The widened space of Disse (D) contains increased hepatocyte microvilli and electron-dense material. S, sinusoid; Nu, hepatocyte nucleus; L, lipid droplet.
Bile canaliculi diameter was increased in patients with NAFL when compared to those with NASH. Electron-dense material was observed in bile canaliculi lumens of 18 patients (78%) (Fig. 8). The differences between the two groups for the above-mentioned parameters were not statistically significant. In addition, no significant differences were observed between groups with respect to microvillus density in bile canaliculi.
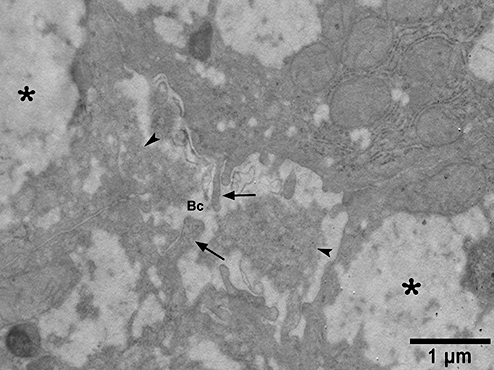
Electron micrograph from a patient with non-alcoholic steatohepatitis showing a widened bile canaliculus (Bc) containing deposits of electron-dense material (arrowheads) and decreased, irregularly-outlined hepatocyte microvilli (arrows). Asterisks, foamy appearance of cytoplasm.
Discussion
NAFLD is a worldwide health problem with increasing incidence. NAFLD may progress to a wide range of diseases, including fibrosis, cirrhosis and hepatocellular carcinoma.1,19,20 NAFLD is frequently associated with obesity, diabetes, dyslipidemia, insulin resistance and metabolic syndrome.21,22 It is thought that insulin resistance contributes to pathogenesis through lipid accumulation in the liver, hyperinsulinemia and increased serum-free fatty acids secondary to lipolysis.23 Studies show a 98% to 100% prevalence of insulin resistance among patients with NAFLD, and especially those with NASH.11,16,21,24 These studies suggest that NAFLD may be a hepatic manifestation of metabolic syndrome or insulin resistance. The fact that insulin resistance is more pronounced in patients with NASH suggests that it may also influence the natural course of the disease. In this study, insulin resistance was significantly different for NAFL patients (70%) versus NASH patients (100%). No other demographic or biochemical factors were significantly different between the NASH and NAFL groups.
The pathogenesis and natural course of NAFLD is still unclear. Previous studies have attempted to elucidate pathogenic mechanisms through experimental induction of steatosis in animal models to examine structural alterations and biochemical abnormalities.25–28 A limited number of electron microscopy studies in NASH patients have been performed to determine the mechanism of fibrosis and cirrhosis.11–15 The only study conducted to date with NAFL patients was performed by Sanyal et al.11 who compared six patients with hepatosteatosis to 10 patients with NASH. In that study, peripheral insulin resistance, increased fatty acid β-oxidation and hepatic oxidative stress were similar between groups, but ultrastructural mitochondrial disturbances were present only in NASH patients.11 However, in the above-mentioned human electron microscopic studies, attention was paid predominantly to mitochondrial abnormalities and detailed evaluations on other hepatocyte organelle abnormalities or other structures of hepatic lobule were not reported. In our study we compared the ultrastructural features of hepatic damage in 10 patients with NAFL and 13 patients with NASH by a series of detailed quantitative and semi-quantitative evaluations.
In hepatosteatosis, impaired oxidative phosphorylation and hepatocyte mitochondrial abnormalities are well-described. The most prominent ultrastructural change is the formation of crystalline inclusions in the mitochondrial matrix with accompanying mitochondrial swelling in hepatocytes. Although these inclusions were initially described as paracrystalline, optical diffraction studies show a decidedly crystalline structure.29,30 Similar ultrastructural changes have also been reported in Wilson's disease and alcoholic steatohepatitis, especially in early or mild disease.12,31,32 Pediatric NASH patient biopsies show mitochondrial abnormalities similar to those in adults, including polymorphisms, megamitochondria, moderately increased matrix electron-density, and crystalline inclusions.13 Megamitochondria formation with crystalline inclusions reflects biochemical hepatic injury to the mitochondrial electron transport chain or oxidative alterations.14 In contrast, rodent models of NASH do not develop mitochondrial crystalline inclusions.33 The main ultrastructural changes in rodents are severe mitochondrial swelling, proliferation of SER, abnormal rough endoplasmic reticulum to mitochondria relationship, and nuclear membrane blebbing.33
In our study, crystalline inclusions and megamitochondria were observed in 43% and 39% of patients, respectively. Although crystalline inclusions, megamitochondria and mitochondrial matrix granules were more often present in NASH than NAFL, this difference was not significant. It is interesting to note that, although the mean mitochondrial diameters were within the normal range for both groups, diameters were significantly larger for NASH patients. The number of matrix granules varies by disease and may be absent under some conditions.34 In our study, there were no significant differences in the number of granules for NAFL and NASH patients. All patients showed varying degrees of loss of cristae and increased matrix density, which may indicate decreased intra-mitochondrial protein synthesis and impaired respiratory chain function.
In addition to mitochondrial alterations, we observed a wide range of changes in hepatocellular ultrastructure, such as occurrence of electron-lucent and glycogen-containing nuclear regions, foamy cytoplasmic appearance due to glycogen accumulation and SER dilation, increased frequency of lipofuscin granules and increased frequency of vesicles containing electron-dense material in the peribiliary Golgi zone. However, no significant difference was found between patients with NASH and NAFL in the comparisons by semi-quantitative evaluations of these findings. Moreover, in our evaluations to focus on cholestatic evidences in bile canaliculi, quantitative and semi-quantitative analyses showed no significant difference between the two groups in terms of diameters of bile canaliculi and hepatocyte microvilli in bile canaliculi and presence of electron-dense substance in the canalicular lumen. Besides, no statistically significant difference was noted between the two groups with respect to bile canalicular microvillus density.
In cirrhotic patients, the distance between hepatocytes increases to 4000–5000 Å. Lateral hepatocyte plasmalemma domains facing intercellular spaces may possess microvilli, especially in cirrhotic nodules where the anastomosing plates of hepatocytes may be greater than one-cell thick. Increased hepatocellular microvilli in the space of Disse and pericellular spaces may be an adaptative mechanism to protect against increased metabolic demands resulting from increased collagen synthesis, low oxygen pressure, or inadequate substrate diffusion from sinusoids because of the alterations in the space of Disse. In contrast, increased microvilli may develop as a primary event as well.34 In our study, the widened intercellular spaces between adjacent hepatocytes showed the presence of frequent hepatocyte microvilli. However, no significant difference was observed between patients with NAFL and NASH during the quantitative and semi-quantitative comparisons in terms of these changes.
In experimental animal models of NASH, hepatocyte lipid accumulation has been shown to cause microvascular changes.35–37 These changes may result from narrowing of sinusoidal lumens caused by swollen hepatocytes due to increased lipid content. These alterations, along with increased collagen in the space of Disse, lead to sinusoidal damage. This damage decreases blood flow or erythrocyte passage, thereby impairing tissue perfusion. Activation of hepatic stellate cells may also play a role in the changes of hepatic microvascular dynamics through regulation of sinusoidal diameter and blood flow by cellular contraction. Increased collagen and accumulation of extracellular matrix components in the space of Disse may contribute to hepatic damage in NASH. Hepatic damage and fibrosis have been attributed to the impaired hepatocyte oxygenation and reactive oxygen products from post-ischemic reperfusion.38 In our study, both NASH and NAFL biopsy specimens demonstrated increased collagen fibers and electron-dense material accumulation in the space of Disse.
In conclusion, this is the first study to compare the ultrastructural liver alterations in patients with NAFL and NASH quantitatively and semi-quantitatively by electron microscopy. In our study, detailed evaluations of hepatocellular and parenchymal structures showed that only mitochondrial diameter was significantly different between patients with NASH and patients with NAFL. Our data show that, although NAFL and NASH can be distinguished by pathological features at the light microscopic level, their ultrastructural findings are similar. Our results challenge the widely accepted tenet that hepatosteatosis is a benign self-limited entity, because, like NASH, NAFL may have the potential to progress to fibrosis and cirrhosis because of their ultrastructural similarities.
Acknowledgments
This work was supported by the Research Fund of Istanbul University. Project number: T-462/25062004. The authors thank Funda Durmaz Onar and Fadime Aktar for their technical assistance and support in processing for electron microscopy.


