Diel vertical migration of medusae in the open Southern Adriatic Sea over a short time period (July 2003)
Abstract
Diel vertical migration (DVM) of medusae was investigated at a fixed station in the oligotrophic Southern Adriatic Sea at several depths during summer (July) 2003. We hypothesized that medusan DVM is considerably influenced by environmental variables such as hydrographic features, light intensities, and potential prey densities. We used short-term repetitive sampling as an approach to detail these relationships. Of the 26 species collected, the highest abundance was in the layer between the thermocline (15 m) and 100 m depth, where Rhopalonema velatum predominated, reaching the maximum count of 93 individuals per 10 m3. Seven species were observed over a wide depth range: Solmissus albescens (15–1200 m), R. velatum (0–800 m), Persa incolorata (50–1200 m), Octophialucium funerarium (200–1200 m), Arctapodema australis (200–1200 m), Amphinema rubra (100–800 m), and Rhabdoon singulare (15–600). According to the medusan weighted mean depth (WMD) calculations, the longest DVMs were noted for the deep-sea species S. albescens, O. funerarium, and A. australis. The shallowest species, Aglaura hemistoma, was primarily non-migratory. Certain medusan assemblages were associated consistently with a particular depth layer characterized by a particular light intensity. The interplay of environmental factors and trophic relationships explains some of the features of medusan migratory patterns. These findings thus contribute to understanding the variables that determine patterns of medusan vertical migratory behavior.
Problem
Diel vertical migration (DVM) occurs in a wide range of zooplankton taxa and probably represents the biggest animal migration, in term of biomass, on the planet (Hays 2003). Of the many factors proposed to explain this behavior, the principal attention has been given to light intensity and several hydrographic variables, especially temperature, and how DVM may benefit feeding, predator avoidance, and reproduction (e.g.Longhurst 1985; Forward 1988; Ohman 1990; Arai 1992; Bollens et al. 1992; Heywood 1996; Vinogradov 1997; Graham et al. 2001; Frank & Widder 2002; Hays 2003; Pearre 2003).
Vertical migration has been investigated for many hydromedusae since the pioneering work of Russell (1925), but rather few publications have substantially contributed to knowledge of the DVM of medusae. Mills (1983) studied light-dependent diel vertical movement of seven medusan species in an experimental tank over 24 h. Roe et al. (1984) repeatedly sampled four depths in the northeast Atlantic Ocean over a 48-h period. Pagès & Gili (1992) investigated the influence of the thermocline on the vertical distribution and migratory movements of epiplanktonic medusae at an oceanic station off Northern Namibia over 48 h. Andersen et al. (1992) sampled discontinuously over 9 days in the Ligurian Sea, emphasizing only one medusa, Solmissus albescens. Benović (1973) analysed this same species in monthly samples taken over 1 year in the Adriatic Sea. Schuyler & Sullivan (1997) found evidence of a strong relationship between light and diel migrations of the schyphomedusa Chrysaora quinquecirrha in large enclosures (mesocosms) during 1–3-week experiments. Youngbluth & Båmstedt (2001) observed that swimming rates and feeding activity of the mesopelagic coronate medusa Periphylla periphylla in a Norwegian fjord varied with age and time of the day. Buecher & Gibbons (2003) investigated DVM of six common hydromedusae at two stations (168 and 71 m deep) in St Helena Bay on the west coast of South Africa in 3- and 6-day surveys. The depth distribution and amplitude of migration varied between surveys for most species, so definitive interpretations of pattern could not be made.
Full understanding the role played by medusae in pelagic food webs requires knowledge of their DVM behavior (Benovićet al. 2005). As in other areas, this partially reflects difficulties with sampling methodology, weather conditions necessary for repetitive sampling and the high cost of undertaking such studies at deep-sea stations. To address this, the present work reports data for medusae collected over 96 h at an open-water station in the oligotrophic South Adriatic Sea sampled at morning, midday, evening, and night. Because there are no detailed data on DVM of medusae, new knowledge will improve our understanding of the role of planktonic cnidarians in the marine environment. Thus, our study goal was to elucidate (i) DVM behavior, (ii) species composition of migrators, and (iii) vertical trophic relationships.
Study Area
The Southern Adriatic Sea is a semicircular basin with depths to about 1200 m (Fig. 1). It interacts with the main body of the Eastern Mediterranean Sea via inflow of Ionian Surface Water and Levantine Intermediate Water through the Strait of Otranto (∼ 800 m depth) and with other regions of the Adriatic Sea via main currents moving along the Adriatic coasts. It also is a source of a deep-water mass that joins the broader circulation of the Mediterranean Sea (Vilibić & Orlić 2001). In addition, the presence of cyclonic gyre throughout the year in the Southern Adriatic has been well documented (Gačićet al. 2002). In contrast to the shallow and eutrophic Northern Adriatic, the Southern Adriatic is deep and oligotrophic (Faganeli et al. 1989). Nevertheless occasional phytoplankton blooms have been observed (Gačićet al. 2002).
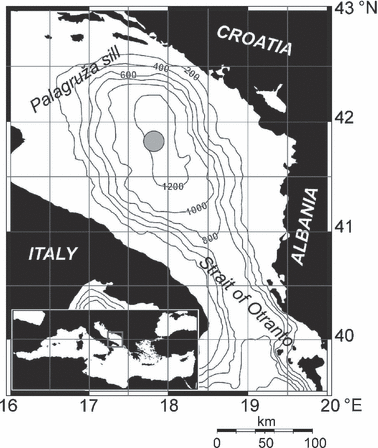
Location of sampling station in the southern Adriatic, July 2003.
The formation of thermocline starts in May and by July and August it develops to 14 m depth (Morovićet al. 2006). In the layers below the thermocline, the temperature is rather constant during the whole year, between 15 °C and 13 °C. Salinity is generally higher than 38 psu in the whole water column (Morovićet al. 2006). Whereas the changes in the surface 100 m are related to seasonal and atmospheric influences, the changes in the deep layers are governed by inter-annual changes of circulation pattern.
Water-mass circulation patterns have a crucial significance for spatial and seasonal distribution of small zooplankton in the open waters of the Southern Adriatic (Kršinić & Grbec 2002). Each type of water mass is represented by the presence of characteristic species. Periods of strong advections of Levantine and Ionian waters impose a longitudinal type of zooplankton distribution, characterized by high species diversity and low abundance, and transport of pelagic species to the shallow Middle and North Adriatic. This differs from ‘eddy type’ distribution in the Southern Adriatic, where population density is greater in all layers and transport of species northward ceases (Kršinić & Grbec 2006).
Material and Methods
Medusae and mesozooplankton were sampled at a single station (∼ 1200 m depth) in the Southern Adriatic Sea (41°44′ N, 17°52′ E) from July 22 to July 28 during the ‘Medusa II’ cruise of R/V Naše More of the University of Dubrovnik (Fig. 1). The sampling program was interrupted from midday 25 July to the morning of 27 July (Table 1) owing to inclement weather. Nineteen sample series (152 vertical hauls) were collected with a Nansen opening-closing net (200-μm mesh, 113-cm diameter) within the following depth intervals: 0–15 (above the thermocline), 15–50, 50–100, 100–200, 200–400, 400–600, 600–800, and 800–1200 m. The average hauling speed of all tows was 0.5 m·s−1. Samples were preserved in a 2.5% formalin–sea water solution buffered with CaCO3.
| data | mesozooplankton | microzooplankton |
|---|---|---|
| sampling period (hours) | sampling period (hours) | |
| 22 July | 19.30–22.50 | |
| 23 July | 01.30–04.00 | |
| 23 July | 06.25–09.50 | |
| 23 July | 11.30–15.00 | |
| 23 July | 16.00–18.40 | 18.50–21.15 |
| 23 July | 21.25–23.30 | |
| 24 July | 00.25–03.45 | |
| 24 July | 06.00–09.00 | 09.10–11.30 |
| 24 July | 11.35–13.45 | |
| 24 July | 17.30–20.30 | |
| 25 July | 00.15–03.45 | |
| 25 July | 06.00–09.00 | |
| 27 July | 23.45–03.05 | 21.00–23.30 |
| 27 July | 05.55–09.00 | |
| 27 July | 11.45–15.00 | 09.10–11.30 |
| 27 July | 17.30–20.30 | 15.10–17.20 |
| 28 July | 00.00–03.10 | 21.00–01.30 |
| 28 July | 05.50–08.45 | 09.00–11.30 |
| 28 July | 13.00–16.15 |
Seven additional series (56 vertical hauls) for microzooplankton were made with a 53-μm, 65-cm diameter net (Table 1) over the same depth intervals as for mesozooplankton.
Our sampling strategy followed prior experience in studies of the open South Adriatic ecosystem. During our investigations sampling was more closely spaced in upper layers, in particular in the area of thermocline. In contrast to various visual methods that can detect smaller scale movement patterns, the main advantage of net trawl methods is that organisms collected can be identified and analysed for in-depth taxonomic information (Ianson et al. 2004).
All medusae and mesozooplankton identifications were performed with an Olympus SZX 9 stereomicroscope. For microzooplankton, a Leica DMLB inverted microscope was used at 100× and 400×. All medusae were counted from total samples and calculated as number of individuals per 10 m3. Sub-samples from a Folsom plankton splitter (1/16 to 1/32 of the total) were used to count micro- and mesozooplankton and were calculated as number of individuals per m3.
Two CTD probes were used to measure temperature and salinity twice daily. The Idronaut 316 probe was used to 1200 m and the SeaBird OC25 probe equipped with the Wetlabs FLUO sensor above 200 m. Chlorophyll concentrations were calculated from fluorescence with software provided by Seabird. The probes are accurate to 0.01 °C, 0.003 parts salinity, and 0.5 m depth.
Light was measured daily to 90 m at 06.00, 12.00, and 18.00 hours (local time) with a profiling radiometer (PRR800 Biospherical Instruments Inc.) at 14 wavelengths (340–710 nm) in addition to measurements of PAR (Photosynthetic Available Radiation) attenuation (400–700 nm).
Representative medusan species within a depth layer were determined according to their frequency of occurrence (%) and relative abundance in all samples. Representative microzooplanktonic groups and mesozooplankton species were determined according to their relative abundance only. The weighted mean depth (WMD) of all representative species was calculated as: WMD = ∑(nizidi)/∑(nizi), where di is the midpoint of the depth interval of sample i, zi is the thickness of the stratum, and ni is the number of individuals within each depth layer (m−3 and 10 m−3). The Spearman rank-order correlation coefficient (Dytham 2003) was used to compare densities of frequently observed and abundant medusan species in each analysed layer (152 samples) with densities of microzooplankton groups (56 samples) and the most numerous mesozooplankton taxa (152 samples). Because of the large number of significant positive correlations, we limited results to those highly significant (P < 0.001) and with a correlation coefficient > 0.5.
Results
Environmental conditions
After a rapid decrease over the first 5 m, irradiance declined steadily to 90 m depth. PAR intensities at the surface ranged from 1.6 × 10⁻¹ to 1.6 × 10⁻² μE·cm−2·s−1. In the layer immediately below the thermocline, PAR varied from 6.6 × 10⁻² to 4 × 10⁻³ μE·cm−2·s−1. At 50 m, PAR varied from 9 × 10⁻³ to 5 × 10⁻⁴ μE·cm−2·s−1; at 90 m, from 1.2 × 10⁻⁴ to 6 × 10⁻⁵ μE·cm−2·s−1.
Vertical profiles of temperature (Fig. 2) and salinity (Fig. 3) differed little throughout the study. The highest temperature, 27 °C, was at the surface. The thermocline was quite shallow (14 m), where temperature averaged 18.55 ± 0.77 °C. Temperature dropped considerably below the thermocline to 50 m (15.27 ± 0.06 °C). A lower temperature decrease was observed from 150 m (∼ 14 °C) to the bottom (∼ 13 °C), and temperature in deeper layers was practically constant. Salinity was generally high throughout the water column, averaging 38.72, 38.95, and 38.64 at the surface, thermocline, and in the bottom layer, respectively.
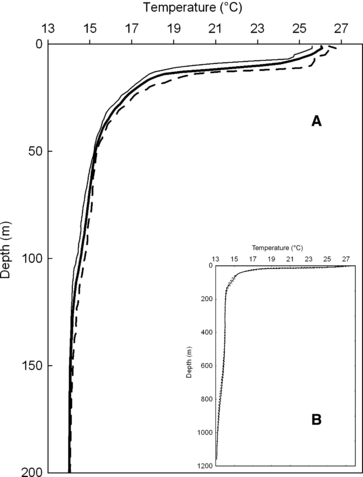
Vertical profiles of temperature from 0–200 m (A) and whole water column (B) in the Southern Adriatic, July 2003. Data represent average values from all measurements: thin line indicate minimum; thick line indicate mean; dotted line indicate maximum.
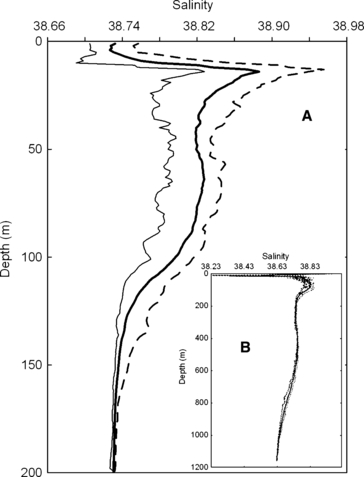
Vertical profiles of salinity from 0–200 m (A) and whole water column (B) in the Southern Adriatic, July 2003. Data represent average values from all measurements: thin line indicates minimum; thick line indicates mean; dotted line indicates maximum.
Chlorophyll concentrations (Fig. 4) averaged 0.49 ± 0.10 mg·m−3 at the surface and 0.56 ± 0.02 mg·m−3 at the thermocline. They increased to a pronounced maximum of 1.26 mg·m−3 at 74 m (average: 1.06 ± 0.12 mg·m−3), below which they steadily decreased to 0.50 ± 0.02 mg·m−3 to 200 m.
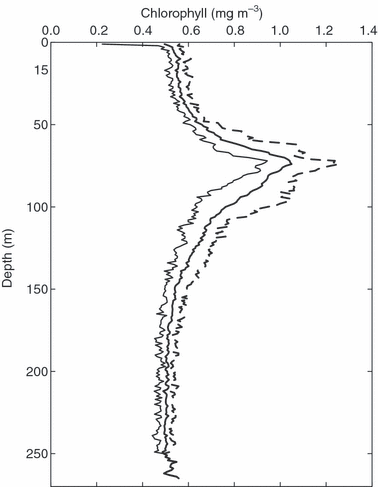
Vertical profiles of chlorophyll concentration from 0 to 200 m depth in the Southern Adriatic, July 2003. Data represent average values from all measurements: thin line indicates minimum; thick line indicates mean; dotted line indicates maximum.
Vertical distribution of zooplankton
Microzooplankton abundance was constantly the highest above 100 m depth (Fig. 5). The maximum of 5627 individuals per m3 was noted during midday, and the highest average of 3576 individuals per m3 occurred between 50 and 100 m. A slight vertical migration was observed to the upper layers during the night and morning. Below 200 m, microzooplankton averaged 210–351 individuals per m3. Copepod nauplii and copepodites were the most numerous microzooplankters, each contributing about 40% to the total abundance. The greatest numbers of tintinnids (470–509 individuals per m3) occurred above 100 m.
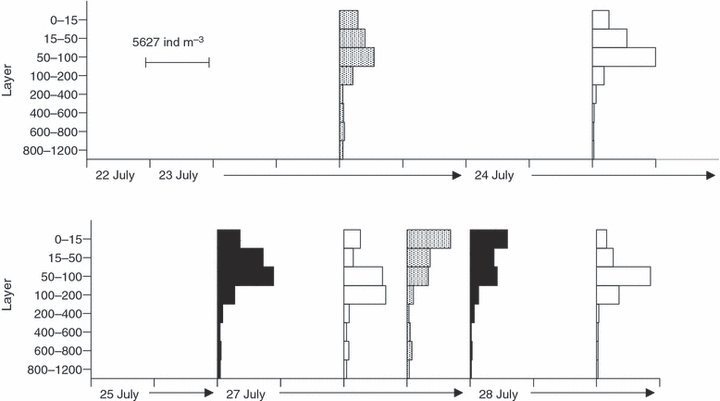
Diel vertical migration of microzooplankton in the Southern Adriatic Sea, July 2003. Each unit between ticks along the x-axis represents 5630 individuals per m3, and the arrows represent sampling dates.
Mesozooplankton was most numerous in the 50–100 m layer (Fig. 6). This layer seems to be a zone of dramatic changes in abundance: from 665 individuals per m3 (morning, July 28) to 74 individuals per m3 (night, July 25). Extensive vertical migration of crustaceans zooplankton – deeper species toward mid-layer, mid-water species toward the surface layers, and/or dispersion throughout water column – was detected on July 23, 25 and 27. Densities were uniformly low below 400 m, averaging 39 ± 15 individuals per m3. Copepods predominated, making up 72% of total mesozooplankton abundance.
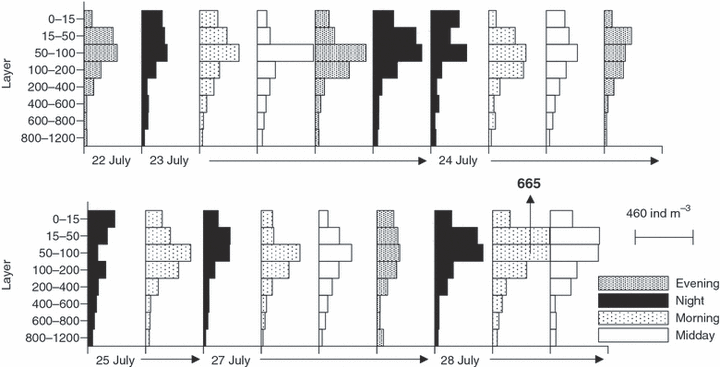
Diel vertical migration of mesozooplankton in the Southern Adriatic Sea, July 2003. Each unit between ticks along the x-axis represents 460 individuals per m3, and the arrows represent sampling dates.
The most abundant copepods were Oithona plumifera Baird, 1843, Oithona similis Claus, 1866, Poecilostomatoida Thorell, 1859, Clausocalanus pergens Farran, 1926, Oithona setigera (Dana, 1849), Mormonilla minor Giesbrecht, 1891, Ctenocalanus vanus Giesbrecht, 1888, Temoropia mayumbaensis T. Scott, 1894, Clausocalanus paululus Farran, 1926, Calocalanus spp. Giesbrecht, 1888, and Lucicutia flavicornis (Claus, 1863). In general, O. plumifera, O. similis, C. vanus, and Calocalanus spp. were numerous between the thermocline and 200 m, whereas T. mayumbaensis and some of the poecilostomatoids dominated below 600 m. Other copepods exhibited a pronounced difference in their diel bathymetric distribution. Paracalanus parvus (Claus, 1863), Temora stylifera (Dana, 1849), and the cladoceran Evadne spinifera P.E. Müller, 1867 were constantly most abundant near the surface (0–15 m).
Vertical distribution and migration of the most abundant medusae
Twenty-four species of hydromedusae and two schyphomedusae (Nausithoë punctata, and Paraphyllina intermedia) were collected (Table 2). The most abundant hydromedusa was Rhopalonema velatum, followed by Aglaura hemistoma, Rhabdoon singulare, Persa incolorata, and Solmissus albescens (Table 3). Among the less numerous (average < 1.00 individual per 10 m3) but frequently occurring (> 80%) species were only Arctapodema australis, Amphinema rubra, and Octophialucium funerarium (Table 2).
| species/depth layer (m) | 0–15 | 15–50 | 50–100 | 100–200 | 200–400 | 400–600 | 600–800 | 800–1200 |
|---|---|---|---|---|---|---|---|---|
| Rhabdoon singulare Keferstein and Ehlers, 1861 | 15 | 100 | 100 | 10 | 3 | |||
| Oceania armata Kölliker, 1853 | 10 | 42 | 10 | |||||
| Hydractinia areolata (Wagner, 1833) | 3 | |||||||
| Bougainvillia muscus (Allman, 1863) | 3 | |||||||
| Koelikerina fasciculata (Péron and Lesueur, 1810) | 3 | |||||||
| Thamnostoma dibalia (Busch, 1851) | 5 | |||||||
| Amphinema rubra (Kramp, 1957) | 84 | 95 | 52 | 5 | ||||
| Leuckartiara octona (Fleming, 1823) | 5 | 52 | 10 | 3 | ||||
| Bythotiara murrayi Günther, 1903 | 26 | |||||||
| Krampella dubia Russell, 1957 | 3 | |||||||
| Clytia spp. Lamouroux, 1812 | 5 | 5 | ||||||
| Octophialucium funerarium (Quoy and Gaimard, 1827) | 26 | 68 | 89 | 47 | ||||
| Liriope tetraphylla (Chamisso and Eysenhardt, 1821) | 37 | |||||||
| Aglaura hemistoma Péron and Lesueur, 1810 | 100 | 63 | 3 | |||||
| Arctapodema australis (Vanhöffen, 1912) | 16 | 74 | 100 | 100 | ||||
| Persa incolorata McCrady, 1859 | 10 | 84 | 100 | 63 | 26 | 3 | ||
| Haliscera bigelowi Kramp, 1947 | 3 | |||||||
| Rhopalonema funerarium Vanhöffen, 1902 | 21 | |||||||
| Rhopalonema velatum Gegenbaur, 1857 | 37 | 100 | 100 | 89 | 31 | 10 | 3 | |
| Sminthea eurygaster Gegenbaur, 1857 | 5 | 74 | 26 | 15 | 3 | |||
| Solmundella bitentaculata (Quoy and Gaimard, 1833) | 5 | 10 | 10 | 26 | ||||
| Solmaris spp. Heackel, 1879 | 21 | 42 | 15 | |||||
| Cunina globosa Eschscholtz, 1829 | 10 | 12 | 3 | 3 | ||||
| Solmissus albescens Gegenbaur, 1857 | 21 | 32 | 57 | 89 | 100 | 100 | 100 | |
| Nausithoë punctata Komai, 1935 | 5 | |||||||
| Paraphyllina intermedia Mass, 1903 | 3 | 5 | 73 |
| species/depth layer (m) | 0–15 | 15–50 | 50–100 | 100–200 | 200–400 | 400–600 | 600–800 | 800–1200 |
|---|---|---|---|---|---|---|---|---|
| Rhabdoon singulare | 0.08 ± 0.20 | 3.26 ± 2.62 | 2.39 ± 1.96 | 0.02 ± 0.05 | 0.01 ± 0.04 | |||
| Oceania armata | 0.06 ± 0.19 | 0.16 ± 0.30 | 0.03 ± 0.10 | |||||
| Hydractinia areolata | <0.01 ± 0.02 | |||||||
| Bougainvillia muscus | <0.01 ± 0.02 | |||||||
| Koelikerina fasciculata | <0.01 ± 0.02 | |||||||
| Thamnostoma dibalia | 0.01 ± 0.01 | |||||||
| Amphinema rubra | 0.61 ± 0.65 | 0.47 ± 0.49 | 0.15 ± 0.24 | 0.06 ± 0.23 | ||||
| Leuckartiara octona | 0.02 ± 0.09 | 0.34 ± 0.58 | 0.02 ± 0.05 | 0.08 ± 0.23 | ||||
| Bythotiara murrayi | 0.05 ± 0.07 | |||||||
| Krampella dubia | <0.01 ± 0.02 | |||||||
| Clytia spp. | 0.04 ± 0.16 | 0.01 ± 0.05 | ||||||
| Octophialucium funerarium | 0.17 ± 0.43 | 0.12 ± 0.13 | 0.25 ± 0.21 | 0.13 ± 0.24 | ||||
| Liriope tetraphylla | 0.61 ± 0.98 | |||||||
| Aglaura hemistoma | 10.91 ± 10.67 | 2.56 ± 4.93 | 0.04 ± 0.18 | |||||
| Arctapodema australis | 0.04 ± 0.10 | 0.19 ± 0.18 | 0.33 ± 0.42 | 0.17 ± 0.09 | ||||
| Persa incolorata | 0.04 ± 0.13 | 1.47 ± 1.67 | 2.06 ± 2.92 | 0.08 ± 0.08 | 0.03 ± 0.06 | 0.01 ± 0.03 | ||
| Haliscera bigelowi | 0.01 ± 0.05 | |||||||
| Rhopalonema funerarium | 0.020.02 | |||||||
| Rhopalonema velatum | 1.00 ± 1.94 | 47.71 ± 23.01 | 28.72 ± 16.30 | 1.98 ± 2.30 | 0.05 ± 0.09 | 0.02 ± 0.05 | <0.01 ± 0.02 | |
| Sminthea eurygaster | 0.01 ± 0.02 | 0.23 ± 0.28 | 0.09 ± 0.23 | 0.02 ± 0.04 | 0.01 ± 0.02 | |||
| Solmundella bitentaculata | 0.03 ± 0.14 | 0.04 ± 0.13 | 0.02 ± 0.05 | 0.04 ± 0.08 | ||||
| Solmaris spp. | 0.61 ± 1.56 | 0.64 ± 0.96 | 0.04 ± 0.12 | |||||
| Cunina globosa | 0.34 ± 0.96 | 0.10 ± 0.22 | 0.02 ± 0.09 | 0.01 ± 0.04 | ||||
| Solmissus albescens | 0.22 ± 0.44 | 1.54 ± 2.92 | 0.99 ± 1.22 | 0.79 ± 0.60 | 1.30 ± 2.33 | 0.91 ± 0.88 | 0.33 ± 0.25 | |
| Nausithoë punctata | 0.03 ± 0.11 | |||||||
| Paraphyllina intermedia | <0.01 ± 0.02 | 0.01 ± 0.02 | 0.08 ± 0.06 |
Rhabdoon singular. The only abundant anthomedusan, R. singulare, was found consistently from 50 to 200 m, with the highest value of 10 individuals per 10 m3 (Fig. 7). This species was never present above the thermocline or below 600 m (Table 4). Daily WMD data suggest a very stable distribution between 101 and 132 m. Migration in both directions was noted during the night of July 25, and descent to 400 m was observed only at midday on July 28 (Fig. 5).
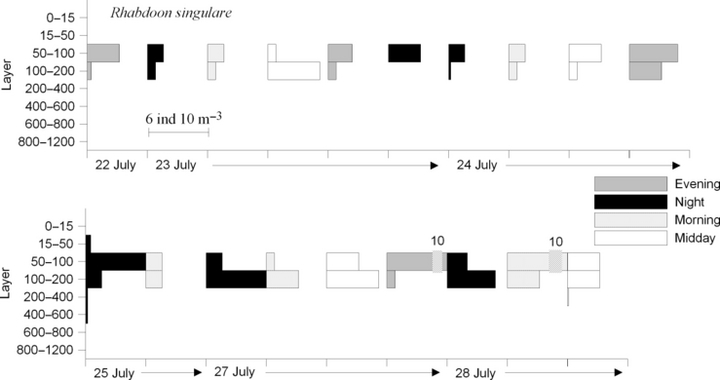
Diel vertical migration of Rhabdoon singulare in the Southern Adriatic Sea, July 2003. Each unit between ticks along the x-axis represents 6 individuals per 10 m3, and the arrows represent sampling dates.
| morning | midday | evening | night | all data | |||||
|---|---|---|---|---|---|---|---|---|---|
| WMD | SDR | WMD | SDR | WMD | SDR | WMD | SDR | WMD | |
| Rhabdoon singulare | 116 | 15–200 | 132 | 50–400 | 101 | 50–200 | 130 | 15–600 | 121 |
| Amphinema rubra | 261 | 100–600 | 291 | 100–600 | 293 | 100–800 | 272 | 100–800 | 307 |
| Octophialucium funerarium | 637 | 200–1200 | 918 | 400–1200 | 688 | 400–1200 | 620 | 200–1200 | 700 |
| Aglaura hemistoma | 12 | 0–100 | 11 | 0–50 | 9 | 0–50 | 9 | 0–50 | 11 |
| Arctapodema. australis | 736 | 200–1200 | 808 | 400–1200 | 804 | 400–1200 | 709 | 200–1200 | 759 |
| Persa incolorata | 275 | 100–800 | 281 | 100–600 | 233 | 50–600 | 307 | 50–1200 | 278 |
| Rhopalonema velatum | 57 | 0–800 | 58 | 15–200 | 47 | 0–200 | 40 | 0–400 | 51 |
| Solmissus albescens | 560 | 100–1200 | 659 | 200–1200 | 469 | 100–1200 | 366 | 15–1200 | 510 |
Aglaura hemistoma. Most of these medusae were generally found above the thermocline, although some specimens were collected as deep as 100 m (Fig. 8, Table 4). Pronounced maxima occurred on the night of July 23 (44 individuals per 10 m3) and midday on July 24 (35 individuals per 10 m3).

Diel vertical migration of Aglaura hemistoma in the Southern Adriatic Sea, July 2003. Each unit between ticks along the x-axis represents 35 individuals per 10 m3, and the arrows represent sampling dates.
Arctapodema australis. Daily WMD data for this trachymedusa showed that most of the population varied from 709 to 808 m depth (Table 4). This species always occurred between 600 and 1200 m and occasionally within the 400–600 m layer. The maximum abundance, two individuals per 10 m3, was in the 600–800-m layer. A. australis rarely migrated above 400 m, and only at night and in the morning (Fig. 9).
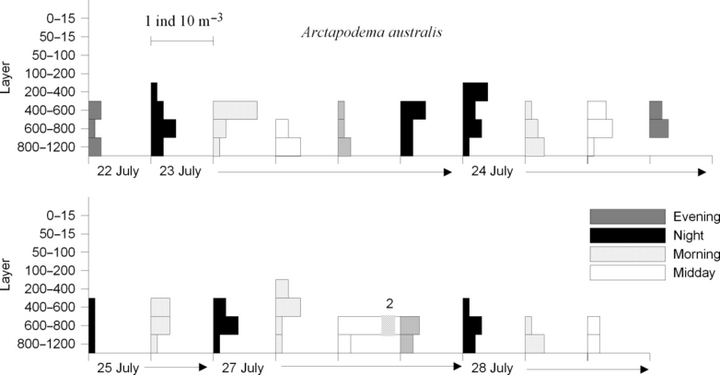
Diel vertical migration of Arctapodema australis in the Southern Adriatic Sea, July 2003. Each unit between ticks along the x-axis represents 1 individual per 10 m3, and the arrows represent sampling dates.
Persa incolorata. This species occupied the layer from 50 m to the bottom. Daily WMD data show that it was always most common between 233 and 307 m depth (Table 4). The maximum, 10 individuals per 10 m3, was between 200 and 400 m (Fig. 10). Higher densities were also found in the 100–200-m layer, with a maximum of 6 individuals per 10 m3. Persa incolorata was found above 100 m only on two occasions, one at night and one in the morning. Sinking below 400 m was frequent, especially at night, when specimens were collected near the bottom (Fig. 10).
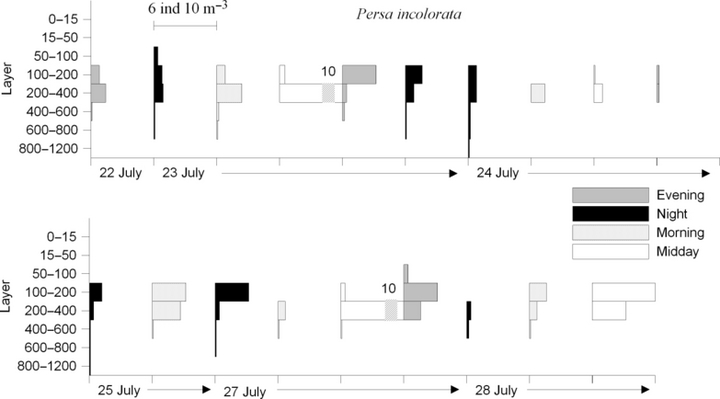
Diel vertical migration of Persa incolorata in the Southern Adriatic Sea, July 2003. Each unit between ticks along the x-axis represents 6 individuals per 10 m3, and the arrows represent sampling dates.
Rhopalonema velatum. The most abundant medusa was found from the surface to 800 m depth (Table 4). Daily WMD data show the bulk of the population between 40 and 58 m, especially at night and in the morning, when the highest dispersion was observed (Fig. 11). Maximum abundance was 93 individuals per 10 m3.
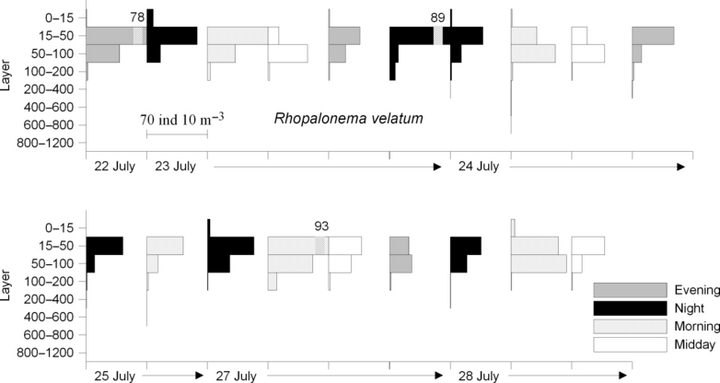
Diel vertical migration of Rhopalonema velatum in the Southern Adriatic Sea, July 2003. Each unit between ticks along the x-axis represents 70 individuals per 10 m3, and arrows represent sampling dates.
Solmissus albescens. The large mesopelagic narcomedusa, S. albescens, had the widest vertical distribution and undertook the most extensive diel migration, spanning more than 800 m (Fig. 12). WMD data confirm the extensive diel migration of this medusa (Table 4). Through midday it aggregated within the mid-layer (400–800 m); toward evening, individuals moved to upper layers; and at night the highest abundance was found from 50 to 100 m (Fig. 12). This species was found at all depths below the thermocline, reaching 10 individuals per 10 m3 in the 400–600-m (morning) and 50–100-m (night) layers. Most of the population migrated to shallower depths at night. Some part of the population, however, remained permanently in the deepest layers (Fig. 12).
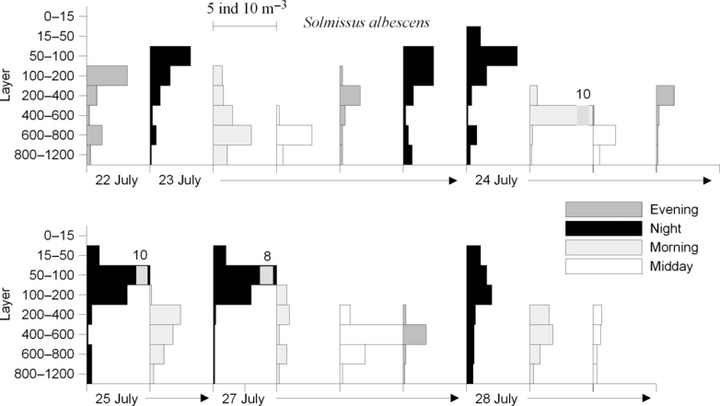
Diel vertical migration of Solmissus albescens in the Southern Adriatic Sea, July 2003. Each unit between ticks along the x-axis represents 5 individuals per 10 m3, and the arrows represent sampling dates.
Other medusae
Amphinema rubra was common from 100 to 800 m (Table 4), with higher densities in the mid-water layer (Fig. 13). Octophialucium funerarium varied frequently between 620 m (night) and 918 m (midday) (Table 4, Fig. 14). Nocturnal migrations and their presence in the upper layer during the morning resulted in a uniform vertical distribution. The highest abundance of both of these species was two individuals per 10 m3.
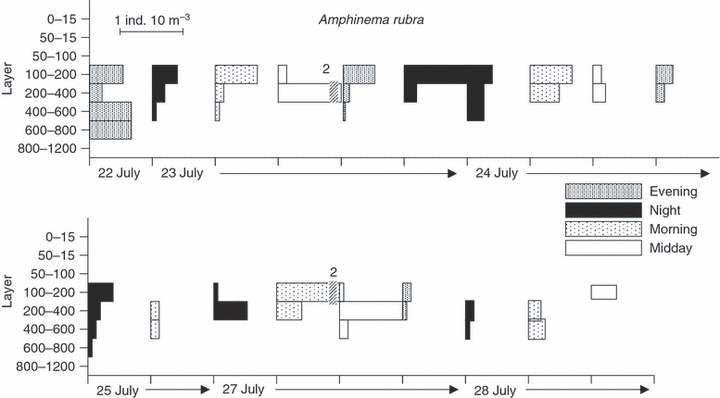
Diel vertical migration of Amphinema rubra in the Southern Adriatic Sea, July 2003. Each unit between ticks along the x-axis represents 1 individual per 10 m3, and the arrows represent sampling dates.
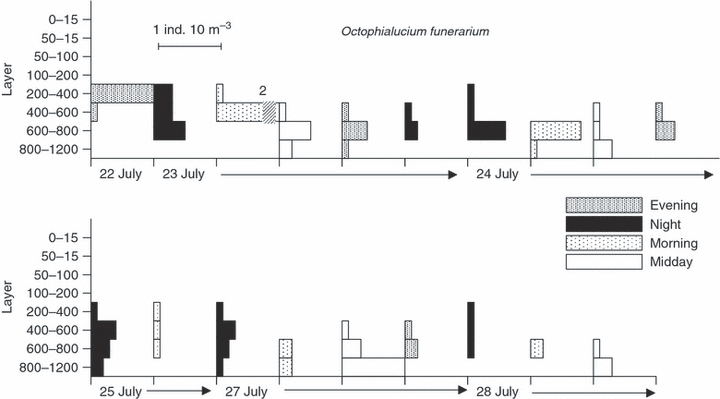
Diel vertical migration of Octophialucium funerarium in the Southern Adriatic Sea, July 2003. Each unit between ticks along the x-axis represents 1 individual per 10 m3, and the arrows represent sampling dates.
Among all other medusae, only three species (Leuckartiara octona, Sminthea eurygaster, and Paraphyllina intermedia) occurred in more than 50% of the samples from deeper layers (Table 2). Their highest values were in the range of 1–2 individuals per 10 m3, and the highest average was 0.34 individuals per 10 m3 (Table 3). Other species, although less frequently observed, were found at all depths, mostly within the 50–400-m layer (Tables 2 and 3). The only exceptions were the two surface species, Liriope tetraphylla and Nausithoe punctata, and the two deep species, Haliscera bigelowi and Rhopalonema funerarium.
Relationships between medusae and environmental factors
Aglaura hemistoma and L. tetraphylla were unique in that they were found mostly above the thermocline, where irradiance ranged from ultraviolet to infrared. The thermocline at 14–15 m was a barrier for other species with the exception of several R. velatum and Clytia spp. individuals.
There was a change in slope of the logarithm of light intensity–depth relationship for PAR. The lines connecting surface and 40 m values show almost the same slope for morning, evening and midday. In depths of 40–90 m the slope is somewhat higher for the morning/evening values, indicating a change in optical water type (Jerlov 1976) in these layers. Extrapolation to conditions at 1200 m was based on changes in light intensity below 40 m down to the lowest measured layer (approximately 90 m). The two lines define the daily intensity range at the particular depths (Fig. 15).
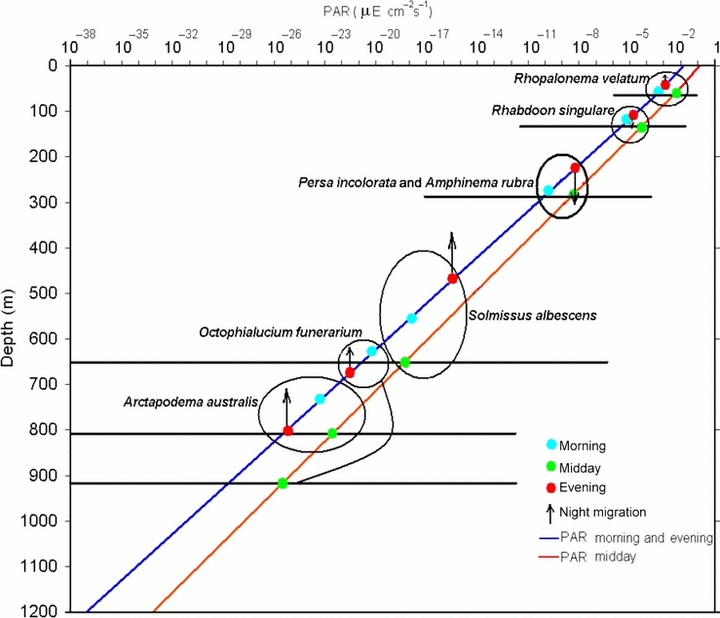
Extrapolated average depth PAR light intensities at midday (red curve), morning and evening hours (blue curve), and weighted mean depth (WMD) positions of the most frequently occurring and abundant medusae (black circles). Surface species Aglaura hemistoma was not included because of limits of selected range in the graphical presentation. Colored spots indicate medusan WMD position at different times (blue = morning; green = midday; red = evening). Arrows indicate the direction of movement to nighttime WMD. Horizontal lines indicate the range of midday light intensities at which the species occurred in the water column, extrapolated from Table 4 and 7-14.
The vertical distribution of medusae suggests species-specific differences for preferred light intensities. WMD positions of seven common medusae (Table 4) along extrapolated PAR curves (Fig. 15) illustrate a range of preference to different light intensities during the daily incidence maximum: R. velatum (10−6 to 10−1);R. singulare (10−11 to 10−2); A. rubra (10−17 to 10−3); P. incolorata (10−17 to 10−3); S. albescens (10−38 to 10−6); A. australis (10−38 to 10−11); O. funerarium (10−38 to 10−11). This corresponds to species vertical movements. The species A. hemistoma was primarily a surface-dwelling species and was not included into Fig. 15 due to its limited depth range relative to the scale of the graphical presentation.
Relationships between medusae and other zooplankton
The Spearman rank-order correlation was used to analyse the relationship of the common medusae, microzooplankton (Table 5), and mesozooplankton (Table 6). Significant positive correlations were found for medusae and zooplankton taxa typical of certain deep layers. For example, the most numerous medusan species, R. velatum, correlated significantly (P < 0.001) with all abundant microzooplankton taxa and also with the most abundant copepod that typically inhabits at 50–100 m depth and migrates toward the surface at night. The surface species A. hemistoma correlated with the surface copepods T. stylifera and P. parvus, and also with the cladoceran E. spinifera. A high correlation coefficient was found for the deep-sea medusae A. australis and O. funerarium with the deep-sea copepod T. mayumbaensis. Solmissus albescens, the most distinctive migratory medusa, had the lowest correlation coefficient only with poecilostomatoid copepods and the migratory copepod M. minor.
| Medusae | Tintinnids | Nauplii | Copepodites | Appendicularians juv. |
|---|---|---|---|---|
| Rhabdoon singulare | 0.51 | |||
| Amphinema rubra | ||||
| Octophialucium funerarium | ||||
| Aglaura hemistoma | 0.50 | 0.50 | ||
| Arctapodema. australis | ||||
| Persa incolorata | ||||
| Rhopalonema velatum | 0.68 | 0.77 | 0.63 | |
| Solmissus albescens | ||||
| species | Rhabdoon singulare | Amphinema rubra | Octophialucium funerarium | Aglaura hemistoma | Arctapodema australis | Persa incolorata | Rhopalonema velatum | Solmissus albescens |
|---|---|---|---|---|---|---|---|---|
| Evadne spinifera | 0.79 | |||||||
| Paracalanus parvus | 0.78 | |||||||
| Calocalanus spp. | 0.67 | 0.56 | ||||||
| Clausocalanus paululus | 0.52 | |||||||
| Clausocalanus pergens | 0.58 | |||||||
| Ctenocalanus vanus | 0.60 | |||||||
| Temoropia mayumbaensis | 0.64 | 0.83 | ||||||
| Temora stylifera | 0.82 | |||||||
| Lucicutia flavicornis | 0.54 | |||||||
| Mormonilla minor | 0.63 | 0.66 | 0.50 | |||||
| Oithona plumifera | 0.80 | |||||||
| Oithona setigera | 0.52 | 0.52 | ||||||
| Oithona similis | 0.62 | 0.75 | ||||||
| poecilostomatoids | 0.50 | 0.56 | 0.50 |
Discussion
The cyclonic gyre of the Southern Adriatic Sea is sufficiently well-developed (Gačićet al. 2002) to confine its plankton assemblages in a way that contributes to maintain rather constant plankton communities, including gelatinous taxa (Hure et al. 1980; Kršinić 1998; Kršinić & Grbec 2002, 2006; Batistićet al. 2004; Benovićet al. 2005; Lučićet al. 2005). The rather constant environmental conditions over this short study period suggest that a coherent system was sampled. Adriatic Sea climatology (Grbec et al. 2006) reveals higher-than-average salinity in all layers, likely caused by the combination of exceptionally warm summer weather in 2003 and lack of precipitation. Strong intrusion of Levantine Intermediate Water, as confirmed by XBT measurements (Morovićet al. 2006), probably transported new and rarely observed species that were entrapped by the cyclonic gyre of the Southern Adriatic, resulting in medusan greater population densities. This could be related to the 26 species identified in the present study. There is an important verification of a new species, H. bigelowi, first noted in the Mediterranean Sea (Gili et al. 1998) and in the South Adriatic (Benovićet al. 2005). Cunina globosa and A. australis were known only from historical investigations (Neppi 1912; Pell 1938; Benović & Bender 1987). The genus Amphinema rarely was reported from deep samples analysed by earlier investigators in the Adriatic, and those specimens generally were in poor condition. Identified as Amphinema dinema, they were considered to have derived from the Northern Adriatic (Benović & Lučić 1996). Forty-three specimens of Amphinema were collected in the present study, and with careful examination these were identified as A. rubra, a species known to inhabit mesopelagic and deep layers in the Mediterranean and elsewhere (Gili et al. 1998). It is likely that specimens from the deeper layers of the Adriatic previously identified as A. dinema were, in fact, A. rubra. This was one of the most frequently observed mesopelagic medusa (> 90% at 200–400 m).
Medusan densities above 100 m, comparable to those found in spring 2002 in the same area, were among the highest reported for any open-sea environment (see Benovićet al. 2005). A few highly adaptable species frequently dominated planktonic cnidarians (Gili et al. 1987). Trachymedusae R. velatum and A. hemistoma, as well as L. tetraphylla, traditionally are among the most frequently encountered hydromedusae in the Mediterranean (Benović & Bender 1987; Gili et al. 1987), although L. tetraphylla has been rare in recent investigations (Batistićet al. 2004; Benovićet al. 2005).
The first investigation of diel vertical migration (DVM) in this area documented extensive migrations of S. albescens (Benović 1973). The present data support this observation and, owing to the finer scale of temporal sampling (6-h intervals), offer more detailed insight into medusan species composition and diel vertical patterns.
Of the most common medusae, seven exhibited substantial depth range variations: S. albescens (15–1200 m), R. velatum (0–800 m), P. incolorata (100–1200 m), O. funerarium (200–1200 m), A. australis (200–1200 m), A. rubra (100–800 m), and R. singulare (15–600). The WMD calculations showed the highest DVM ranges for the deep-sea species S. albescens, O. funerarium, and A. australis. Aglaura hemistoma primarily is non-migratory. Rhopalonema velatum, P. incolorata, and R. singulare migrated in both directions at evening and night. Amphinema rubra migrated to deeper waters. This may be triggered by avoidance of predators or competitors in the surface at night and by light sensitivity, as some species detect light even at the ultraviolet end of the spectrum (Heywood 1996). Thus, different populations that could be associated with layers characterized by species-specific preferences for light intensity may tend to stay within a layer of relatively constant light intensity. Although many medusae lack ocelli, certain neurons may be stimulated directly by changes in light (Anderson & Mackie 1977) and pressure (see Arai 1992).
Although the vertical migration habits of various medusae have been correlated with light and various hydrographic parameters, not all species respond to these stimuli (Pagès & Gili 1992). Foraging strategies, which vary among planktonic cnidarians, especially hydromedusae (Mills 1981; Costello 1992; Purcell 1997; Costello & Colin 2002; Raskoff 2002; Colin et al. 2003), also are important. Over the short periods of most observations, most species appear to feed continuously. Some, however, exhibit diel changes in feeding activity. This could be recognized by the overlap of the PAR spectrum calculated from sampling depth ranges (Fig. 15, horizontal lines) of dominant migrant S. albescens and its potential prey A. rubra, P. incolorata, and R. singulare (Raskoff 2002). Apparently, they start downward migration, thus scattering the population in the water column, when predators start upward migration. This interplay of environmental and trophic factors may explain some of the differences observed in medusan DVM, where the range of preference to different light intensities during the daily maximum light incidence corresponds to the daily vertical position and vertical movement of each species.
In addition to WMD, which describes the relative vertical position of medusae, there are significant correlations between abundances and daily distribution of common medusae and their typical prey, especially microzooplankton and some of the predominant copepods. Many carnivorous zooplankton use tactile stimuli, rather than vision, to locate prey, and hence probably catch zooplankton equally well in darkness as in daylight (Hays 2003). Such predators can simply track the vertical movements of their prey (Hays 2003). The numerous copepodites in the manubrium and radial channels of R. velatum could suggest that this carnivore feeds continuously in the prey-rich layers.
Aglaura hemistoma generally was confined to the layer above the thermocline, as previously reported by Pagès & Gili (1992) and Buecher & Gibbons (1999). As an omnivore that feeds on microphytoplankton and protists (Colin et al. 2003), this unique species is adapted to the high light intensity, high temperature, and relatively low prey levels typical of the surface. It does not appear to undertake vertical migrations, despite higher concentrations of prey in deeper layers (Pearre 2003) or the energetic benefit it might realize by inhabiting the cooler water below the thermocline (Ohman 1990).
There also are medusae adapted to the lower temperatures of the deeper layers, for which the thermocline of subtropical seas is an effective upper barrier. The most numerous medusa, R. velatum, was very rarely found above the thermocline and never during midday, when surface temperatures are highest. Solmissus albescens similarly occurred below the thermocline and was associated with low light intensities; even the low intensity of moonlight modifies its maximum upper depth (Benovićet al. 2005). It is, however, known to migrate to the surface in spring, when it has been seen by blue-water divers (V. Onofri, personal communication).
Two deep-living medusae, O. funerarium and A. australis, were collected regularly below 600 m, with night-time excursions to mid-water depths. A significant positive correlation with T. mayumbaensis suggests that these medusae prey on this small deep-sea copepod and its developmental stages. Moreover, the stable assemblage of deep-sea microzooplankton in the Southern Adriatic (Kršinić 1998; Kršinić & Grbec 2002, 2006) suggests a complete food-chain within this layer. Different zooplanktonic groups thus appear to form assemblages that co-occur consistently over space and time.
Our findings contribute to knowledge of the population composition, vertical trophic relationships, and DVM of Adriatic medusae. They are broadly consistent with earlier and contemporary data on bathymetric distributions of medusae and other zooplankton in this area (Benović 1976; Hure et al. 1980; Kršinić 1998; Benovićet al. 2005; Lučićet al. 2005) and suggest long-term stability of deep water fauna of the Mediterranean Sea (Gili et al. 1998; Buecher & Gibbons 1999). One advantage of short-term repetitive sampling, such as that used in this study, is that it can reveal important relationships between medusan DVM and environmental variables such as hydrographic features, light intensities, and potential prey densities. These patterns are important for understanding the role of planktonic cnidarians in the marine food webs.
Summary
The present work reports data for medusan DVM at an open-water station in the oligotrophic South Adriatic Sea sampled at morning, midday, evening and night. Among the 26 species identified in the present study, the most abundant hydromedusa was R. velatum, followed by A. hemistoma, R. singulare, P. incolorata, and S. albescens. The less numerous but frequently occurring species were A. australis, A. rubra, and O. funerarium. Seven medusae exhibited substantial depth range distribution. The highest DVM ranges were noted for the deep-sea species S. albescens, O. funerarium, and A. australis. Rhopalonema velatum, P. incolorata, and R. singulare migrated in both directions at evening and night, whereas Amphinema rubra migrated only to deeper waters. Aglaura hemistoma primarily is non-migratory. The interplay of environmental and trophic factors may explain some of the differences observed in medusan DVM: (i) for most medusae, a thermocline at about 15 m depth was an effective upper barrier; (ii) different populations associated with layers characterized by species-specific preferences for light intensity tend to stay within layers of relatively constant light intensity; (iii) the significant correlations in DVM were noted between the common medusae and their typical preys. Our findings contribute additional and important understanding of the role of planktonic cnidarians in the marine environment.
Acknowledgements
This work was supported by the Ministry of Science, Education and Sports of the Republic of Croatia, Research Project No. 275-0982705-3047 and Croatia-USA Cooperation in Science and Technology, Project NSF – OCE 0623508.


