Quantifying Spatial Patterns of Intertidal Biodiversity: Is Movement Important?
Abstract
Abstract. Small-scale patterns of low-, mid- and high-shore intertidal species density, richness and abundance were systematically examined to assess the potential influence of ‘mobility’ on spatial community dynamics and diversity. Mobile taxa outnumbered sessile species by approximately 2:1, whereas sessile individuals were over 12 times as numerous as mobile ones over the entire study site. Patterns of density, richness and abundance differed with shore level and substratum. The results also highlighted the importance of clearly distinguishing between species density and species richness when examining spatially quantitative data. The rank order of habitats from highest to lowest species density was not the same when analysed in order of species richness. The potential for the mobile proportion of assemblages to influence small-scale diversity assessment through movement was greater at mid- and high-shore zones because the ratio of mobile species was higher and abundance (relative to the lower shore) was low. These observations might reflect the relative influence of the land–sea gradient of immersion on diversity and mobility in intertidal communities. The influence of mobile organisms on marine ecosystem function may be significant because small-scale patterns of movement are known to positively influence biodiversity. High richness paired with low abundance, however, may result in underestimating the functional role of mobile intertidal species.
Problem
Growing awareness of biodiversity issues has brought the need for comparable and meaningful measures of diversity at many scales into sharp focus (Gray, 1997; McCann, 2000). In particular, factors controlling the biodiversity of an area, and thus ecosystem function, are central to biodiversity research (Tilman, 2000). One important aspect is the influence of patterns of movement and migration within the motile component of assemblages on both community structure and diversity measurements, particularly because these are believed to be important mechanisms in maintaining biodiversity (Kerr et al., 2002). Biodiversity measurements are usually a snapshot in space and time and can clearly be affected by dispersal, movements and migrations of organisms. Moreover, the influence of migration and movement is generally better understood in terrestrial habitats versus marine habitats. This may reflect the supposed ‘open’ nature of the marine environment compared with ‘biogeographic barrier-rich’ terrestrial systems (Gee & Warwick, 1996; Myers, 1997). Despite this, animal movements and migrations in intertidal zones have been investigated, especially where variability in abundances of common species at various spatial scales is being examined (Menge, 1991; Underwood & Chapman, 1996).
In general, however, the relative contribution and interactions of mobile and sessile organisms to the diversity of an area, and thus the potential for animal movements within assemblages to influence the biodiversity measurements, is poorly understood. Whilst patterns of marine biodiversity over large spatial scales or geographical extents are frequently examined (Gee & Warwick, 1996; Roy et al., 1998; Ellingsen & Gray, 2002), small spatial scales are more significant where daily, small-scale, behavioural movements of organisms are concerned (Underwood & Chapman, 1996). Experimentally, localised interaction and movement (in microorganisms) maintain biodiversity when compared with larger-scale dispersal (Kerr et al., 2002). Small-scale movements and migrations of marine fauna have been well studied in the water column, particularly detailing zooplankton diurnal vertical migrations and their potential influence in maintaining pelagic diversity (Beaugrand & Ibañez, 2002). Examples of the effects of animal movement within intertidal assemblages are much less common, despite work on the behavioural movements, activity and migration of particular taxa (e.g. amphipods, Williams, 1995; the gastropod Monodonta labio, Takada, 1996; mudflat fish fauna, Morrison et al., 2002). The littoral zone, being the natural interface between the marine and terrestrial environments, is ideal for investigating the influence of animal movement patterns on diversity because a suite of environmental factors underlies both diversity and the mobile capacity of invertebrates here. This enables assessing the relative importance of the motile component within assemblages against factors such as immersion and substratum when quantifying biodiversity. On a boulder shore, for example, migration in response to experimental environmental change played an important role in the short-term variability of community structure (Takada, 1999).
We measured the relative contribution and interaction of all mobile and sessile species to the diversity of an intertidal zone. This was carried out on a relatively small spatial scale (within a 2 km geographical extent and maximum 4.2 m intertidal range) with varying physical factors. The specific aims of our study were to: (i) quantify the mobile to sessile ratio of faunistic species richness, species density and abundance in low-, mid- and high-shore assemblages, (ii) quantify the variability and relative contributions of specific mobile and sessile taxa to community dissimilarities between substratum types and shore levels and (iii) quantify the potential influence that the motile component of an assemblage has on diversity and abundance assessments.
Material and Methods
1. Study site
The study was carried out at Lough Hyne Marine Nature Reserve in south-west Co. Cork, Ireland (51°29′N, 9°18′W). Lough Hyne is a small (approximately 0.75 km2), sheltered sea lough with a narrow opening to Barloge Creek at ‘the Rapids’, which in turn is connected to the adjoining Atlantic coast. An asynchronous tidal cycle and reduced intertidal zone exists within Lough Hyne compared with that of the adjoining coast because of a sill at ‘the Rapids’. A comprehensive account of the physical attributes and bathymetry of the Reserve can be found in Kitching & Ebling (1967). Lough Hyne has been described as a subtidal biodiversity hotspot (Bell & Shaw, 2002), but the littoral zones within it have received relatively little attention (Little, 1991).
In the present study, 22 intertidal locations were sampled within Lough Hyne and a further six outside the Lough in Barloge Creek. The sample locations were all 200 m apart (Fig. 1). Sheltered shores, including Lough Hyne, often have a variety of substratum-derived habitat patches (rocky outcrops, boulder scree, gravel patches and mud flats). The sampling design here therefore incorporated this physical variation in addition to the biological diversity it supports. All sampling was carried out between January 2001 and December 2001.
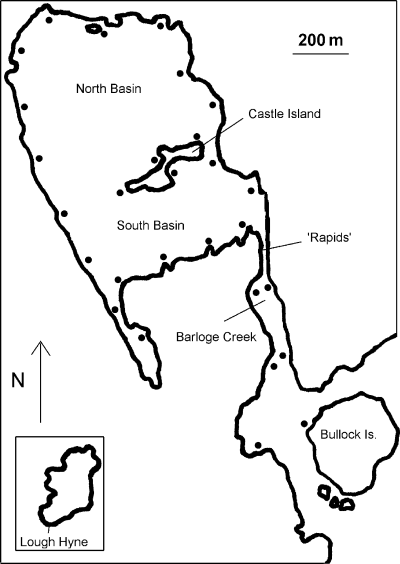
Lough Hyne Marine Nature Reserve with dots indicating the sample locations.
2. Protocol
At each location, three haphazardly placed replicate 0.25 m2 quadrats were used to quantify the abundance of organisms of high-, mid- and low-shore intertidal assemblages, (i.e. nine quadrats per location). The percentage substratum type of each quadrat was recorded in accordance with the Wentworth scale (including the categories bedrock, boulder, cobble, pebble, gravel; Wentworth, 1922). For data analysis, the substratum was retrospectively divided into three categories – bedrock, loose rock (mixed boulders and cobbles) and ‘gravel’ (mixed pebble/gravel). Few studies can practically measure factors such as substratum complexity, habitat heterogeneity, rugosity and the fractal nature of surfaces. Some of these factors influence both biodiversity measurements on rocky shores (Johnson et al., 2003) and the nature of communities on intertidal boulders (McGuinness & Underwood, 1986). In the present study, the same sample unit (0.25 m2 quadrat) was used in all substratum types; it standardised sample effort such that each habitat was thoroughly, consistently and comparably sampled. Shore levels were standardised using tide tables as in Benedetti-Cecchi & Cinelli (1997). Low-, mid- and high-shore levels were determined by marking the predicted tide levels using tide tables for sampling outside Lough Hyne and using the appropriate correction for inside the Lough (Kitching, 1987; Murphy, 1999). Because of the reduced intertidal zone and asynchronous tides inside Lough Hyne because of the rocky sill at its entrance, a correction for Chart Datum is required to ensure that the shore levels within the Lough are equivalent of those outside (Kitching, 1987). MLWS, MHWS and mid distance between these levels were used and quadrats were placed on emergent substrata at each shore level. The sampled shores were not steep, and the distance from low to high levels averaged 4.5–6 m. All sampling was carried out by a single person to avoid potential observer influence.
All organisms >1 mm were identified to the lowest reliable taxonomic unit (mainly species) and were recorded on data sheets; ‘taxa’ (or taxon) is used throughout the text when referring to organisms that were not determined to species level. All colonial animals (bryozoans, hydrozoans and some ascidians) were counted as individual colonies. Encrusting sponge species were counted as individual patches, as in Bell & Barnes (2000). Although this study focused on faunal assemblages, algal species were also recorded and counted as plants per quadrat (holdfasts or stipes per quadrat; Taylor, 1998; Melville & Connell, 2001). Subsampling in the form of three 10 cm2 quadrats randomly placed within each 0.25 m2 quadrat was conducted when certain taxa occurred too densely to be practically counted, e.g. barnacles, serpulid and spirorbid polychaetes and the littorinid Melaraphe neritoides.
3. Data analysis
Motile species were defined as ‘any epibenthic animal that regularly moves across the benthos and therefore had the ability to move outside the sampling quadrat’. Sedentary species were included as sessile taxa (e.g. anemones).
Differences between the mobile and sessile components of assemblages at each shore level were assessed using species density, species richness and abundance of individuals. Species density or the number of species per quadrat was used to quantitatively assess mobile and sessile species distributions, shore level and substratum variability and in SIMPER (similarity percentages) analysis. SIMPER analysis (in PRIMER, Plymouth Marine Laboratory) was used to determine the taxa most responsible for the percentage dissimilarities between (and similarities within) shore levels and substratum types. This was achieved using Bray-Curtis similarity analysis of hierarchical agglomerative group average clustering for shore level and substratum samples (Clarke & Warwick, 1994). Species density data were used in all SIMPER analyses with a log(x + 1) transformation. This ‘dampens’ the extremes in the data, allowing rare species to exert some influence on results whilst reducing the potentially overwhelming impact of the most common taxa.
Species accumulation curves were drawn to assess species richness or the number of species per abundance of individuals using ECOSIM simulation software (Gotelli & Entsminger, 2001). Generally, it is desirable to compare species richness by standardising each sample to a certain level of abundance and thus determine an ‘expected species richness’ for the same number of individuals in each sample (analogous to rarefaction; McCabe & Gotelli, 2000). This was not appropriate here because the lowest abundance value for a replicate was three individuals, which was too low for such a comparison. It was possible, however, to compare expected species richness of shore zones using the species accumulation curves and determining the expected species richness of the low- and mid-shore with the actual richness of the upper shore (as the upper shore had the least number of individuals). Species richness was also used to compare differences in substratum type relative to species density.
Differences in the number of ‘rare’ species represented by mobile and sessile taxa was investigated through determination of ‘singletons’ or the taxa represented by one individual only; ‘doubletons’ or taxa represented by two individuals only; ‘uniques’ or taxa found at one sample (and site) only; and ‘duplicates’ or taxa found at exactly two samples/sites only (Colwell & Coddington, 1994; Ellingsen & Gray, 2002).
A detrended correspondence analysis (DCA) was carried out on the data matrix of species abundances [log(x+1) transformed data] and the first two axes plotted on a two-dimensional scatter plot to determine the spread of taxa by samples on the shore. This was carried out with and without algal data to determine the underlying structure of the mobile and sessile components of the community. Algae were isolated in this analysis to assess their influence as a secondary substratum on faunal distributions.
Two-way fixed factor analyses of variance were used to assess species density with shore level and substratum. Levene's test was used to test the assumption of homogeneity of variance. The assumption was accepted in all cases (P > 0.05) with the exception of sessile species density and abundance. Despite the robust nature of ANOVA to deal with moderate violations of the assumption of homogeneity, it was deemed inappropriate in this case to use ANOVA because of the nature of the heterogeneity (Underwood, 1997). Therefore, a Kruskal-Wallis test was used for all abundance comparisons and those of sessile species density because this test is usually little affected by heterogeneous data (Zar, 1996). Finally, regression analysis was used to assess the potential effect that the mobile proportion of assemblages has on species density, richness and abundance.
Results
1. Biodiversity, rarity and species distributions
A total of 97 mobile faunal taxa (species and other taxa) and 56 sessile taxa were sampled over the entire study site. The Mollusca were the most taxon-rich group within the mobile forms, while Bryozoa were the most diverse sessile phylum (Table 1). The number of mobile taxa found at each shore level decreased from low to high shore, with 87% found in the lower shore. The Echinodermata, which were represented by seven species, were found only in the lower shore. Overall, 27% of the mobile taxa were found on all three shore levels, primarily because of molluscan species. Of the 56 sessile taxa found, all but one (Chthamalus montagui) were found on the lower shore, while 20% were found on all shore levels.
| Phylum | number of taxa (species) | number of taxa found at each shore level | number of taxa found at one, two or all three shore levels | ||||
|---|---|---|---|---|---|---|---|
| low | mid | high | one | two | three | ||
| mobile | |||||||
| Platyhelminthes | 2 | 2 | 2 | 1 | 0 | 2 | 0 |
| Nemertea | 1 | 0 | 1 | 0 | 1 | 0 | 0 |
| Annelida | 11 | 10 | 8 | 1 | 4 | 6 | 1 |
| Chelicerata | 4 | 3 | 3 | 3 | 1 | 1 | 2 |
| Hexapoda | 4 | 2 | 2 | 3 | 2 | 1 | 1 |
| Myriapoda | 1 | 0 | 1 | 1 | 0 | 1 | 0 |
| Crustacea | 25 | 22 | 14 | 9 | 11 | 7 | 7 |
| Mollusca | 40 | 37 | 24 | 18 | 16 | 9 | 15 |
| Echinodermata | 7 | 7 | 0 | 0 | 7 | 0 | 0 |
| Chordata | 2 | 1 | 1 | 0 | 2 | 0 | 0 |
| total | 97 | 84 | 56 | 36 | 44 | 27 | 26 |
| sessile | |||||||
| Porifera | 7 | 7 | 3 | 1 | 4 | 2 | 1 |
| Cnidaria | 7 | 7 | 5 | 1 | 2 | 4 | 1 |
| Annelida | 2 | 2 | 2 | 2 | 0 | 0 | 2 |
| Crustacea | 7 | 6 | 7 | 5 | 0 | 3 | 4 |
| Mollusca | 9 | 9 | 6 | 3 | 3 | 3 | 3 |
| Bryozoa | 19 | 19 | 15 | 0 | 4 | 15 | 0 |
| Chordata | 5 | 5 | 0 | 0 | 5 | 0 | 0 |
| total | 56 | 55 | 38 | 12 | 18 | 27 | 11 |
Only two taxa were very common (represented in over 50% of the samples; Fig. 2) within the 63 m2 sampled in the approx. 2 km geographical distance. These were the introduced barnacle Elminius modestus (found in 205 samples) and the gastropod Littorina littorea (171 samples). These species were also the most abundant sessile and mobile taxon, respectively. In contrast, the number of rare species was higher than the number of common species: 22 taxa were found in one sample only (uniques) and 17 were duplicates (restricted to only two samples). Rarity in mobile taxa was greater than in sessile organisms: 14 mobile and three sessile species were singletons (represented by just one individual). The number of mobile doubletons was twice that of sessile ones (six and three, respectively).
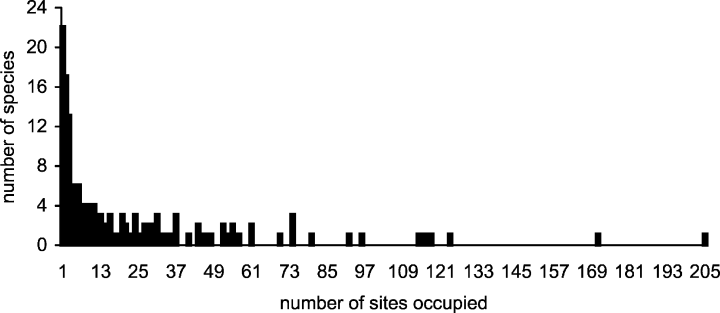
The range size distribution of species. Range size is the number of samples occupied by a species out of the total number of samples in the study (252).
The abundances of sessile and mobile individuals were 221,385 and 17,861, respectively. This ratio (>12:1) contrasts with that of taxa richness, with approximately twice as many mobile species as sessile ones. Rank abundance curves for both sets of fauna confirm the higher abundances of sessile individuals as well as greater dominance of fewer species in this group compared with mobile taxa (Fig. 3).
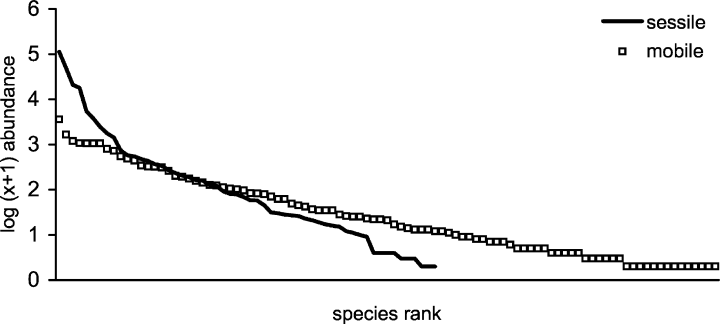
Species (rank) dominance for mobile and sessile taxa with abundance values log10 (x+1) transformed.
Species density decreased from low to high shore in both sets of fauna, and there was a significant (Table 2A) difference in faunal species density with shore level and at all pairwise comparisons of shore level (post hoc Tukey test, all P < 0.005). The mean species density values for low-, mid- and high-shore samples were 21.26, 13.95 and 5.51, respectively. The differences in species density for mobile (Table 2B) and sessile (Kruskal-Wallis test; H = 146.66, df = 2, P < 0.001) taxa with shore level were also significant, although low- and mid-shore mobile species density did not differ significantly (post hoc Tukey test; P > 0.05). The abundance of mobile and sessile individuals also differed significantly with shore level (Kruskal-Wallis test; df = 2, mobile H = 48.47, P < 0.001, sessile H = 53.70, P < 0.001).
| source of variation | df | (A) fauna species density | (B) mobile species density | ||||
|---|---|---|---|---|---|---|---|
| adj. MS | F | P | adj. MS | F | P | ||
| shore height | 2 | 3.5794 | 103.98 | *** | 1.3907 | 39.45 | *** |
| substratum | 2 | 1.3013 | 37.77 | *** | 1.0875 | 30.85 | *** |
| shore height * substratum | 4 | 0.0123 | 0.36 | n.s. | 0.0703 | 2 | n.s. |
| residual | 243 | 0.0345 | 0.0352 | ||||
- *** indicates a significance level of P < 0.001; n.s. = not significant (P > 0.05).
2. Underlying assemblage structure and influential species
A detrended correspondence analysis was carried out on the data matrix and plotted on a two-dimensional scatter plot to visualise the spread of taxa by samples (Fig. 4A and B). Fig. 4A shows the distribution of mobile and sessile taxa (eigenvalues: 0.5516, 0.3115 for the x- and y-axes, respectively), with a relatively strong gradient of increasing immersion from left to right along the x-axis. The y-axis, however, is difficult to explain despite its high eigenvalue; i.e. the PC2 scores did not separate species or samples into clearly discrete groups or a clear gradient. There was also a greater spread of mobile compared with sessile taxa along both axes as indicated by the mobile ‘outliers’ and relatively tightly packed sessile taxa in the low- to mid-shore area. When algae and lichen species abundance data for all samples were included in the analysis (Fig. 4B), the x-axis maintained its shore level gradient but the y-axis could now be explained through site energy, which increases from bottom to top. To illustrate this point, polygons indicating the taxa (incidentally all mobile) which were found in the highest and lowest energy sites were included in both scatter plots and were clearly separated along the y-axis in Fig. 4B. The inclusion of ‘flora’ also increased the explanatory value (eigenvalues: 0.6013, 0.3715) and strengthen the gradient of immersion along the x-axis. This is demonstrated by the high-shore taxa with low x-axis values (on the far left of the plot) being found exclusively in the high-shore samples (this was not the case when fauna alone was analysed). The greater spread of mobile versus sessile forms is also retained when ‘flora’ was added to the analysis.
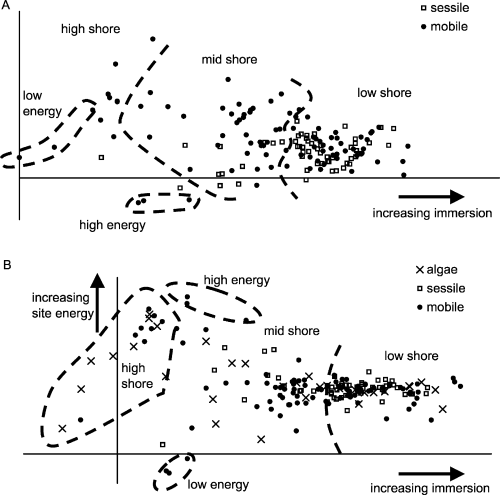
A detrended correspondence analysis (DCA) of species by samples on log10 (x + 1) transformed data. A: DCA excluding algae and lichen data with Eigenvalues of 0.5516 and 0.3115 for the x- and y-axes, respectively. B: DCA including algae and lichen data with eigenvalues for the x- and y-axes of 0.6013 and 0.3715.
Given the importance of immersion in structuring the intertidal community, SIMPER analysis was carried out to assess the species that defined similarity within and dissimilarity between shore levels. These data showed that the average similarity of samples within each shore level was 37.9%, 41.6% and 32.9% for the low-, mid- and high-shore zones, respectively. The six most important taxa contributing to these similarities are listed in Fig. 5. The cumulative contribution of the top six listed taxa to within-shore level similarity decreased with immersion. 83.5% of high-shore sample similarity was because of its six most important taxa, the highest six mid-shore taxa accounted for 62.1% of similarity, while the same is true of only 50.1% of the six key taxa for low-shore similarity. Only two mobile taxa are included in the six most important taxa defining low-shore similarity, contrasting with only two sessile forms each for the mid and high shore (Fig. 5).
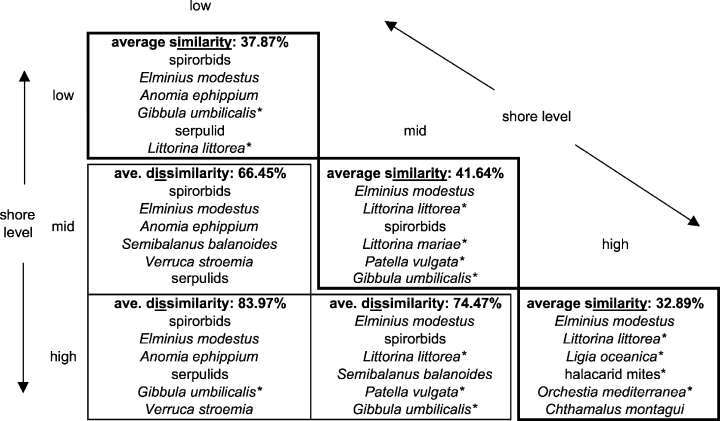
Results of SIMPER analysis showing the most important taxa responsible for similarity within and dissimilarity between shore levels. Asterisks indicate mobile taxa.
The average dissimilarity between each pairwise combination of shore levels and the six most important taxa contributing to this dissimilarity are also listed in Fig. 5. Sessile taxa dominate these inter shore level dissimilarities, particularly between the low and mid shore. In addition, only the barnacles Semibalanus balanoides and Verruca stroemia are included in the most important taxa accounting for between-shore level dissimilarity but not within-shore level similarity.
3. Species density versus species richness and habitat dissimilarity
Species accumulation curves for both mobile and sessile taxa showed that not only were shore levels significantly different in terms of species density, but that there was also a significant increase in species richness from high shore to low (Fig. 6). In particular, at no point along the curves for sessile species richness did the mean and 95% confidence limits for shore level overlap (Fig. 6A). For mobile taxa there was an overlap in the high- and mid-shore species accumulation curves below the level of 1500 individuals. The difference in mobile species richness below this level for these shore zones is insignificant, but the mid shore is significantly more species rich thereafter whilst the lower shore is consistently and significantly more species rich (Fig. 6B).
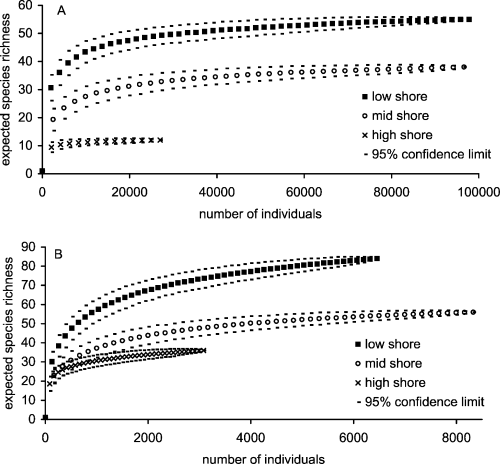
Species accumulation curves for sessile (A) and mobile (B) species at each shore level. Note the changes in scale for both axes between graphs.
There was a significant difference in species density between substrates, which was independent of shore level (see insignificant interaction in Table 2A). Both mobile (Table 2B) and sessile (Kruskal-Wallis test; H = 41.88, df = 2, P < 0.001) species density differed significantly with substratum, although some pairwise comparisons were not significantly different (e.g. mobile species density was insignificantly different between bedrock and gravel; Tukey test, P > 0.05). Because of differences in area sampled of each substratum type at each shore level, the area of these habitats and abundance of each taxon within them were scaled up or down to a standardised level to allow comparison of habitats within and between shore levels. These standardised data were used to assess and compare species density and species richness (Fig. 7); high-shore gravel was not analysed here because of its very low abundance level. For sessile taxa, low-shore loose rock was the most species dense, followed by low-shore gravel and bedrock. However, after rarefaction of habitats to 2767 individuals (level of abundance for mid-shore gravel), low-shore gravel was the most species-rich habitat, with an expected richness value of 34.7 (±2.1) compared with 30.1 (±3.8) species from loose rock on the same shore level (Fig. 7A). Although this comparison of expected species richness is not significantly different, it does constitute a reverse in the order of which habitat had the most species. In addition, mid-shore loose rock and low-shore bedrock had higher sessile species density values than mid-shore gravel, but when contrasted with species richness, these habitats were ranked below mid-shore gravel.
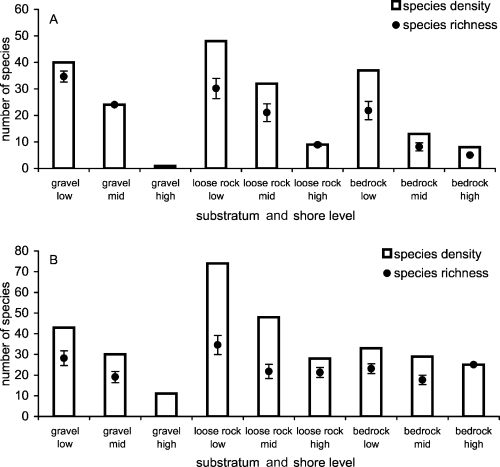
A comparison of species density and species richness for each substratum type at each shore level. A: For the sessile species comparison, expected species richness values are based on rarefaction of habitats to 2767 individuals (mid-shore gravel). B: For mobile species, expected species richness is based on rarefaction to the abundance level of high-shore bedrock (279 individuals). Error bars for expected species richness are the 95% confidence limits.
Similar contrasts occurred for mobile taxa (Fig. 7B). Habitats were rarefied to the lowest abundance level, which were 279 individuals (high-shore bedrock). When expected species richness values were compared, this habitat switched from being ranked the lowest in terms of species density to the third highest in species richness. The mid-shore loose rock habitat ranked second highest for species density but fourth lowest for species richness. Thus, the rank order of habitats from highest to lowest number of species was altered when comparing density and richness, and the range of values for species richness was much narrower than that for species density.
The SIMPER analysis was also used to investigate the most important discriminating taxa between habitats, using species density data. Although not significantly different in terms of species density, the analysis revealed that between bedrock and gravel substratum types there was an average assemblage dissimilarity of 70.3% and 87.9% in the mid- and high-shore levels, respectively. Of the mid-shore value (70.3%), the 10 most discriminating taxa accounted for 61.4%, including five mobile and five sessile taxa. In the high shore, the ten most discriminating taxa accounted for 72.56% of the dissimilarity and nine of these were mobile. Furthermore, in both mid- and high-shore comparisons of bedrock and gravel, the most discriminating taxa were not indicative of either substratum. Therefore, both substratum types made a similar contribution to the dissimilarity, and neither fauna dominated the contrast. This compares with the high-shore contrast between bedrock and loose rock (no significant difference in sessile species density and 67.3% average dissimilarity), whereby the ten most discriminating taxa (eight mobile, two sessile) were more indicative of the loose rock habitat than bedrock.
4. Mobility and ecological assessment
Analysis of variance revealed a significant difference in the ratio of mobile to sessile species with shore level and substratum and an insignificant interaction between the two factors (Table 3). Post hoc tests showed that the proportion of mobile to sessile species density decreased significantly with shore level (Fisher's pairwise comparison, low < mid < high) and that pairwise comparisons of substratum differences were significant except for bedrock and loose rock (bedrock : loose rock < gravel). Thus, although species density decreased as height on the shore increased, the proportional contribution of mobile taxa had the opposite trend. Of a total of 84 samples at each shore level, 46 low-shore-, 76 mid-shore- and 77 high-shore samples had assemblages with a mobile taxa contribution of ≥50%.
| source of variation | df | ratio of mobile to sessile species | ||
|---|---|---|---|---|
| adj. MS | F | P | ||
| shore height | 2 | 52.435 | 38.64 | *** |
| substratum | 2 | 17.753 | 13.08 | *** |
| shore height * substratum | 4 | 2.291 | 1.69 | n.s. |
| residual | 243 | 1.357 | ||
- *** indicates a significance level of P < 0.001; n.s. = not significant (P > 0.05).
Similarly, differences in the proportion of mobile abundance per sample were significant with shore level (Kruskal-Wallis test; H = 23.38, df = 2, P < 0.001) and substratum (Kruskal-Wallis test; H = 34.6, df = 2, P < 0.001). There was a strong negative correlation between total abundance and proportion of mobile individuals in samples and this relationship was consistent at all three shore levels (Fig. 8A, B and C). In contrast, correlations between total species density and the proportion of mobile species per sample were weak (Fig. 8D, E and F) and insignificant in low- and high-shore zones (Fig. 8D and F, respectively). Overall, when data for all shore levels were combined, as the abundance of individuals in a sample increased, the motile proportion of that abundance decreased (Fig. 9A). A similar, but much weaker relationship was found between species density and the proportion of mobile species (Fig. 9B). Therefore, in this situation, the motile component of the assemblage has little potential for influencing community assessment in areas of high abundance. In terms of species density, a very weak and variable correlation at different shore levels highlights the relatively equal contribution of mobile and sessile taxa in assemblages with both high and low numbers of species.
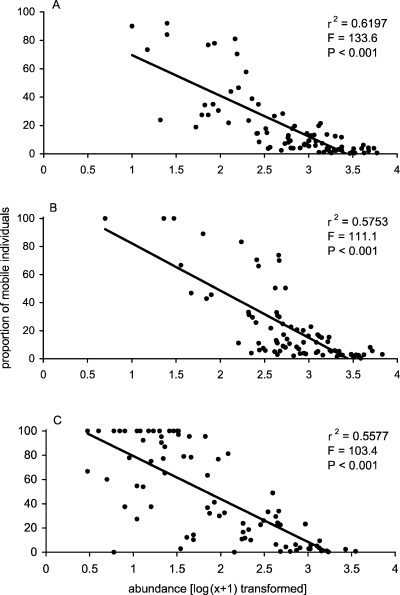
Scatter plots of total species abundance versus the proportion of mobile abundance per sample in low- (A), mid- (B) and high- (C) shore levels.
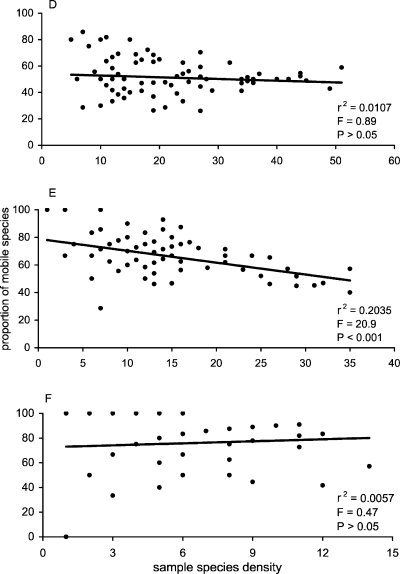
Scatter plots of total species density versus the proportion of mobile species density per sample for low- (D), mid- (E) and high- (F) shore levels.
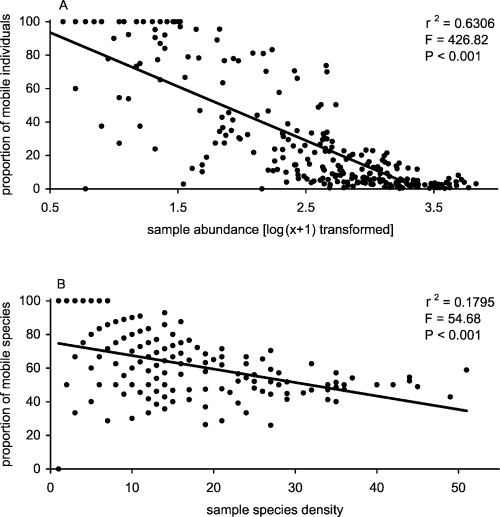
Scatter plots of sample abundance (A) and species density (B) for all replicates versus the proportion of each that the motile component of assemblages makes up.
Discussion
Factors influencing the biodiversity and community ecology of intertidal zones are often investigated to test hypotheses on the generality of patterns that immersion and other physical and biological factors exert on assemblages (Connell, 1972; Paine, 1974; Underwood & Chapman, 1996, 1998; Benedetti-Cecchi & Cinelli, 1997; Menconi et al., 1999; Menge & Branch, 2001). The most recent of these studies have shown that variation in the distribution and abundance of intertidal organisms exists at many scales and that consistent zonation patterns within and between shores are uncommon (see also Foster, 1990). The focus has been on the traditional model of vertical zonation (Barnes & Hughes, 1988) because its generality is apparently limited (Benedetti-Cecchi & Cinelli, 1997). Nonetheless, tidal rise and fall remains a dominant and obvious – but not sole – physical parameter defining intertidal distributions (Raffaelli & Hawkins, 1996; Menconi et al., 1999). This study highlights an important and almost ubiquitous aspect of zonation: the decrease in abundance, species density and richness of organisms from lower to higher levels on the shore. In addition, the immersion gradient was the most dominant structuring agent of this intertidal community (Fig. 4). Our study, however, focused less on testing the generality of intertidal zonation and more on assessing the relative importance of zonation and other factors in structuring intertidal communities and on investigating small-scale biodiversity (metre to 100s of metres). This is one of few studies addressing factors that shape the whole macro-faunal community of an intertidal zone, especially across such a wide gradient of habitat and water flow as exists at Lough Hyne.
The large total number of species (153) found in the small geographical area (and narrow amplitude at most sample locations) of Lough Hyne is difficult to compare with other studies for two reasons: sample size and consideration of common species only. These factors greatly affect comparisons of diversity in different studies. Many studies of intertidal assemblages focus primarily on the abundance and distribution of common species or dominant space users, ignoring the role of less common or less dominant species. Our SIMPER results support other investigators approaches (e.g.Underwood & Chapman, 1998) because the most important taxa defining a shore level in this study were also the most important in discriminating between shore levels. Importantly, however, comparing the biota of substratum types did not show a similar trend: most species were indicative of one habitat or other. Choosing common or dominant taxa may therefore be inconclusive when studying patterns of intertidal variation on heterogeneous shores.
The influence of rare species and their occurrence in terms of sample-based and individual-based rarity should not be overlooked, especially since a common thread of enquiry in contemporary ecology is the reason why there are often many rare – and few common – species in a community (Gaston, 1994). The incidence of strongly right-skewed distributions of individuals among species is common in terrestrial, freshwater and marine systems, particularly at larger (>10 km) spatial scales. The present study also detected many more rare species than common and a similar trend was observed in terms of range size distribution or sample-based rarity, although clearly this is influenced by abundance-based rarity. Gaston (1994) noted that the number of species thought to occur in few samples is exaggerated because of the lower likelihood of observing numerically rare species in any given site. The scale at which these patterns were found in the present study is also interesting since smaller spatial scales tend to have bimodal rather than right-hand mode range size distributions (Gaston, 1994). Habitat heterogeneity may partly explain the patterns here because few species distributions encompassed all shore levels and substratum types, even in this narrow intertidal.
In terms of biodiversity assessment, rare species are clearly important because most definitions of diversity include both a species richness and evenness component. Indeed, rare species are crucial whenever estimated species richness is being interpolated and extrapolated (Colwell & Coddington, 1994; Gotelli & Colwell, 2001). This has important implications for conservation strategies because rarity and biodiversity are widely used as conservation criteria (Prendergast et al., 1993; Sanderson, 1996). Thus, the inclusion of as many components of assemblages as possible in scientific studies is all the more important. This is particularly true in cases where species most responsible for similarity and dissimilarity within and between habitats/areas are being investigated for conservation purposes.
Life-history strategies (e.g. mobile and sessile organisms) are also interlinked with biodiversity and rarity issues. Here we only examined this in terms of potential influence, but we are currently studying the actual rhythms of movement of a suite of species and their direct interrelationship in structuring assemblages and impacting diversity measurements. Lewis et al. (2002) found that the recovery of a benthic community in an impacted intertidal mudflat was influenced by the mobilities of the few species present. Costello & Myers (1996) reported that immigration of transient (and rare) amphipod species had a significant positive impact on measures of species richness. The relative spread of mobile and sessile species in the present study indicates how mobile and sessile taxa are distributed across physical gradients and how algal distribution (secondary substratum) can increase the interpretive value of underlying community structure. Mobile species outnumbered sessile ones by 2:1 and were much more widespread in the overall picture of underlying community structure (Fig. 4). This supports the traditional view that the distribution of mobile animals within the immersion (and site energy) gradient is less clumped or restricted than that of sessile organisms (Barnes & Hughes, 1988). The ratio of sessile to mobile individuals (>12:1) also indicates that both sessile species themselves and their individuals are clumped. Thus, the differences we measured in abundance and in sessile species density between shore levels and substrata mainly reflected variation among replicates rather than variation between factors (heterogeneity of variance), although differences between factors were also significant. The consequence of this to biodiversity assessment is potentially important if trends of sessile (fewer species but more individuals) and mobile (many species but fewer individuals) species diversity exist in other locations and in different habitats.
Since definitions of diversity vary substantially but generally include two components – the number of species and the evenness of individuals within those species – the terms used must be clearly specified. Species density is commonly mistaken for species richness, whereby comparisons of the number of species from one area or sampling unit to another neglect differences in abundance or density of organisms (Gotelli, 2001). It is important to distinguish species density and (or versus) species richness because they can yield confounding results (McCabe & Gotelli, 2000; Gotelli & Colwell, 2001). Thus, the present study has shown that even minor differences between both measures change the relative order of most diverse to least diverse habitat. Although we show this on only a very small scale here, this alternation of rank has clear implications in terms of diversity and conservation. In addition, the large number of replicate samples at each shore level provided an indication of the minimum density of individuals required to determine significant differences between high- and mid-shore mobile species richness. It also demonstrates that extrapolating an estimate of species richness for sessile fauna is not required because asymptotic richness was already reached (Fig. 6A). That similar asymptotes were not reached for mobile fauna at all shore levels (Fig. 6B) indicates the high level of rarity (singletons and doubletons) within this fauna here and a higher probability that more rare species remained undetected despite the many samples.
Underwood & Chapman (1996) considered that if behaviour of mobile macro-organisms in intertidal zones determined distribution patterns then considerable variability at short temporal and spatial scales would exist. Given the interrelationship between number of species, abundance of individuals and life-history strategy in the present study, the potential influence of mobile species on biodiversity assessment would also be expected to occur at small spatial scales. Overall, as the abundance of individuals in a sample increased, the motile proportion of that abundance decreased (Fig. 9A). A similar but much weaker relationship was found between species density and the proportion of mobile species (Fig. 9B). This suggests a potentially significant effect of the mobile component on biodiversity assessment in areas of low abundance. This is particularly the case on the mid and upper shore, where the proportion of mobile to sessile species was much higher than in low-shore levels. This may reflect the differential effect of the marine-terrestrial gradient on mobility and diversity at different shore levels (Barnes & Hughes, 1988). The associated influence of mobile species on intertidal community structure would also be expected to occur on small spatial and temporal scales. Overall, this study has shown that because biodiversity assessment is usually a snapshot in space and time, the diversity and abundance of whole macro-faunal communities must be quantified to account for the potential influence of movement or migration.
In terms of intertidal biodiversity, Archambault & Bourget (1996) found that its two components – number of species and abundance – were best explained at the 1 km scale and the < 20 cm scale, respectively. Accordingly, movement by mobile fauna would exert an influence at meso- and micro-spatial scales. Since local-scale movement may promote biodiversity (Kerr et al., 2002), which in turn could positively affect ecosystem function, our results pose an important question. Given that the mobile component is relatively poorly ranked in terms of individual abundance but quite highly ranked in terms of species density and richness, what implications does this have on the influence that mobile species (or any rare species) exert on ecosystem function? Although mobile taxa outnumber sessile ones quite significantly at all shore levels, is their influence on intertidal ecosystem function diminished because of the relatively few individuals present? This issue clearly affects the interpretation of biodiversity patterns and, therefore, conservation strategies.
Summary
Measures of species density, richness, rarity and abundance in the intertidal zone have highlighted the differences between spatial patterns of mobile and sessile taxa. Density, richness and abundance tended to decrease with increased height on the shore. However, mobile species density and richness were higher, whilst abundance was lower, than sessile species throughout the study site. The influence of movement patterns on biodiversity and community structure is therefore probably greater on mid- and high-shore zones where abundance was lower and the mobile component was higher. This indicates the importance of movements and of sampling entire communities in assessing biodiversity. Further implications for ecosystem function and conservation strategies may be significant and require more research.
Acknowledgements
The authors wish to thank Douglas Watson, Emma Verling, Kate Rawlinson and Christina Simkanin for field assistance and Simon Harrison and James Bell for advice on analysis. Thanks also to Declan O'Donnell (Duchas) for granting a permit to conduct research at Lough Hyne Marine Nature Reserve. We are grateful to John Pearse and two anonymous reviewers whose comments greatly improved the manuscript. This work was funded by the Higher Education Authority (H. E. A.), Ireland.


