Assessment of traditional versus geometric morphometrics for discriminating populations of the Tropheus moorii species complex (Teleostei: Cichlidae), a Lake Tanganyika model for allopatric speciation
Quantitativ morphologische Diskriminierung von drei Tropheus-Populationen (Teleostei: Cichlidae) des Tanganyikasees
Abstract
enLake Tanganyika harbours the oldest and ecologically, morphologically and behaviourally most diverse species flock of cichlid fishes. Its species are excellent subjects for the study of explosive speciation and adaptive radiation. Many species are subdivided into numerous genetically and phenotypically distinct populations, often classified as distinct geographical races or colour morphs, which mostly differ in colour and much less in terms of morphology. This study for the first time quantifies morphological differences among such morphs by studying three populations of Tropheus moorii. We compared ‘traditional morphometrics’ (TM) and ‘geometric morphometrics’ (GM) to explore their potential for discriminating populations. So far species description and population discrimination are almost solely based on TM in the form of standardized measurements, although specialists are aware of their lack of diagnostic power for discrimination of closely related entities. Moreover, comprehensive TM measurements are time consuming and can best be done on dead specimens which have to be preserved in the case re-measuring is necessary. In contrast, GM can also be based on photographs and computer scans of anaesthetized fish, so that the same individual can be repeatedly analysed during its ontogeny. Here, we show that GM is more flexible in data acquisition and more powerful in the discrimination of species and closely related populations. While TM is restricted to distances and ratios of distances, GM not only includes these measurements indirectly, but also allows for body shape analysis using a semi-landmark approach. It can be equally standardized as TM by defining diagnostic landmarks. Data description by canonical variate analysis was most informative using GM data including semi-landmarks, whereas differences between populations were significant (p < 0.05) based on both morphological approaches.
Zusammenfassung
deDer Tanganyikasee gehört zu den komplexesten und mannigfaltigsten Süßwasserökosystemen der Welt. Er bietet Lebensraum für einzigartige Buntbarschartenschwärme, welche, jeder für sich, aus hunderten endemischen Arten bestehen (Fryer and Iles 1972). Viele Arten sind wiederum unterteilt in zahlreiche genetisch und phänotypisch unterschiedliche Populationen. Diese Studie quantifiziert morphologische Unterschiede zwischen drei Populationen der Art Tropheus moorii. Außerdem werden die Methoden der ‘‘Traditionellen Morphometrie’’ (TM) und der ‘‘Geometrischen Morphometrie’’ (GM) angewandt und hinsichtlich ihrer Möglichkeiten verglichen. Bislang beruhten Artenbeschreibungen und die Differenzierung von Populationen hauptsächlich auf traditionellen Methoden, wie standardisierten Messungen und meristischen Daten. Diese Verfahrensweise ist mit zahlreichen Mängeln behaftet und die Ergebnisse sind oft zweideutig und umstritten. Messungen beanspruchen sehr viel Zeit und können nur an toten Individuen durchgeführt werden. Diese müssen, für den Fall einer erneuten Messung, für längere Zeit aufbewahrt werden. Im Gegensatz dazu basiert die geometrische Morphometrie auf Photos oder Computer-Scans von z.B. nur betäubten Tieren. Somit ist es möglich, denselben Fisch mehrmals im Verlauf seiner Ontogenie zu analysieren. Die Geometrische Morphometrie (Rohlf and Bookstein 1990 ; Rohlf and Slice 1990; Bookstein 1991; Marcus et al. 1996) arbeitet mit homologen anatomischen Punkten (Landmarken), mit deren Hilfe die Form und Proportionen eines Objektes, in unserem Fall eines Fisches, beschrieben werden kann. Komplexe Körperkonturen können überdies mit Hilfe von ‘‘sliding Semi-Landmarks’’ in die Analyse einbezogen werden. Ergebnis der Studie ist, dass man mit beiden Methoden signifikante Unterschiede zwischen den Populationen finden kann. Aufgrund von Vorteilen in der Datenaufnahme, der vielen Möglichkeiten der Datenbeschreibung und der besseren Visualisierbarkeit der Ergebnisse ist geometrische Morphometrie in Summe die aussagekräftigere Methode, besonders deutlich unter Einbeziehung von ‘‘Semi-Landmarks’’. Für die Differenzierung von sich sehr nahe stehenden Gruppen, wie Populationen oder Schwesternarten, erscheint geometrische Morphometrie besser geeignet als traditionelle Methoden.
Introduction
The Great Lakes of eastern Africa, Lake Tanganyika, Lake Malawi and Lake Victoria are among the world's most diverse freshwater ecosystems and contain unique species flocks of cichlid fishes, each comprised of hundreds of endemic species (Fryer and Iles 1972). With an estimated age of 9–12 Myr Lake Tanganyika is the oldest of the Great Lakes (Cohen et al. 1993, 1997). Its species flock is of polyphyletic origin and can be traced back to nine evolutionary lineages that once colonized the emerging lake (Salzburger et al. 2002; Koblmüller et al. 2005). Despite Lakes Malawi and Victoria are younger, they harbour more species of cichlid fish. However, the estimated 250 cichlid species (Turner et al. 2001) in Lake Tanganyika are morphologically, ecologically and behaviourally the most diverse (Fryer and Iles 1972; Greenwood 1984; Chakrabarty 2005). Thus, Lake Tanganyika's mature species flock is an excellent subject for the study of explosive speciation and adaptive radiation. Following the spatial segregation of the shore into rock- and sand-habitats, many littoral species are subdivided into genetically and phenotypically distinct populations.
The genus Tropheus, of which six nominal species (Poll 1986; Snoeks et al. 1994) and about 120 distinctly coloured local variants are currently described (Konings 1998; Schupke 2003), represents an excellent example for this phenomenon. These morphs occupy the same ecological niche all around Lake Tanganyika, feeding on epilithic algae and keeping territories in the upper littoral zone. Also, their overall morphology (except coloration) is highly similar, and no differences in mating behaviour and breeding behaviour have been observed in different morphs or species of Tropheus (Sturmbauer and Meyer 1992; Baric et al. 2003; Schupke 2003). This study is the first to quantify those small morphological differences among three populations of T. moorii. We applied ‘traditional morphometrics’ (TM) including all standard linear measurements in combination with traditional multivariate techniques, in parallel with a ‘geometric morphometrics’ (GM) approach. Geometric morphometrics (Rohlf and Slice 1990; Bookstein 1991; Marcus et al. 1996) is a landmark-based technique currently considered to be the most rigorous morphometric technique, with more powerful statistical analyses. This method also offers the chance to observe the nature of shape differences through visualization of splines and by using sliding semi-landmarks to capture and analyse curved outlines (Green 1996; Bookstein 1997).
The specific goal of this study was to compare the efficiency of TM versus GM methods for describing differences between closely related entities, such as populations or colour morphs of T. moorii in Lake Tanganyika. We also tested if the inclusion of sliding semi-landmarks resulted in improvements in shape discrimination on the population level.
Materials and Methods
In May 2005, 211 individuals of T. moorii were caught at three locations in the southern part of Lake Tanganyika (Fig. 1a). Just after capture specimens were sent to the University of Graz, Austria alive. With about 70 individuals from each of the T. moorii-populations Katoto, Mbita and Nakaku a near-balanced number of male, female and juvenile individuals was obtained for each population.

(a) Map of Lake Tanganyika with details on sampling locations along the southern shore. (b) Representative specimens of the three researched populations
To obtain digital images from each fish a flatbed scanner was used (Herler et al. 2007). Specimens were previously anaesthetized with clove oil, placed on the scanner (HP Scanjet 4070) in a custom-made plasticine pool, which was filled with water. Digital images were taken from the left side of the specimens. The pictures shown in Fig. 1b were obtained with this method. After scanning fish were killed by overdosing clove oil and placed in a 10% formalin solution. After a few days specimens were washed and transferred to 70% ethanol, to be stored until further examination. In the present study, a subset of 120 adult individuals within a small size range was selected for morphometric analysis [Table 1; Kruskal–Wallis test (p = 0.172) and Mann–Whitney U-test (p > 0.19) for pairwise comparisons of populations revealed no significant differences in the standard length]. Details of the analysed specimens with their corresponding standard length are given in Table S1.
| Katoto (n = 38) | Mbita (n = 42) | Nakaku (n = 40) | ||||||||||
|---|---|---|---|---|---|---|---|---|---|---|---|---|
| Min | Max | Mean | SD | Min | Max | Mean | SD | Min | Max | Mean | SD | |
| Standard length (SL, mm) | 57.9 | 85.9 | 74.8 | 6.11 | 65.3 | 82.4 | 73.6 | 4.39 | 61.2 | 87.9 | 75.7 | 7.9 |
| Measurements (% SL) | ||||||||||||
| Head length | 30.56 | 34.12 | 32.29 | 0.77 | 30.50 | 34.45 | 32.57 | 0.81 | 31.68 | 34.98 | 32.87 | 0.80 |
| Head width | 16.08 | 17.46 | 16.80 | 0.36 | 16.09 | 17.71 | 16.85 | 0.38 | 16.38 | 18.57 | 17.17 | 0.44 |
| Snout length | 14.13 | 17.21 | 15.50 | 0.67 | 14.74 | 17.04 | 15.75 | 0.54 | 15.05 | 17.80 | 16.22 | 0.63 |
| Interorbital width | 11.13 | 12.40 | 11.72 | 0.32 | 10.90 | 12.48 | 11.69 | 0.37 | 10.99 | 13.29 | 12.11 | 0.46 |
| Lower jaw width | 13.56 | 15.97 | 14.70 | 0.64 | 14.16 | 16.09 | 14.94 | 0.40 | 13.86 | 16.43 | 15.11 | 0.54 |
| Lower jaw length | 7.92 | 9.59 | 8.72 | 0.40 | 8.14 | 9.62 | 8.96 | 0.38 | 8.26 | 10.08 | 8.88 | 0.36 |
| Cheek depth | 8.22 | 10.43 | 9.46 | 0.52 | 8.71 | 10.78 | 9.43 | 0.47 | 8.51 | 11.27 | 9.77 | 0.59 |
| Eye diameter | 7.66 | 9.81 | 8.52 | 0.44 | 8.02 | 9.32 | 8.55 | 0.31 | 7.65 | 9.40 | 8.45 | 0.48 |
| Dorsal fin base length | 64.06 | 67.00 | 65.44 | 0.80 | 62.18 | 67.77 | 65.22 | 1.20 | 62.69 | 67.80 | 65.61 | 0.95 |
| Anal fin base length | 23.20 | 26.76 | 24.83 | 0.88 | 23.22 | 26.43 | 25.08 | 0.77 | 22.74 | 26.27 | 24.59 | 0.75 |
| Abdominal length | 30.00 | 35.11 | 32.37 | 1.13 | 29.68 | 33.33 | 31.85 | 0.91 | 29.58 | 35.13 | 32.23 | 1.38 |
| Body depth at ventral fin | 35.48 | 39.37 | 37.58 | 0.98 | 35.84 | 39.19 | 37.73 | 0.75 | 35.81 | 39.65 | 38.04 | 0.85 |
| Body depth at anal fin | 28.34 | 33.26 | 31.17 | 0.98 | 28.82 | 32.82 | 31.32 | 0.83 | 29.05 | 33.43 | 31.50 | 0.95 |
| Body width | 13.68 | 18.21 | 16.57 | 1.10 | 15.28 | 17.88 | 16.79 | 0.64 | 14.69 | 17.73 | 16.52 | 0.73 |
| Caudal fin length 1 | 24.62 | 28.68 | 26.80 | 0.98 | 25.36 | 29.41 | 27.22 | 0.91 | 25.97 | 32.78 | 28.77 | 1.29 |
| Caudal fin length 2 | 24.15 | 28.84 | 26.37 | 1.16 | 25.40 | 28.83 | 26.86 | 0.81 | 25.53 | 30.29 | 28.03 | 1.19 |
| Caudal peduncle length | 13.66 | 15.87 | 14.79 | 0.53 | 13.92 | 16.70 | 14.76 | 0.52 | 13.52 | 16.49 | 14.95 | 0.77 |
| Caudal peduncle depth | 11.15 | 12.38 | 11.75 | 0.28 | 10.95 | 12.22 | 11.59 | 0.29 | 11.15 | 12.96 | 11.89 | 0.37 |
Traditional morphometrics
Body proportions
The following 19 characters were measured on dead, preserved specimens: standard length (SL), head length (HL), head width (HW), snout length (SNL), interorbital width (IOW), lower jaw width (LJW), lower jaw length (LJL), cheek depth (CHD), eye diameter (ED), dorsal fin base length (DFB), anal fin base length (AFB), abdominal length (VAB), body depth at ventral fin (BDV), body depth at anal fin (BDA), body width at anal fin origin (AW), caudal fin length 1 and 2 (CFL 1, CFL 2), caudal peduncle length (CPL) and caudal peduncle depth (CPD) (see Fig. 2a). Measurements are mainly based on the publications of Barel et al. (1977) and Snoeks (1994). For definitions of measurements see Table S2.
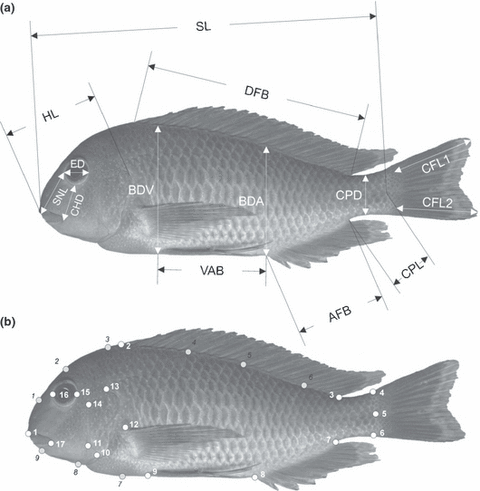
(a) Schematic representation of measurements on lateral side of the fish. (b) Positions of landmarks (white numbers) and semi-landmarks (black numbers). For definitions see Materials and Methods
Measurements were taken with a digital calliper with an accuracy of 0.01 mm directly as the distance between one reference point and the other. All measurements were taken from the left side of the specimens unless this side was damaged in which case the right side was used. There were some specimens with damaged caudal fin, for which measurement of the caudal fin length had to be omitted. Head measurements were taken under a binocular microscope. To account for effects of body size, manova, canonical variate analysis (CVA) and principal component analysis (PCA) were performed on log10-transformed measurements. Statistical analysis was carried out with the computer software past v.1.47 (PAleontological STatistics; Hammer et al. 2001).
Geometric morphometrics
The same 120 specimens of T. moorii used for TM were used in the following analysis. Seventeen landmarks and nine semi-landmarks were collected for each individual: (1) Anterior tip of the snout, (2) and (3) anterior and posterior insertion of the dorsal fin, (4) and (6) upper and lower insertion of caudal fin, (5) midpoint of the origin of the caudal fin, (7) and (8) posterior and anterior insertion of the anal fin, (9) insertion of the ventral fin, (10) most ventral point of the border between interoperculum and sub-operculum, (11) the point where praeoperculum, inter-operculum and suboperculum get in contact, (12) upper insertion of the pelvic fin, (13) dorsal origin of the operculum, (14) dorsal end of the preopercular groove, (15) and (16) lie at the extreme of the orbit along the anteroposterior body axis; capture the width of the bony orbit, (17) most posterial point of the lips. For positions of landmarks and semi-landmarks (1–9), see Fig. 2b.
For each specimen, the (X, Y) coordinates of 17 landmarks and 9 semi-landmarks were digitized using the software MakeFan (IMP programs; Sheets 2003). The landmarks and semi-landmarks were first submitted to a generalized procrustes analysis (GPA; Dryden and Mardia 1998; Rohlf 1999). This standard landmark-based morphometric method removes all non-shape variation that can be attributed to differences in the location, orientation (or rotation) and scale of the specimens. In this work, a partial procrustes superimposition, one possibility to carry out generalized procrustes analyses, was used, in which the centroid size (the square root of the summed squared distances of landmarks from the centroid) is fixed to the value 1 (Dryden and Mardia 1998; Rohlf 1999). The GPA iteratively estimates a mean form and aligns all specimens to it. Due to the inclusion of semi-landmarks we had to extend the standard procrustes superimposition procedure: in addition to translating, scaling and rotating landmarks optimally, the semi-landmarks were slid along the outline curve until they matched as well as possible the positions of corresponding points along an outline in a reference configuration (Adams et al. 2004). There are several criteria to slide points along an outline. Two of the most widely used are minimum bending energy (Bookstein 1996; Green 1996; Bookstein et al. 2002) and perpendicular projection or minimum procrustes distance (Sampson et al. 1996; Bookstein et al. 2002; Sheets et al. 2004). In our study we used both for different applications. The comparisons below were based upon 17 landmarks alone, or on landmarks plus semi-landmarks.
Canonical variate analysis
The raw coordinates were aligned using the partial procrustes superimposition (Rohlf 1999; Slice 2001) in CoordGen6f (IMP programs, Sheets 2003). Semi-landmark alignment was carried out using Semiland6 (IMP programs, Sheets 2003). This program allows semi-landmark alignment based on perpendicular projection. The components of the differences in semi-landmark positions between the reference form and the target form that are tangent to the curve were mathematically removed. This procedure resulted in an alignment of the semi-landmarks on the target form along lines perpendicular to the curve passing through corresponding semi-landmarks on the reference form (Sampson et al. 1996). As long as the contours lack abrupt changes in curvature relative to semi-landmark spacing, this criterion minimizes the distance between the semi-landmarks on the target and the reference.
To assess the variation between the three study populations, we used CVA (Mardia et al. 1979). Canonical variate analysis is a method of finding the set of axes that allows for the greatest possible ability to discriminate between two or more groups. The program CVAGen (IMP programs, Sheets 2003) computes partial warp scores to a common reference and then does a manova followed by a CVA. It determines how many distinct CVA axes there are in the data at a p-value of 0.05, and computes the canonical variates scores of all the specimens entered.
Relative warp analysis
Relative warp (RW) analysis (which is a PCA of shape variables) was also performed using the software TPSRelw (version 1.42, Rohlf 2002). This program provides sliding semi-landmarks based on minimum bending energy. The positions of the semi-landmarks were allowed to slide along the direction parallel to the contours to minimize the bending energy necessary to produce the change in the contour relative to the reference (the GPA-estimated mean form).
The RWs were computed to summarize the variation among the specimens (with respect to their partial warp scores) in as few dimensions as possible. For α = 0 this is a PCA of the covariance matrix of the partial warp scores. There is also a visualize-window that shows the deformation in shape from the reference that corresponds to selected positions in the ordination.
In addition to CVA and RW analyses, Goodall's F-tests were carried out in TwoGroup6 (IMP programs, Sheets 2003). To test for shape differences that might be attributed to allometry, Pearson's correlations between standard length and the first two CVA and RW axes were calculated. Statistical analysis was carried out with past v.1.47.
Results
Traditional morphometrics
Canonical variate analysis of body measurements plotting CV 2 against CV 1 could not clearly separate the three T. moorii populations (Fig. 3a). Although population-specific groupings are obvious, there were large overlaps between all three groups. The scatter-plot of CV 3 against CV 2 did not separate the groups at all. Likewise, separation among the three populations was not clearly evident in the PCA plot of the third against the second PC axes (Fig. 3b). In the PCA, all character loadings onto PC 1 were positively correlated and most had similar values. PC 1 explained 87.95% of total variation but was not considered because of its strong correlation with size (R2 = 0.997). Top loading characters on PC 2 were lower jaw length, eye diameter, abdominal length and caudal peduncle length (Fig. 3c). Characters loading most heavily onto PC 3 included lower jaw length, anal fin base length, body width at anal fin origin, caudal fin length 1 and 2. Table 1 lists details on traditional measurements. Results from manova showed significant differences (Table 2a).
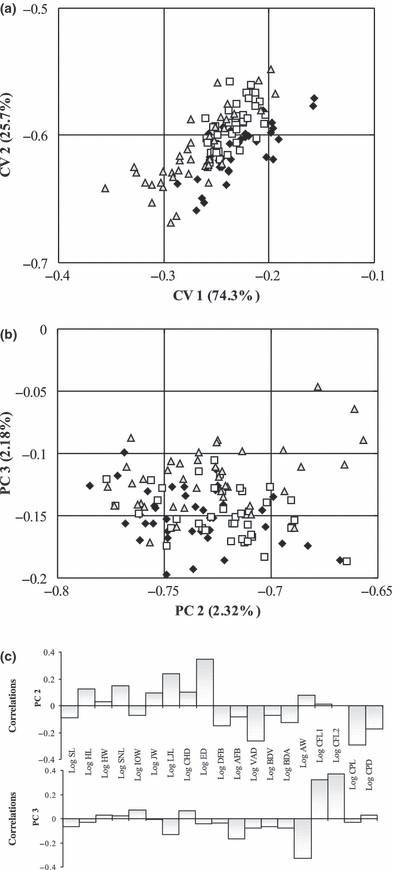
Statistical analyses of body proportions (traditional morphometrics) of three populations of Tropheus moorii (Nakaku =, Katoto =, Mbita =□) from southern Lake Tanganyika. (a) Canonical variate analysis. (b) Principal component analysis. (c) Loadings of characters on PC 2 and 3
| Katoto–Mbita | Mbita–Nakaku | Katoto–Nakaku | |
|---|---|---|---|
| (a) | |||
| Wilk's Lambda | 0.5478 | 0.4205 | 0.3577 |
| F-score | 2.6 | 4.5 | 5.5 |
| p* | 7.5 × 10⁻³ | 1.02 × 10⁻⁵ | 1.47 × 10⁻⁶ |
| (b) | |||
| 17 landmarks | |||
| F-score | 3.3 | 16.1 | 17 |
| p* | 1.2 × 10⁻³ | 0 | 0 |
| 17 + 9 landmarks | |||
| F-score | 2.7 | 18.8 | 20.1 |
| p* | 7.98 × 10⁻⁹ | 0 | 0 |
- *Bonferroni adjusted p-value.
Geometric morphometrics
A Goodall's F-test was computed to test for overall shape differences between groups. We used the Bonferroni method to adjust for the lack of independence in the comparisons between populations. Results from Goodall's F-test for 17 landmarks and 17 landmarks plus 9 semi-landmarks are shown in Table 2b. Based on shape variables the three populations Katoto, Mbita and Nakaku differed highly significantly in their average body shape.
Canonical variate analyses
Canonical variate analyses scatter-plot based upon 17 landmarks showed three groups (Fig. 4). Only a few specimens overlapped, with the strongest overlap between Katoto and Mbita. Fig. 4 displays deformation grids (scaling factor = 0.06) correlated with CV 1 and 2. Both deformation grids demonstrated shape changes mainly in the head region. CVA scatter-plot based on 17 landmarks and 9 semi-landmarks revealed stronger separation (Fig. 5), in that the Nakaku group was fully separated from the other two groups. Deformation grids including semi-landmarks also indicated changes in the head region.
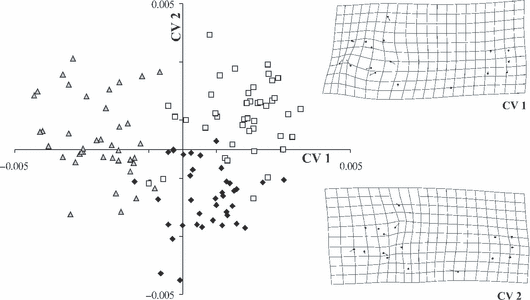
Canonical variate analysis on shape variables of 120 specimens of three populations of Tropheus moorii (Nakaku =, Katoto =, Mbita =□) from southern Lake Tanganyika based on 17 landmarks and changes in shape that are correlated with CV 1 and 2
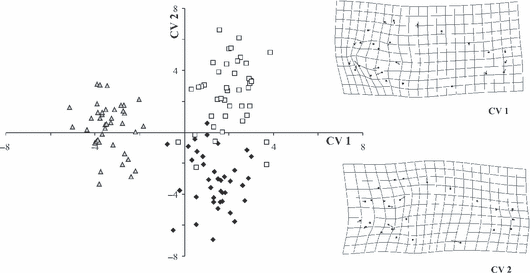
Canonical variate analysis on shape variables of 120 specimens of three populations of Tropheus moorii (Nakaku =, Katoto =, Mbita =□) from southern Lake Tanganyika based on 17 landmarks and 9 semi-landmarks and changes in shape that are correlated with CVA axis 1 and 2 are shown
Assignment test in CVAgen revealed slightly more correct group assignments for data including sliding semi-landmarks (for 17 landmarks: 111 of 120, for 17 landmarks + 9 semi-landmarks: 114 of 120 correct assignments). However, those differences were not significant (χ2 = 0.64; p = 0.42).
Additional CVA was carried out considering different sexes. This CVA scatter-plot based on 17 landmarks (Fig. 6a) and 17 landmarks and 9 semi-landmarks (Fig. 6b) showed that there are morphological differences between males and females, particularly between Nakaku males and females.
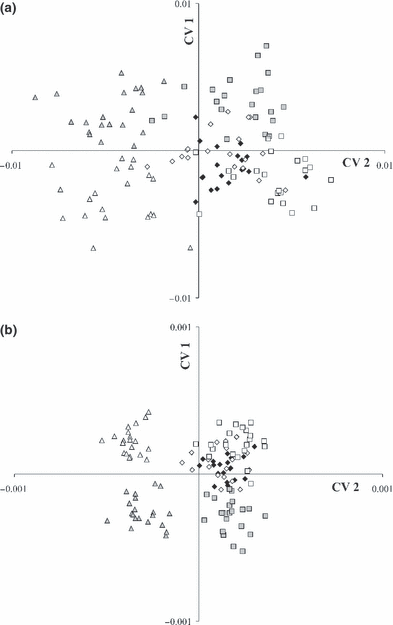
Canonical variate analysis on shape variables of 120 specimens of three populations of Tropheus moorii (Nakaku males =, Nakaku females = Katoto males =, Katoto females = Mbita males =□, Mbita females =□) from southern Lake Tanganyika based on (a) 17 landmarks and (b) 17 landmarks and 9 semi-landmarks, divided into populations and sexes
The CVA including semi-landmarks displayed solid male and female groupings in the Nakaku and Mbita population, while within Katoto population sexual dimorphism was not indicated. It showed that sexual dimorphism was mainly caused by morphological differences in head shape. When only males or only females of the three populations were compared based upon the 17 landmark system, the clearest non-overlapping separation was found (see Fig. S1a,b).
Relative warp analyses
The RW analysis on 120 male and female specimens, based on 17 landmarks (see Fig. S2a) separated most individuals of the Nakaku group from the two other populations. Most Nakaku specimens were located on the negative axis of RW 1. The first two RWs explained 29% and 10% of the total variation among the three populations. Mbita and Katoto could not be distinguished at all. As shown by the deformation grid for negative RW 1 (Fig. 7a), Nakaku specimens have a steeper dorsal head profile and the orientation of the mouth was not the same as in specimens from Katoto and Mbita. Mouth orientation of Nakaku appeared to be more in level. Also, placement towards the negative RW 1 and RW 2 reflected slightly slimmer body form.
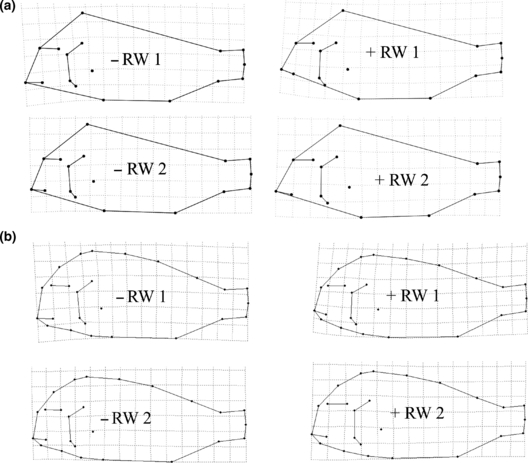
Relative warp analysis was also carried out for the 17 landmarks and 9 semi-landmarks system. Results did not differ much from results of analyses based upon the 17 landmarks only (see Fig. S2b). The same general shape variation was observed, but by including semi-landmarks the steeper dorsal head profile and the different mouth orientation of the Nakaku population was clearer (Fig. 7b). Relative warp analysis for males and females did not increase population discrimination in either sex. None of the shape differences were attributable to allometry based on Pearson's correlations calculated between standard length and the first two CVA and RW axes.
Quality and interpretation of results
Both approaches showed that the three T. moorii populations Katoto, Mbita and Nakaku varied in terms of morphology. Statistical tests of both data sets determined that populations significantly differed from each other. A closer similarity of Katoto to Mbita rather than to Nakaku was indicated (Table 2). The CVA and PCA on TM data did not provide any useful results for separating the populations. A slight segregation of the Nakaku population along the third PC axis could be associated with caudal fin length and body width at anal fin origin, as suggested by characters loadings (Fig. 3c). However, the third component only accounted for 2.18% of total variance and not even the Nakaku specimens were clearly separated. Clear-cut conclusions about differences in length of caudal fin or body width between Nakaku and the other two groups could not be drawn by PCA on TM data.
A general problem of TM data sets is that information about shape can only be derived from ratios among particular measurements. Consequently, more complex aspects of shape differences are not addressable. In contrast, GM methods are highly effective in capturing information about shape, as geometry of the whole organism is captured by the landmarks, and even more directly by sliding semi-landmarks. Canonical variate analyses of landmark-based data confirmed a closer position of Katoto specimens to Mbita rather than to Nakaku, as indicated by Goodall's F-test. CVA on data set including semi-landmarks fortified these findings as Nakaku specimens were totally separated from the other two groups in scatter-plot. Sturmbauer et al. (2005) and Sefc et al. (2006) recently showed that the Katoto population goes back to natural hybrids between the population at Nakaku (it belongs to the Chaitika Mountain range colour morph) and Mbita (Mpulungu morph). It is thus an interesting finding that Katoto individuals are morphologically more similar to the Mbita population than to that at Nakaku. The potential to visualize shape changes implied by CVA provided the opportunity to localize differences between populations. Deformation grids showed that most morphological variation occurred in the head region. Compared to overall body shape, Fryer and Iles (1972) observed that the head region, particularly the mouth, is the most diverse in cichlid fishes. Cichlid fishes diversified by trophic specialization, so that structures of the trophic apparatus differ most among species. Indeed, this is also the case in the analysed Tropheus populations, albeit differences are small and fish occupy exactly the same trophic niche.
To check for sexual dimorphism an additional CVA was carried out for males and females separately. This demonstrated morphological differences between males and females, particularly visible in scatter-plot based on landmarks and semi-landmarks. By adding semi-landmarks to our landmark system we were able to detect shape variation in curved body parts, such as the forehead. The differences between males and females (see deformation grid in Fig. 7) occurred in the head region, especially in the forehead. Other studies, on more comprehensive samples, are intended to definitely quantify morphological differences between males and females. Another interesting observation from the CVA scatter-plot shown in Fig. 7 is the fact that Katoto males and females are positioned between Mbita males and Mbita females. Mbita females are morphologically more similar to Katoto males than to their own males. This unexpected result needs to be addressed in further studies concerning the Katoto hybrid status.
Concerning potential influences of allometric changes during growth, we selected adult individuals of the same size range of all three populations. To test whether it is better to pool the sexes or to differentiate between males and females for discrimination of populations, a separate CVA for males and females (17 landmarks were analysed) was carried out. These sex-specific scatter-plots separated the populations much clearer, in that specimen clusters did not overlap between populations. Also, it is not so easy to sex life juvenile Tropheus, so that only mature individuals can be analysed by sex without killing the fish.
In addition to CVA we carried out an RW analysis. Again, scatter-plots showed a closer position of Katoto specimens to Mbita than to Nakaku. Deformation grids indicated that mouth orientation of Nakaku specimens is more in level than that of Katoto and Mbita individuals. The individuals of the Nakaku population had a steeper dorsal head profile. Interestingly, the sex-specific RW analysis did not result in clearer separation of the populations as opposed to the sex-specific CVA.
To conclude, both TM and GM methods are able to discriminate populations in the genus Tropheus. However, the differences can much better be visualized and quantified by coordinate-based methods, which should be especially preferred for differentiation of closely related entities. The inclusion of sliding semi-landmarks led to a clearer – albeit not significantly better – discrimination of the three study populations. However, it was possible to address more complex aspects of body shape such as the dorsal head profile that might be of great relevance for the assessment of sexual dimorphism.
Discussion
A large body of literature on comparative morphological traits and their variation in shape exists for cichlid fishes (e.g. Liem 1973, 1980; Barel 1983; Yamaoka 1983, 1997; Smits et al. 1996; Stiassny 1997; De Visser and Barel 1998; Bouton et al. 2002; Chakrabarty 2005). These works demonstrated that structures of the oral jaw apparatus (OJA) are most significant in cichlid diversification. However, it was also argued that the enormous eco-morphological diversity of cichlid fish was achieved mainly by allometric changes of the same bony structures and very rarely by de-novo evolution of characters (Stiassny 1991). Recent studies have located regions in the cichlid genome responsible for allometric shape differences in the OJA that could be linked to particular trophic specializations (Albertson and Kocher 2001; Albertson et al. 2003a,b). Many meristic counts and measurements are often plastic and overlap between species. As a consequence, comparative morphology based on those standard measurements, here called traditional morphometrics, often is at its limit when closely related entities are analysed. This study compared TM and GM techniques with respect to their potential to discriminate three closely related populations of T. moorii. About 120 distinct populations are known, some of which live in sympatry. This makes the genus to an ideal model to study allopatric divergence and speciation. Populations can be subdivided into nine major mtDNA lineages of about the same age as the entire Lake Malawi cichlid flock (Sturmbauer and Meyer 1992; Sturmbauer et al. 2005). Given the long time of separate evolution of many populations and the great degree of overall morphological similarity except for coloration, it was suggested that their morphology is constrained by stabilizing selection, but no systematic survey was attempted to date.
Concerning data acquisition, one can state that the necessary measurements for traditional comparative morphology, such as measuring body proportions and counting scales, are time consuming. Nineteen standardized measurements were carried out in this study and it was impossible to do such extensive measuring on life fish, because anaesthetization time could not be extended long enough to carry out all 19 measurements in sufficient precision. Thus, the necessity of killing specimens is the first major drawback of traditional methods. Measurements had to be done on formalin-fixed and subsequently ethanol-preserved specimens. In contrast, GM methods can be based on photographs and computer scans of anaesthetized fish, so that killing and preserving of specimens is unnecessary, unless voucher specimens are needed. Moreover, the same individual can be repeatedly analysed during its ontogeny, even in the field. Geometric morphometrics imply the availability of more technical resources, such as computer, camera or scanner during data acquisition, which might be problematic in the field. For type specimens from museum collections, GM methods can be easily carried out, if there are photos or scans available, so that fragile type specimens are not touched. However, it is useless to compare data of fresh and preserved specimens, as preservation affects shape (Maderbacher and Herler, personal observations), so that each set of comparisons needs to be carried out either on fresh or preserved specimens.
Traditional morphometric data are measurements of lengths, depths and widths. Such a data set contains relatively little information about shape because many of the measurements overlap or run in similar directions. Several of the measurements originate from a single point, so some values cannot be considered as completely independent (Zelditch et al., 2004). In this study such a point was the anterior tip of the snout. Standard length, head length, snout length and lower jaw length had their origin at that position. It was recently upheld that correlation of measurements complicates the problem of describing shape differences of particular body parts (Zelditch et al. 2004).
An advantage of TM is the fact that measurements can be done in three dimensions, while scans are two-dimensional reductions of shape. Since our study object T. moorii is quite deep-bodied, most informative structures and points could be captured on the lateral view. Of course, additional scans viewing the dorsal and/or ventral side are possible. An alternative method for capturing three-dimensional images would be the application of computer tomographic techniques or three-dimensional scans.
Acknowledgements
We would like to thank P. Ngalande, H. Phiri and D. Sinyinza, Department of Fisheries, Ministry of Agriculture and Cooperatives, Republic of Zambia, for their support during field work. This study was financed by the Austrian Science fund project number P17680-B06.


