Effects of elevated CO2 concentration and water deficit on fructan metabolism in Viguiera discolor Baker
Editor: R. Leegood
Abstract
Elevated [CO2] is suggested to mitigate the negative effects of water stress in plants; however responses vary among species. Fructans are recognised as protective compounds against drought and other stresses, as well as having a role as reserve carbohydrates. We analysed the combined effects of elevated [CO2] and water deficit on fructan metabolism in the Cerrado species Viguiera discolor Baker. Plants were cultivated for 18 days in open-top chambers (OTC) under ambient (∼380 ppm), and high (∼760 ppm) [CO2]. In each OTC, plants were submitted to three treatments: (i) daily watering (control), (ii) withholding water (WS) for 18 days and (iii) re-watering (RW) on day 11. Analyses were performed at time 0 and days 5, 8, 11, 15 and 18. High [CO2] increased photosynthesis in control plants and increased water use efficiency in WS plants. The decline in soil water content was more distinct in WS 760 (WS under 760 ppm), although the leaf and tuberous root water status was similar to WS 380 plants (WS under 380 ppm). Regarding fructan active enzymes, 1-SST activity decreased in WS plants in both CO2 concentrations, a result consistent with the decline in photosynthesis and, consequently, in substrate availability. Under WS and both [CO2] treatments, 1-FFT and 1-FEH seemed to act in combination to generate osmotically active compounds and thus overcome water deficit. The proportion of hexoses to sucrose, 1-kestose and nystose (SKN) was higher in WS plants. In WS 760, this increase was higher than in WS 380, and was not accompanied by decreases in SKN at the beginning of the treatment, as observed in WS 380 plants. These results suggest that the higher [CO2] in the atmosphere contributed to maintain, for a longer period, the pool of hexoses and of low DP fructans, favouring the maintenance of the water status and plant survival under drought.
Introduction
Atmospheric carbon dioxide concentrations ([CO2]) has been increasing since the Industrial Revolution, and reached an average of 391.8 mmol·mol−1 in Mauna Loa, Hawaii (USA), at the end of 2011 (ESRL, 2011). It has been predicted that increasing atmospheric [CO2] may cause global warming, as well change precipitation patterns (Kimball et al. 2001). Moreover, drought episodes will become more frequent, intense and erratic and might affect regions not currently subject to drought (Allen 1994; Centritto et al. 1999). Climate models suggest that in South America there will be an increase in precipitation; however, this phenomenon is likely to be limited to a few months of the year, hence leaving long periods of drought in this region (IPCC 2007). In Brazil, for example, it is predicted that there will be a replacement of part of the Amazon Forest by Cerrado vegetation (IPCC 2007), a biome characterised by two distinct seasons – rainy summer and dry winter (Coutinho 1990). The vegetation of this biome presents seasonal growth and a series of adaptive strategies to overcome fire, seasonal drought and nutritional stress, which are common features in the Cerrado. The vegetation of the Cerrado is adapted to withstand these adverse conditions, having large, thickened underground organs in herbaceous plants that accumulate photoassimilates during their developmental cycle (Mantovani & Martins 1988). For example, in a restricted Cerrado area of the Reserva Biológica e Estação Experimental de Moji Guaçú, São Paulo, Brazil, there are many Asteraceae species that accumulate fructans as reserve compounds in their underground organs (Carvalho et al. 2007).
Fructans are polyfructose molecules formed from sucrose that act as storage carbohydrates in 15% of higher plants (Hendry & Wallace 1993). Different classes of fructans are known based on the glycosidic linkage between the fructose units. Inulin-type fructans occur in many dicotyledons, mainly in Asteraceae, as linear β 2,1-linked fructofuranosyl units. In inulin-producing plants, fructan synthesis involves two enzymes: sucrose: sucrose 1-fructosyltransferase (1-SST, EC 2.4.1.99), which produces 1-kestose by transfer of a fructosyl unit from a sucrose donor to a sucrose acceptor, and fructan: fructan 1-fructosyltransferase (1-FFT, EC 2.4.1.100), which is responsible for the transfer of fructosyl units between fructan molecules. Inulin breakdown is accomplished by a fructan 1-exohydrolase (1-FEH, EC 3.2.1.153), which catalyses release of the fructose moiety to water (Edelman & Jefford 1968; Van den Ende et al. 2002). There is growing interest in the use of inulin as a health food ingredient, as a low-calorie sweetener, source of dietary fibre and as a fat substitute (Ritsema & Smeekens 2003). It is suggested that daily intake of low amounts of inulin or its derivatives has bifidogenic and anti-tumour effects (Roberfroid 2005). However, despite these important features, Chicorium intybus (chicory) is currently the only crop used as a commercial fructan source (Van den Ende et al. 2002).
Fructan metabolism in plants has been associated with cold and drought tolerance (e.g.Pontis 1989; Tognetti et al. 1990; De Roover et al. 2000; Garcia et al. 2011). Accumulation of fructan or sucrose with a low degree of polymerisation (DP), either through synthesis or breakdown of higher DP molecules, is common under such stresses. Since mild cold and drought limit growth more than photosynthesis, accumulation of sucrose occurs, which favours the activation of fructosyltransferases (Hare et al. 1998; De Roover et al. 2000). On the other hand, 1-FEH activity is increased by cold and drought, leading to accumulation of low DP fructans and sucrose (Portes et al. 2008; Asega et al. 2011; Garcia et al. 2011).
The wide occurrence of Cerrado species with a high fructan content in underground reserve organs reinforces the role of fructans in drought stress tolerance, as these plants undergo periods of water deficit throughout their phenological cycle (Carvalho et al. 2007 and references therein). Studies with Vernonia herbacea, one such species, showed that over long periods with low water availability, the rhizophores have high water retention, possibly related to fructan osmoregulation ability, since water retention was accompanied by changes in fructan composition (Dias-Tagliacozzo et al. 2004), including increases in the ratio fructo-oligosaccharides to fructo-polysaccharides and changes in fructan active enzymes (Garcia et al. 2011).
Experiments conducted with fructan accumulating species of the Cerrado have shown their potential in studies of the effects of environmental factors (low temperature, drought, high CO2) on growth, biomass allocation, fructan production and fructan metabolism. One such species is Viguiera discolor Baker, which has a seasonal growth pattern (Isejima & Figueiredo-Ribeiro 1991) and contains high levels of fructans of the inulin type in both adventitious and tuberous roots (ca. 80% DM). An interesting feature of V. discolor is the presence of unusually long fructan chains reaching a DP of 170 (Isejima and Figueiredo-Ribeiro 1991). Hence, the 1-FFT cDNA of this species was cloned and expressed in Picchia pastoris, confirming that it synthesises long-chain fructans, being one of the few 1-FFTs that have this important feature in Asteraceae (Van den Ende et al. 2005).
Few studies have examined the interaction between rising atmospheric [CO2] and water stress on plant growth and production (Luo & Mooney 1999). It is well known that the increase in biomass (Rogers et al. 1994; Curtis & Wang 1998) and changes in photosynthesis and water relations (Gunderson & Wullschleger 1994; Saxe et al. 1998) caused by elevated [CO2] are dependent on the availability of other potential limiting resources (Long 1991; Chaves & Pereira 1992; Field et al. 1992; Stitt & Krapp 1999). However, most of these studies were performed with crop plants, which grow rapidly and have a short life cycle (Samarakoon & Gifford 1996a,b), while studies with native plants are scarce. Lee & Jarvis (1995) noted that native plants will differ from crop plants in their response to high [CO2]atm and drought because of differences in lifespan, growth rate and pattern, and allocation and partitioning of carbon and nitrogen.
Considering the widespread occurrence of fructans in Cerrado species and the predicted climate changes, this study aimed to evaluate the interaction between elevated [CO2] and water deficit on fructan metabolism in the herb Viguiera discolor.
Material and Methods
Plant material and growth conditions
Plants of Viguiera discolor Baker were grown from seeds collected in a preserved Cerrado area in Mogi Guaçu, SP, Brazil, (22°18′ S, 47°11′ W). After 2 years they were transferred to pots containing forest soil (two plants per 2-l pot) and cultivated in one of two open-top chambers, being 27 pots per OTC, (OTCs; 1.53 m3 each) inside a glasshouse (Oliveira et al. 2010). Half of the plants received ambient CO2 (380 ± 20 ppm) and half received elevated CO2 (760 ± 50 ppm) provided from a cylinder containing 99.8% CO2. During 21 days of acclimation, plants received 100 ml Vernonia nutrient solution per week (Cuzzuol et al. 2005) and were further irrigated with water to keep soil moist. Then, in each OTC, plants were separated into three groups and treated as follows: (i) daily watering (control), (ii) withholding water (WS) for 18 days or (iii) re-watering (RW) on day 11. Plants and soils were sampled on day 0, 5, 8, 11, 15 and 18, to assess soil moisture (Ψw soil), leaf (Ψw leaf) and tuberous root (Ψw root) water potential, leaf gas exchange and fresh and dry mass of shoots and tuberous roots. Tuberous root samples were weighed and frozen in liquid nitrogen for later enzyme and carbohydrate analyses. The experiment was conducted from August to October 2009, under a natural photoperiod (11.0–12.5 h) at temperatures from 12.2 to 30.2 °C (average 18 °C) and relative humidity from 42 to 97%. The experiment had a completely randomised design and all measurements and extractions were done in triplicate, each corresponding to three plants.
Soil moisture and soil water potential
Soil moisture was measured gravimetrically (Blake 1965) and soil water potential (Ψw soil) was measured using a dew point psychrometer (Model WP4; Decagon, Pullmann, WA, USA).
Dry mass, water content, leaf and tuberous root water potential
Water content (WC; %) of aerial organs and tuberous roots was determined using the equation WC = (FM−DM)/FM × 100, where FM is fresh mass and DM is dry mass. DM of aerial organs and tuberous roots was obtained after drying tissues at 60 °C until constant weight. Leaf water potential (Ψw leaf) was measured between 05:00 and 06:00 h using a Scholander type pressure bomb. Tuberous root osmolarity was determined in expressed cell sap with a vapour pressure osmometer (Model VAPRO 5520; Wescor, Logan, Utah, USA). Osmolarity measured in mmol kg−1 was transformed into MPa (Yw root) using the Van’t Hoff equation, where MPa = mmol kg−1 × 2.58 × 10−3 (Santa-Cruz et al. 2002).
Leaf gas exchange
Instantaneous net leaf CO2 assimilation rate (A), stomatal conductance (gs) and transpiration (E) were measured on the youngest fully-expanded leaf, from 09:00 to 11:00 h with a portable photosynthesis system (LI-6400; Li-Cor, Lincoln, NE, USA) in a chamber equipped with a red-blue LED light source (LI-6400-02B, Li-Cor) with a photosynthetic photon flux density (PPDF) of 720 μmol photons m−2·s−1, and [CO2] of 380 and 760 ppm for measurements of ambient and elevated CO2 treatments, respectively. Instantaneous water use efficiency (WUE) is defined as the ratio of assimilation/transpiration (A/E). The light saturation of photosynthesis was measured in similar leaves as A to PPFD curves.
Enzyme extraction and assays
Frozen root samples were ground in liquid nitrogen and homogenised in 0.05 m McIlvaine buffer (pH 5.5; 1:1, w/v) containing 2 mol·m−3 EDTA, 2 mol·m−3β-mercaptoethanol, 5 mol·m−3 ascorbic acid and 10% PVPP (w/w), as described in Asega & Carvalho (2004). Proteins precipitated with (NH4)2SO4 to a final saturation of 80% were re-suspended at a ratio of ca. 10 g FM equivalent cm−3 in extraction buffer.
Enzymes were assayed by incubation of the protein extract with different substrates mixed to 1:1 (v/v). All substrates were prepared in 0.05 m McIlvaine buffer (pH 4.5). The extracts were incubated at 30 °C at a final concentration of 0.2 m sucrose (Sigma-Aldrich, St. Louis, MO, USA) for 1-SST activity, 0.2 m 1-kestose for 1-FFT activity and 5% inulin from Helianthus tuberosus for 1-FEH activity. Incubation time was 6 h for 1-SST and 1-FFT and 1 h for 1-FEH. The reactions were stopped by heating the mixture for 5 min at 100 °C. Extraction and assay conditions were optimised to assure reliable activity measurements. For determination of 1-SST and 1-FFT activities, samples of the reaction mixtures were diluted 10-fold and analysed using HPAEC/PAD with a 2 × 250 mm CarboPac PA-1 column on a Dionex system (model ICS 3000; Dionex, Sunnyvale, CA, USA). The gradient was established by mixing eluant A (150 mm NaOH) with eluant B (500 mm sodium acetate in 150 mm NaOH) as follows: 0–2 min, 15 mm; 2.1–17.0 min, 185 mm; 17.1–21.0 min, 500 mm; 21.1–30.0 min, 15 mm. For 1-FEH activity, the incubation mixture was diluted five-fold and analysed with HPAEC/PAD using the same system and eluants described above with the following gradient: 0–2 min, 25 mm; 2.1–8.0 min, 50 mm; 8.1–8.5 min, 75 mm; 8.6–10.0 min, 100 mm; 10.1–28.0 min, 450 mm; 28.1–30.0 min, 500 mm; 30.1–40.0 min, 25 mm. The applied PAD potentials for E1 (0–0.4 s), E2 (0.41–0.42 s), E3 (0.43 s) and E4 (0.44–1.00 s) were 0.1, −2.0, 0.6 and −0.1, respectively, and the flow rate through the column was 0.25 ml·min−1. The activities of 1-FEH, 1-SST and 1-FFT were calculated by directed measurement of fructose, 1-kestose and nystose, respectively, using the external standard method.
Soluble carbohydrate analyses
Carbohydrates were extracted from freeze-dried samples of tuberous roots (Portes & Carvalho 2006). The crude extract was submitted to ethanol precipitation and fructo-oligosaccharide (hexoses, sucrose and fructans with DP 3–27) and fructo-polysaccharide (mainly fructans with DP 10–60) fractions were separated by centrifugation. Free and combined fructose were measured in the crude extracts and in the separated fractions using a ketose-specific modification of the anthrone reaction, with fructose (Sigma-Aldrich) as standard (Jermym 1956), and the ratio fructo-oligo:fructo-polysaccharide calculated. Soluble carbohydrates in the oligosaccharide fraction were de-ionised through ion exchange columns, according to Carvalho & Dietrich (1993), and analysed using HPAEC/PAD with the same conditions as described above for 1-FEH analysis.
Statistical analyses
The correlation coefficients between Ψw soil, WC soil, Ψw leaf, Ψw root, A, WUE and the physiological and biochemical parameters were calculated using Pearson’s correlation. Statistical significance of results was tested using independent Student’s t-tests. In addition, means were compared using standard errors (SE; n = 3).
Results
The water withholding (WS) treatment led to a decrease in Ψw soil (Fig. 1A and B) and soil moisture (Fig. 1C and D) under both [CO2], and more markedly in soils at 760 ppm CO2. In the WS 380 treatment, the lowest Ψw soil was −12 MPa and soil moisture was 5.7%, while in the WS 760 the lowest Ψw soil was −16 MPa and soil moisture was 4.6% on day 18 of the experiment. Under both [CO2], RW on day 11 led to recovery of Ψw soil and soil moisture to levels close to control plants, which had constant Ψw soil and soil moisture throughout the experiment.

Soil water potential (Ψw soil A, B) and soil moisture (% C, D) in pots of Viguiera discolor submitted to daily watering (⋄), water suppression (■) and re-watering (▲), under ∼ 380 ppm (A, C) and ∼ 760 ppm (B, D) of CO2. Values are means ± SE (n = 3).
The water deficit imposed by WS was sufficient to cause a decrease in Ψw leaf (Fig. 2A and B) and tuberous root Ψw root (Fig. 2 C and D) in both [CO2]. At 380 ppm, the lowest Ψw leaf (−3.8 MPa) was reached on day 8 and was lower than that under 760 ppm (−3.0 MPa). Eleven days after WS, senescence of aerial organs occurred in both CO2 conditions, preventing measurement of Ψw leaf. The decrease in Ψw root in WS 380 occurred earlier, on day 5, and was more marked (−5.7 MPa) than in WS 760 treatment, where Ψw root was −3.6 MPa on day 11. Similar to Ψw soil and soil moisture, RW allowed recovery of Ψw leaf and Ψw root towards the end of the experimental period to values similar to control plants: −1MPa throughout most of the experimental period.
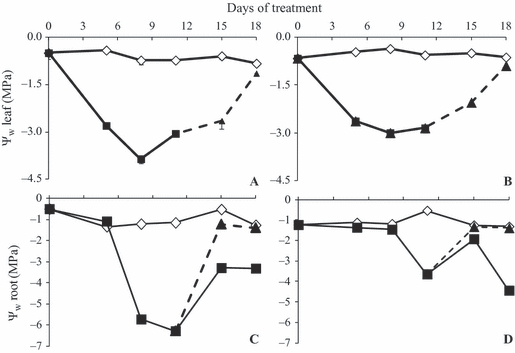
Leaf (Ψw leaf A, B) and tuberous root (Ψw root C, D) water potential of Viguiera discolor submitted to daily watering (⋄), water suppression (■) and re-watering (▲), under ∼ 380 ppm (A, C) and ∼ 760 ppm (B, D) of CO2. Values are means ± SE (n = 3).
Since plants remained under the two [CO2] for 21 days before WS treatment, values for gas exchange parameters (A, E and gs) were higher in plants under elevated CO2 at time 0 (Fig. 3). In general, A (Fig. 3A and B), E (Fig. 3C and D) and gs (Fig. 3E and F) decreased in plants under WS in both [CO2] after day 5, and remained similar throughout the experimental period. On day 11, although all plants under WS had started to senesce, plants under high [CO2] still had positive values of A. WUE increased in WS 760 plants until day 5 and decreased thereafter, similar to WS 380 plants (Fig. 3G and H). Under both [CO2], RW on day 11 led to the recovery of all parameters, especially WUE, which was higher than in control plants.
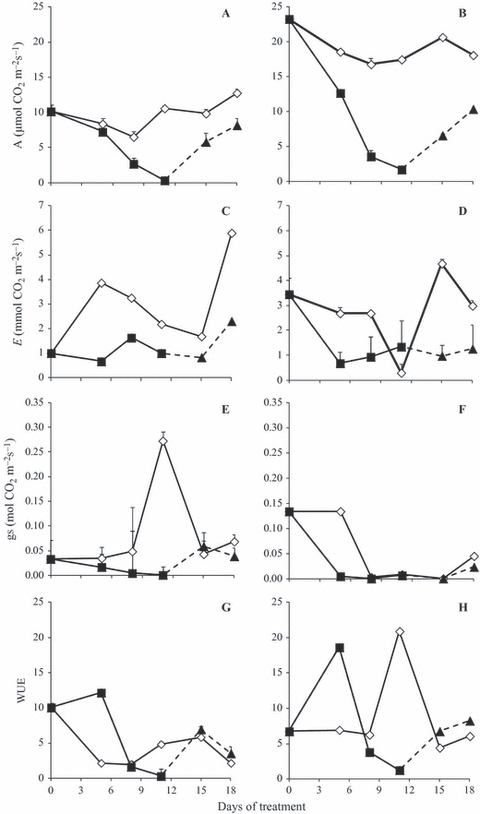
Net assimilation (A, B), transpiration (C, D), stomatal conductance (E, F) and water use efficiency (G, H) of plants of Viguiera discolor submitted to daily watering (⋄), water suppression (■) and re-watering (▲), under ∼ 380 ppm (A, C, E, G) and ∼ 760 ppm (B, D, F, H) of CO2. Values are means ± SE (n = 3).
Dry mass of aerial organs was higher in control than in WS plants in both [CO2] (Fig. 4A and B). Control plants maintained a constant water content in aerial organs throughout the experimental period (70% at 380 ppm and 80% at 760 ppm; Fig. 4C and D). Immediately after WS treatment, there was a decrease in water content of aerial organs in both [CO2]. The lowest water content in plants under WS was 20% on day 18. After RW, in both [CO2], water content partially recovered.
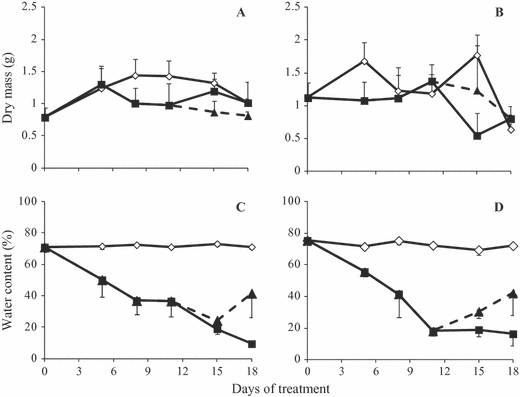
Dry biomass (A, B) and water content (C, D) of aerial organs of Viguiera discolor submitted to daily watering (⋄), water suppression (■) and re-watering (▲), under ∼ 380 ppm (A, C) and ∼ 760 ppm (B, D) of CO2. Values are means ± SE (n = 3).
In both [CO2], dry mass of tuberous roots was higher in control plants, although plants under 760 ppm had higher values than plants under 380 ppm, especially after day 11 (Fig. 5A and B). There were no changes in water content of tuberous roots in control plants in either [CO2], and values remained at ca. 80% throughout the experimental period (Fig. 5C and D). WS led to a decrease in water content of tuberous roots in both [CO2], however, under 760 ppm this reduction occurred before day 5, while under 380 ppm it occurred after day 5. At the end of the experimental period, WS 760 had a lower water content (40%) than WS 380 (50%). Under both [CO2], RW led to recovery of water content of tuberous roots to levels close to control plants.
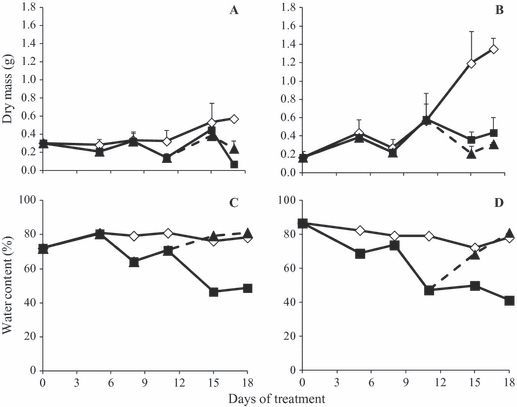
Dry biomass (A, B) and water content (C, D) of tuberous roots of Viguiera discolor submitted to daily watering (⋄), water suppression (■) and re-watering (▲), under ∼ 380 ppm (A, C) and ∼ 760 ppm (B, D) of CO2. Values are means ± SE (n = 3).
After day 8 the 1-SST activity decreased in both WS 380 and WS 760 treatments (Fig. 6A and B). RW of 380 ppm plants allowed maintenance of 1-SST activity close to that of control plants, while in 760 ppm plants there was an increase in activity under all water conditions after RW on day 15. In general, 1-FFT activity was higher in control plants (Fig. 6C and D); however in WS 380 plants there was an increase in activity up to day 8 and a decline after day 11, while in WS 760 plants, activity remained constant until day 8, declined until day 11 and then increased until the end of the experimental period. Activity of 1-FEH increased gradually in WS 380 plants throughout the experiment (Fig. 6E); however in WS 760 plants 1-FEH was higher than controls and almost constant during the whole period (Fig. 6F). In both [CO2], RW caused a decline in 1-FEH activity.
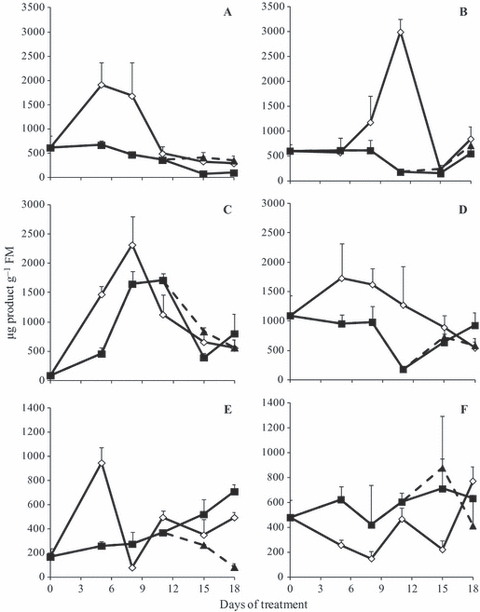
1-SST (A, B), 1-FFT (C, D) and 1-FEH (E, F) activities in tuberous roots of Viguiera discolor submitted to daily watering (⋄), water suppression (■) and re-watering (▲), under ∼ 380 ppm (A, C, E) and ∼ 760 ppm (B, D, F) of CO2. Values are means ± SE (n = 3).
Fructo-polysaccharides increased gradually up to day 15 in all water treatments under 380 ppm, followed by a decrease (Fig. 7A). Under 760 ppm, fructo-polysaccharides increased slightly, with a peak on day 15 (Fig. 7B). Fructo-oligosaccharide content was similar in all water and CO2 treatments; however under 380 ppm, there was a more marked increase on day 15 in RW and in WS plants when compared to control plants (Fig. 7C), and under 760 ppm this increase was more pronounced in RW plants than in control and WS plants (Fig. 7D). The ratio of fructo-oligo:fructo-polysaccharides was generally higher in WS 380 than in control plants and peaked on day 5 (Fig. 7E). RW promoted a more pronounced increase in this ratio on day 15. Under 760 ppm CO2, the ratio was similar in all treatments, except for an increase in control plants on day 8 (Fig. 7F).
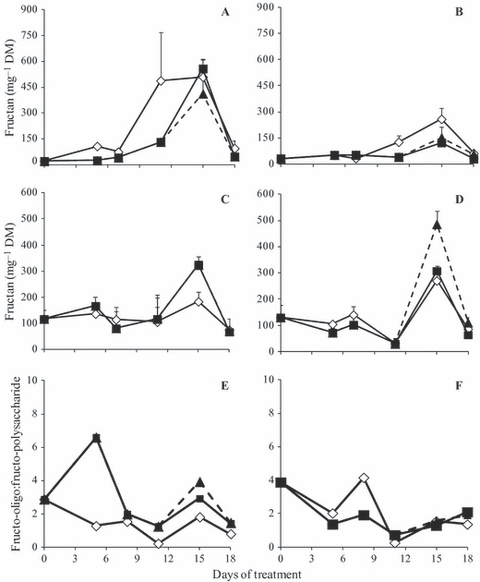
Fructo-polysaccharide (A, B) -oligosaccharide (C, D) and oligo:polysaccharide ratio (E, F) in tuberous roots of Viguiera discolor submitted to daily watering (⋄), water suppression (■) and re-watering (▲), under ∼ 380 ppm (A, C, E, G) and ∼ 760 ppm (B, D, F, H) of CO2. Values are means ± SE (n = 3).
The HPAEC/PAD profiles of fructo-oligosaccharides in control plants in both [CO2] showed a high proportion of glucose and fructose to sucrose, 1-kestose, nystose and the oligosaccharides of >4 DP and no relevant changes throughout the analysed period (8, 9). However, glucose and fructose proportions in relation to sucrose, DP3 and DP4 increased more markedly in WS 380 plants from day 5, while a similar change in WS 760 plants was observed only on day 15 (data not shown) and was maintained until day 18. In plants under 760 ppm CO2, the increase in glucose and fructose peaks occurred until day 11 and was not accompanied by decreases in sucrose, 1-kestose or nystose, as observed in WS 380. Generally, the increase in hexoses detected in WS plants was reversed after RW in both [CO2].
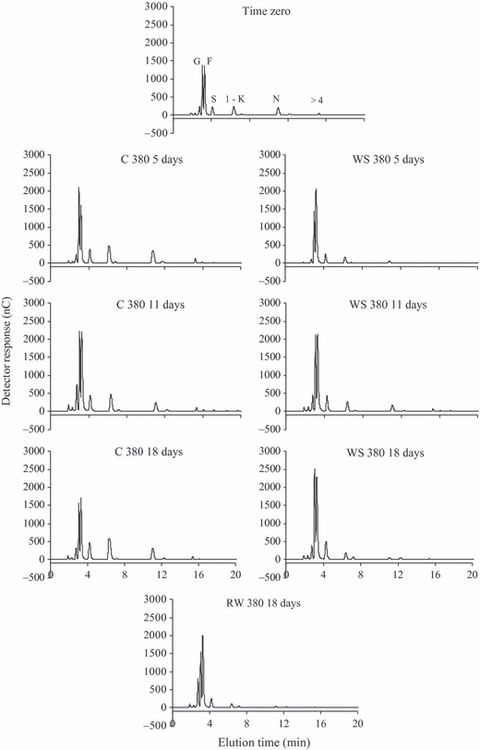
HPAEC/PAD of fructo-oligossacharides in tuberous roots of Viguiera discolor submitted to daily watering (C), water suppression (WS) and re-watering (RW), under ∼380 ppm of CO2. G = glucose, F = fructose, S = sucrose, 1-K = 1-kestose, N = nystose, >4 = fructans with DP higher than 4.
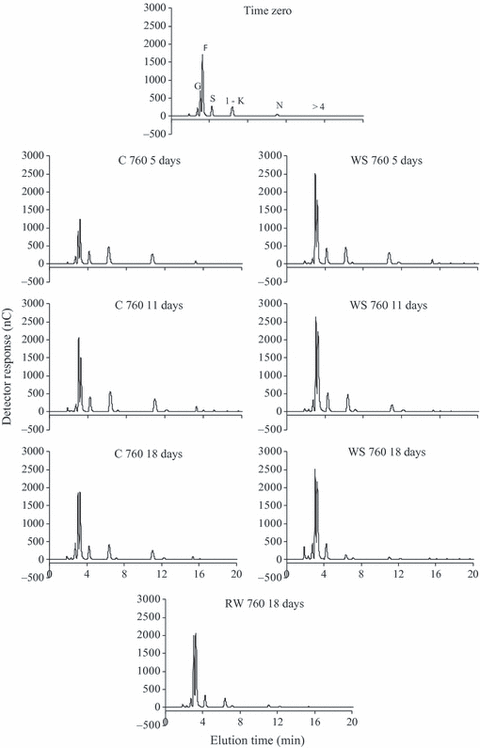
HPAEC/PAD of fructo-oligossacharides in tuberous roots of Viguiera discolor submitted to daily watering (C), water suppression (WS) and re-watering (RW), under ∼760 ppm of CO2. G = glucose, F = fructose, S = sucrose, 1-K = 1-kestose, N = nystose, >4 = fructans with DP >4.
Correlation analyses showed a clear dependence of the evaluated parameters with water availability. In WS plants, there was a significant correlation among water parameters (Ψw soil, WCsoil, Ψw leaf and Ψw root) and biochemical and physiological parameters, both under 380 ppm CO2 (Ψw soil × WCaerial = 0.977, P = 0.0007; Ψw soil × FEH = −0.85, P = 0.03; Ψw soil × A = 0.96, P = 0.002) and under 760 ppm CO2 (Ψw soil × WCaerial = 0.96, P = 0.001; Ψw soil × A = 0.97, P = 0.0009). Re-irrigation caused rapid responses in some physiological parameters evaluated and in both [CO2]. Correlations were also found in both RW and WS plants, although the significant correlations present in WS plants for Ψw soil x E (r = 0.8, P = 0.05) were not detected in RW plants.
Discussion
The water deficit imposed by withholding water was sufficient to generate changes in water content and water free energy in both soil and plants, which affected physiological and biochemical processes, such as photosynthesis and fructan metabolism in Viguiera discolor. Samarakoon & Gifford (1995) reported that under high [CO2], soil water content can increase, decrease or remain unchanged, depending on stomatal regulation. Under high [CO2], plants generally become more tolerant to water stress because they decrease stomatal conductance (Robredo et al. 2007), thus reducing transpiration and maintaining water potential (Rozema 1993). However, V. discolor responded differently to elevated [CO2] and drought than most previous reports, since WS 760 plants had higher stomatal conductance and transpiration rates than WS 380 plants (Fig. 3C–F). Nevertheless, these parameters were significantly correlated to the decrease in Ψw soil (r = 0.90, P = 0.01 and r = 0.80, P = 0.05, respectively) throughout the experimental period.
The elevated CO2 treatment enhanced rates of photosynthesis in control plants throughout the experiment, but in WS plants only for the first 5 days. Photosynthesis showed a marked dependence on soil water availability, with significant correlations with soil moisture and water potential in WS 380 plants (0.83, P = 0.04 and 0.96, P = 0.002, respectively) and in WS 760 plants (0.92, P = 0.01 and 0.97, P = 0.0009, respectively). Under well-watered conditions A in V. discolor was, on average, 112% higher in 760 ppm than in 380 ppm plants (Fig. 3A and B), as also reported for Vernonia herbacea, another fructan accumulating species of the Cerrado (Oliveira et al. 2010). In WS plants, the rapid decrease in gs in response to soil drying could explain the decline in A independently of CO2 treatment. These results suggest that soil water availability, more than the high [CO2], determines gas exchange in V. discolor.
Although a marked decrease in soil moisture and water potential occurred in WS 760 treatment, the plants had a leaf water status similar to WS 380 plants. However, the water potential of tuberous roots in WS 380 was lower than in WS 760 plants at the same water content (Fig. 2). As fructans are the main reserve carbohydrate in roots of V. discolor (Isejima & Figueiredo-Ribeiro 1991), and these compounds can be promptly mobilised to the low DP molecules sucrose and hexoses, they contribute to osmotic adjustment and plant survival under drought stress (Garcia et al. 2011). Hence, fructans and their derivatives, at least in part, probably maintain the water status in WS plants. In the present work, plants under WS had increases in the proportion of hexoses in relation to sucrose, DP3 and DP4 compounds; particularly in WS 760 plants this increase was higher than in WS 380, as shown by the increase in glucose and fructose peak areas (8, 9), suggesting that invertase, as well as 1-FFT and 1-FEH, might contribute to generating the hexose pool, especially in 760 ppm plants. In WS 760 plants, the increase was not accompanied by decreases in sucrose, 1-kestose and nystose, as was the case in WS 380 plants, suggesting that the high carbon intake contributed to maintain the pool of these sugars at levels close to that of control plants. Interestingly, total fructan content in tuberous roots did not differ significantly among water and CO2 treatments (Fig. 7), confirming the relevance of changes in the proportions of hexoses and low DP fructans (shown in the HPAEC/PAD profiles) and in the fructo-oligo:fructo-polysaccharide ratio for maintenance of the plant water status, and thus the role of fructans in drought tolerance.
The role of the above compounds in drought tolerance is well established (e.g.Pilon-Smits et al. 1995, 1999). It was confirmed by introducing a gene for fructan synthesis into tobacco and sugar beet plants and obtaining plants with enhanced drought tolerance in comparison to wild-type plants (Knipp & Honermeier 2006). Moreover, increases in low DP sugars have been detected in Festuca (Spollen & Nelson 1994; Clark et al. 2004), wheat (Virgona & Barlow 1991; Wardlaw & Willenbrink 2000; Yang et al. 2004) and chicory (Van den Ende et al. 1998) when exposed to water stress. The increase in low DP fructans under stress conditions may occur either through synthesis or partial depolymerisation of pre-existing higher DP molecules (Valluru & Van den Ende 2008).
The gradual increase in 1-FEH activity in WS 380 plants is in accordance with increased demand for osmotically active compounds, which can be expected in plants under water restriction as much as the decline after RW is be expected when the stress factor is withdrawn (Fig. 6). Conversely, under 760 ppm CO2 and withholding water, 1-FEH activity was constant, as opposed to the overall decline seen in control plants. This suggests that the increase in A under high [CO2] could have caused an increase in sucrose availability, partially inhibiting fructan mobilisation, whereas in WS plants, the increased carbon influx at the beginning of the WS period was sufficient to generate the necessary amount of osmotically active compounds to maintain water status of the cells.
In WS 380 plants, the increase in 1-FFT activity was accompanied by a higher fructo-oligo:fructo-polysaccharide ratio and a decline in Ψw root (r = −0.93, P = 0.005) during the first 11 days of water stress (Figs 1,6 and 7). In contrast, in WS 760 plants, the ratio fructo-oligo:fructo-polysaccharides did not differ from that of control plants; however, the increase in 1-FFT activity, after day 11, was accompanied by a decrease in 1-kestose and nystose peaks. These results in both [CO2] support the hypothesis that this enzyme, in combination with 1-FEH, contributes to partial fructan degradation to generate osmotically active compounds – low DP fructans – that can be used to overcome water deficit or re-establish aerial organs (Degasperi et al. 2003). At time 0, when plants had remained under elevated [CO2] for 21 days, the combined action of 1-FFT, in this case lowering fructan chain length, and 1-FEH was necessary to produce free fructose (Fig. 9) as substrate for metabolic activity in roots. According to the literature, the increase in supply of carbohydrates to roots through increased carbon fixation when plants are exposed to elevated [CO2] may lead to higher respiration (Janssens et al. 1998). Although no measurements were done in the present work, respiration rates could have increased due to increases in metabolic activity. This high metabolic activity is also reflected in increases of 1-SST activity and dry biomass of tuberous roots (Fig. 5) in control plants under 760 ppm after day 11, while there were no changes in control plants under 380 ppm.
The decline in photosynthesis after day 5 in WS plants was followed by a decrease in 1-SST activity after day 8 in both [CO2], and is associated with a decrease in substrate for this enzyme (3, 6). In the present study, 1-SST activity was significantly correlated with photosynthesis, both in WS 380 (r = 0.86, P = 0.02) and in WS 760 (r = 0.56, P = 0.24) plants. The close association of decreases in 1-SST activity and translocation of photoassimilates to sink organs caused by little or no assimilation was found in other fructan accumulating species, e.g. Cichorium intybus (De Roover et al. 1999) and V. herbacea (Asega & Carvalho 2004; Portes & Carvalho 2006), and is consistent with the fact that sucrose is the main carbohydrate translocated in plants and that a high concentration of sucrose in the vacuole is required for continuous fructan biosynthesis (Kusch et al. 2008).
The results presented shows that high [CO2] favoured the maintenance of tissue turgor, contributing to the maintenance of high CO2 assimilation rates in control and water stressed plants, and suggest a delay of fructan mobilisation. These physiological responses, together with maintenance of the fructan reserve for longer than expected in plants under water deficit, strongly suggests that high atmospheric [CO2] mitigates the negative effects of drought and favours plant long-term survival under predicted climate change scenarios. Moreover, considering the wide occurrence of fructan-accumulating plants in the Cerrado and the limited knowledge of the combined effects of drought and high atmospheric [CO2] on native species, this study presents relevant data for understanding the impact of the climate changes on species of the Brazilian Cerrado, one of the world’s richest biomes.
Acknowledgements
This work was supported by FAPESP (05/04139–7). VF Oliveira thanks FAPESP for a doctoral fellowship (07/59782–7). LBP Zaidan and MAM Carvalho are CNPq research fellows. The authors thank Dr Norio Shiomi (Rakuno Gakuen University, Japan) for kindly providing pure samples of nystose and 1-kestose.


