Dynamic behavior of clathrin in Arabidopsis thaliana unveiled by live imaging
Summary
Clathrin-coated vesicles (CCV) are necessary for selective transport events, including receptor-mediated endocytosis on the plasma membrane and cargo molecule sorting in the trans-Golgi network (TGN). Components involved in CCV formation include clathrin heavy and light chains and several adaptor proteins that are conserved among plants. Clathrin-dependent endocytosis has been shown to play an integral part in plant endocytosis. However, little information is known about clathrin dynamics in living plant cells. In this study, we have visualized clathrin in Arabidopsis thaliana by tagging clathrin light chain with green fluorescent protein (CLC–GFP). Quantitative evaluations of colocalization demonstrate that the majority of CLC–GFP is localized to the TGN, and a minor population is associated with multivesicular endosomes and the Golgi trans-cisternae. Live imaging further demonstrated the presence of highly dynamic clathrin-positive tubules and vesicles, which appeared to mediate interactions between the TGNs. CLC–GFP is also targeted to cell plates and the plasma membrane. Although CLC–GFP colocalizes with a dynamin isoform at the plasma membrane, these proteins exhibit distinct distributions at newly forming cell plates. This finding indicates independent functions of CLC (clathrin light chains) and dynamin during the formation of cell plates. We have also found that brefeldin A and wortmannin treatment causes distinctly different alterations in the dynamics and distribution of clathrin-coated domains at the plasma membrane. This could account for the different effects of these drugs on plant endocytosis.
Introduction
Membrane-bounded vesicles play an important role in eukaryotic cells by enabling the exchange of proteins and lipids between organelles. Transport vesicles are formed at the donor membrane by the action of coat protein complexes. The assembly of coat proteins with a conserved structure at the surface of donor organelles results in deformation of the membrane into a spherical shape (Gürkan et al., 2006; Traub, 2009). Coat proteins and accessory proteins are also responsible for sorting and packaging cargo molecules into the appropriate transport vesicles. The clathrin-coated vesicle (CCV) was first identified by electron microscopy (Roth and Porter, 1964). It is now widely accepted that CCVs are involved in multiple post-Golgi trafficking pathways, including receptor-mediated endocytosis and transport from the trans-Golgi network (TGN) to the plasma membrane, endosomes, and lysosomes (Brodsky et al., 2001).
The presence of CCVs was reported in plants soon after the characterization of CCVs in animals (Newcomb, 1980). Pulse-chase experiments with non-specific endocytic markers, like cationized ferritin and lectin-colloidal gold conjugates, demonstrated that plant CCVs were involved in endocytosis (Joachim and Robinson, 1984; Tanchak et al., 1984; Hillmer et al., 1986). Clathrin-dependent transport is now recognized as a major trafficking system in plant cells; a number of cell surface membrane proteins have been suggested to be sequestered into plant cells via clathrin-mediated endocytosis (Dhonukshe et al., 2007; Robatzek et al., 2006). Clathrin-mediated membrane trafficking has also been shown to play a role in cell plate formation during cytokinesis (Bouttéet al., 2010; Collings et al., 2008; Fujimoto et al., 2008; Otegui et al., 2001; Seguí-Simarro et al., 2004; Tahara et al., 2007; Van Damme et al., 2011). However, the precise function of clathrin in cytokinesis is not fully understood.
The clathrin coat is a polyhedral lattice with hexagonal and pentagonal faces (Fotin et al., 2004). The clathrin lattice is composed of triskelia. A triskelion is a three-legged, pinwheel-like molecule composed of three clathrin heavy chains (CHCs) and three clathrin light chains (CLCs) (Brodsky et al., 2001; Fotin et al., 2004). The cargo molecules to be sequestered are recognized by several adaptor proteins, including heterotetrameric adaptor proteins (APs) and monomeric, Golgi-localized, γ-ear-containing, ADP-ribosylation factor (ARF)-binding proteins (GGAs). These proteins recognize specific sorting motifs within the cytosolic portion of the cargo molecule (Brodsky et al., 2001). APs and GGAs also possess clathrin interaction domains that bind to clathrin to form a bridge between the cargo proteins and the clathrin lattice. The ARF GTPases are also involved in forming clathrin-coated vesicles (CCVs). The yeast ARF1 interacts with AP1 and phosphatidylinositol 4-phosphate (PI4P); PI4P is enriched in TGN membranes; thus, the ARF1-PI4P interaction recruits AP1 to the TGN (Wang et al., 2003). Other regulatory proteins involved in CCV formation possess lipid interaction domains; this situation suggests that the lipid composition of the membrane could be a spatiotemporal cue for assembly of the clathrin coat (Di Paolo and De Camilli, 2006). When CCVs are ready to be released from the donor membrane, the actin cytoskeleton and the large GTPase, dynamin, act together to pinch off the CCVs. The actin cytoskeleton is thought to provide the pushing force for clathrin-coated areas to project a bud out from the donor membrane (Kaksonen et al., 2006). Dynamin molecules, in turn, form an oligomeric complex that twists around the neck of a clathrin-coated bud, tubulates the membrane, and pinches it off upon GTP hydrolysis (Danino and Hinshaw, 2001).
Many of the components involved in CCV formation are conserved in plants (Barth and Holstein, 2004; Holstein, 2002; Holstein and Oliviusson, 2005; Hong et al., 2003; Scheele and Holstein, 2002; Vernoud et al., 2003). In Arabi-dopsis thaliana, CHCs and CLCs are encoded by two and three genes, respectively (Scheele and Holstein, 2002). These components are thought to have similar functions in plants and animals. This notion has been supported by the fact that overexpressing the CHC hub region causes similar inhibitory effects in plant and animal cells (Dhonukshe et al., 2007; Kitakura et al., 2011; Liu et al., 1995; Robert et al., 2010). Plant ARF GTPases also appear to be involved in clathrin-dependent endocytosis; the uptake of FM4-64 dye and the auxin transporter, PIN, is inhibited by mutations in GNOM, a guanine nucleotide exchange factor (GEF), and mutations in VAN3, a GTPase activating protein (GAP) for ARF GTPase, respectively (Naramoto et al., 2010). The plant dynamin-related protein 1A (DRP1A) is also required for endocytosis of FM4-64 dye (Collings et al., 2008). These lines of evidence suggest that the regulatory machinery for CCV formation is conserved among eukaryotes, including plants. On the other hand, the triskelion structure of plant clathrin exhibits several features that are distinct from animal clathrin. Electron microscopic analysis of clathrin purified from carrot protoplasts has shown that plant clathrin assembles into a typical triskelion structure (Coleman et al., 1987); however, plant triskelia have higher molecular mass and longer arms than mammalian triskelia (Coleman et al., 1987; Depta and Robinson, 1986; Depta et al., 1987; Mersey et al., 1985). Thus, plant evolution has added some unique properties to the clathrin system.
It has been also reported that the post-Golgi trafficking pathways have been diversified in a unique way in plant cells (Ebine and Ueda, 2009). The fission mechanism at the plasma membrane of plant cells also exhibit notable uniqueness. For example, DRP1, a subgroup of the plant dynamin-related proteins, harbors structural features that are distinct from conventional dynamins. DRP1 members lack the pleckstrin homology domain and proline rich domain that are required for animal dynamin membrane binding (Hong et al., 2003). Nevertheless, DRP1A is able to form a heterodimer with a conventional type of dynamin, DRP2B, in clathrin-coated pits on the plasma membrane (Fujimoto et al., 2010; Konopka et al., 2008). The interplay of two distinct dynamin members in CCV formation has not been reported for animal and yeast systems; this strongly suggests that plants have modified the mechanism of CCV formation during evolution.
In accordance with the functions of clathrin in multiple trafficking pathways, clathrin molecules have been localized to multiple organelles, including the plasma membrane, TGN, endosomes, and lysosomes in both animal and yeast cells (Brodsky et al., 2001). Furthermore, bilayered clathrin coats without APs have been observed on multivesicular endosomes (MVEs; Sachse et al., 2002). In root cells of A. thaliana, immunoelectron microscopy and immuno-fluorescence microscopy detected clathrin localized to budding profiles on the plasma membrane (Dhonukshe et al., 2007; Kitakura et al., 2011). The dynamics of CCV formation at the plasma membrane has been analyzed by variable incidence angle fluorescent microscopy (VIAFM)/variable angle epifluorescence microscopy (VAEM), a technique related to total internal reflection fluorescence microscopy (Fujimoto et al., 2010; Konopka et al., 2008). However, reports have been equivocal regarding cytoplasmic localization of clathrin. Several studies reported that the TGN comprised a complex of clathrin-coated tubular structures (Staehelin and Moore, 1995). Immunoelectron microscopy showed that the TGN was decorated with clathrin-coated buds (Kang et al., 2011; Stierhof and El Kasmi, 2010). On the other hand, another report showed that the clathrin signal overlapped more closely with a trans-Golgi cisternae marker (ST-mRFP) than with the TGN marker (VHAa1-mRFP; Dhonukshe et al., 2007). Nearly complete colocalization was also reported for ST-mRFP and clathrin in another cell type (Konopka et al., 2008). These inconsistent reports indicate that a detailed, quantitative analysis is required for adequate understanding of clathrin subcellular localization and dynamics in plant cells.
In this study, we have reinvestigated the subcellular localization and dynamic behavior of CLC in A. thaliana plants by quantitatively evaluating its localization compared to that of several established organelle markers, tracking their movements, and examining the effects of inhibitors of plant membrane trafficking, brefeldin A (BFA) and wortmannin.
Results
Subcellular localization of GFP-tagged clathrin light chain
To visualize clathrin in living cells, we created transgenic plants that expressed green fluorescent protein (GFP) fused to the CLC encoded by the Arabidopsis Genome Initiative locus identifier, At2g40060. This CLC was shown to interact with the hub domain of mammalian CHC (Scheele and Holstein, 2002), and CLC–GFP chimeric proteins have been shown to colocalize with immunodetectable endogenous CHC (Robert et al., 2010). Furthermore, At2g40060 expression is under the control of regulatory elements located in the 5′-flanking, 3′-flanking, and intron sequences of the CLC gene (Figure 1a). Thus, it is likely that the localization of GFP-tagged CLC reflects the localization of endogenous clathrin in structures like clathrin-coated pits and CCVs. The CLC–GFP fusion protein was localized to the plasma membrane, intracellular structures, and the cytosol, consistent with previous observations (Figure 1b; Fujimoto et al., 2010; Konopka et al., 2008; Van Damme et al., 2011). To identify the location of cytoplasmic CLC–GFP-positive points, we stained plant cells with an endocytosis tracer, FM4-64, which indicated that these compartments were endosomal in nature (Figure 1b). The CLC signal on the plasma membrane was detected at cell plates, which were also stained with FM4-64, as reported previously (arrowhead in Figure 1b; Konopka et al., 2008; Van Damme et al., 2011).
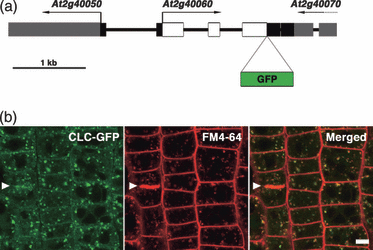
Subcellular localization of clathrin light chain fused to green fluorescent protein (CLC–GFP) in root epidermal cells in the meristematic zone. (a) Schematic representation of the GFP sequence inserted into a genomic fragment of A. thaliana that encodes At2g40060 (CLC2) to create the CLC–GFP fusion sequence. (b) Confocal images of root cells that expressed CLC–GFP (left), then stained with the endocytosis tracer, FM4-64 (center). The right panel shows the merged image. Arrowhead indicates a cell plate. Scale bar = 5 μm.
Distinct distribution of dynamin and clathrin during cell plate formation
At the beginning of cell plate formation, Golgi-derived vesicles are shown to accumulate at the cell division plane, form tubules, and fuse into tubular networks, which gradually grow into fenestrated sheets (Jürgens, 2005). Electron microscopy and tomographic analyses have shown that many clathrin-coated buds appear on the cell plates as they form (Otegui et al., 2001; Samuels et al., 1995; Seguí-Simarro et al., 2004). Dynamin-like rings have also been observed at constricted tubular regions of hourglass-shaped vesicles and on the fenestrated sheets (Otegui et al., 2001; Seguí-Simarro et al., 2004). Consistent with those observations, the dynamin-related proteins of A. thaliana, DRP1A and DRP2B, accumulate at newly synthesized parts of cell plates as they form in BY-2 cells (Fujimoto et al., 2008). However, to date, a direct comparison of the spatiotemporal localization of clathrin and dynamin has not been made to determine whether clathrin and dynamin act in the same trafficking events. To obtain a further insight into the distribution and dynamics of these proteins during cell plate formation, we examined dividing cells in transgenic plants that expressed both DRP1A–GFP and CLC fused to monomeric Kusabira-Orange (CLC-mKO; Karasawa et al., 2004). We found that DRP1A–GFP accumulated uniformly at the division plane during the early stage of cell plate formation, as reported previously (Fujimoto et al., 2008; Figure 2a,m). On the other hand, CLC-mKO did not localize to the cell plate at this stage (Figure 2e,m). This finding indicates that dynamin acts independently of clathrin during early cell plate development. Subsequently, DRP1A–GFP disappeared from the central part of expanding cell plates and accumulated at the newly synthesized regions, near the edges of cell plates as they formed (Figure 2b,c,n,o). At this stage, CLC-mKO seemed to be excluded from the edges of cell plates, but was predominantly localized in the central region (Figure 2j,n, arrowheads). At the final stage of cytokinesis, both CLC-mKO and DRP1A–GFP signals diminished in intensity in the central region (Figure 2g,o, arrows), but increased in intensity at the edges of the cell plates (Figure 2o, blue arrowheads). Thus, dynamin and CLC partially overlapped throughout cell plate formation. This suggests that dynamin plays a role in cell plate formation that is additional to its interaction with CLC in the formation of CCVs (Otegui et al., 2001; Seguí-Simarro et al., 2004).
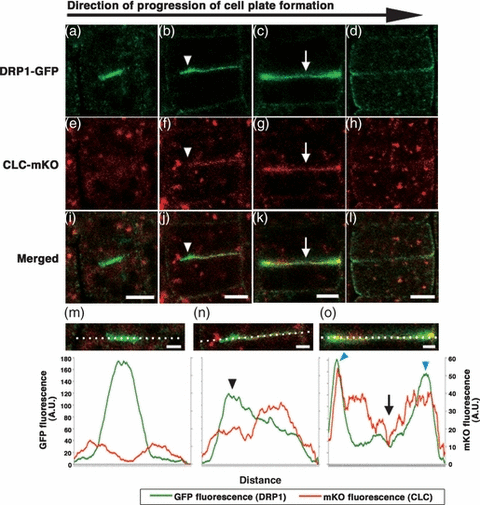
Recruitment of clathrin light chain fused to monomeric Kusabira-Orange (CLC-mKO) and dynamin-related protein fused to green fluorescent protein (DRP1A–GFP) to developing cell plates. (a–d) Localization of DRP1A–GFP and (e–h) localization of CLC-mKO during cell plate formation. (i–l) Merged images of DRP1A–GFP and CLC-mKO. Scale bars = 5 μm. (m–o) Magnified images of the cell plates shown in (i), (j), and (k), respectively. The lower graphs represent the fluorescence intensities of GFP (green lines) and mKO (red lines) along the white dotted lines shown in the corresponding images.
A major proportion of clathrin localizes on the trans-Golgi network (TGN)
To determine the precise subcellular localization of CLC–GFP, we compared its localization with several known organelle markers. Because CLC–GFP-positive organelles were shown endosomal in nature (Figure 1b), we established transgenic plants that co-expressed CLC–GFP and a marker for the TGN or the MVE, which are involved in the endocytic trafficking pathway (Dettmer et al., 2006; Ebine et al., 2011; Uemura et al., 2004). These included an mRFP-tagged syntaxin of plants 43 (mRFP-SYP43), which is a marker for the TGN (Ebine et al., 2011; Uemura et al., 2004); the Venus-RHA1, a marker for a subpopulation of MVEs (Anuntalabhochai et al., 1991; Haas et al., 2007); and ARA6-mRFP, a marker for another subpopulation of MVEs (Ebine et al., 2011; Haas et al., 2007). We also generated transgenic plants that co-expressed CLC–GFP and ST-mRFP, a marker for the Golgi trans-cisternae (Boevink et al., 1998). As shown in Figure 3, a major proportion of the CLC–GFP signal overlapped with mRFP-SYP43 (Figure 3c). We also frequently observed that some CLC-positive domains had partially merged or were associated with other organelle markers (Figure 3a,b,d).
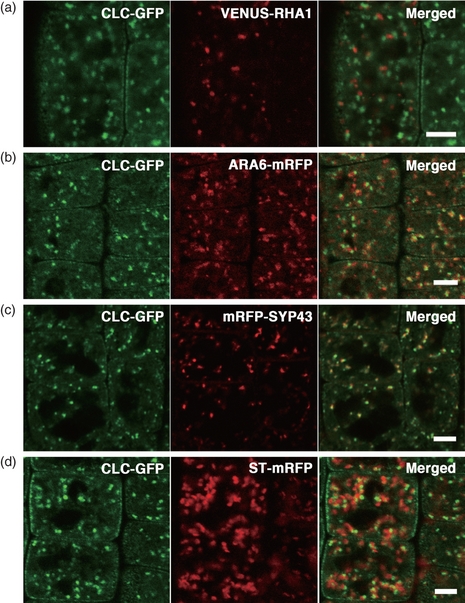
Subcellular localization of clathrin light chain fused to green fluorescent protein (CLC–GFP) and organelle markers in root epidermal cells near meristematic regions. (a–d, left) Subcellular localizations of CLC–GFP molecules were compared to those of (a–d, center) organelle markers; (a, center) Venus-RHA1, a marker for a subpopulation of multivesicular endosomes (MVE); (b, center) ARA6-mRFP, a marker for another subpopulation of MVE; (c, center) mRFP-tagged syntaxin of plants 43 (mRFP-SYP43), a marker for the trans-Golgi network; and (d, center) ST-mRFP, a marker for the Golgi trans-cisternae. The right panels show the merged images. Scale bars = 5 μm.
For a more quantitative comparison of the subcellular localization of CLC and other organelle markers, we constructed a macro in Metamorph software, which semi-automatically measures the distance from the center of each GFP signal to the center of the nearest RFP or Venus signal in acquired images (Bouttéet al., 2006). We classified the resulting distances into three categories: (i) colocalized: a distance between two centers that was below the resolution limit of the objective lens (0.24 μm in this study); (ii) associated: a distance less than the sum of the radii of two punctate signals (<1 μm in this study); and (iii) independent: a distance larger than the sum of the radii of two punctate signals (>1 μm) (Figure 4a). In the positive control (ARA6–GFP and ARA6-mRFP in Figure 4b), about 70% of the GFP signal was classified as colocalized, and 20% was classified as associated. Among the organelle markers examined, CLC colocalized most closely with SYP43; furthermore, over 50% of the CLC-positive points were classified as colocalized (Figure 4b). This result indicates that CLC predominantly localized at the SYP43-positive TGN; however, a substantial fraction of CLC was also localized in close proximity to RHA1- or ARA6-positive MVEs and the ST-positive trans-Golgi cisternae (Figure 4b).
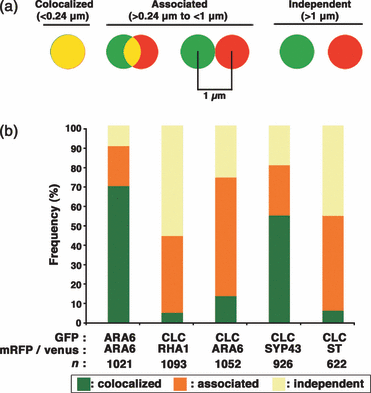
Quantitative analysis of the co-localization between cytoplasmic clathrin light chain fused to green fluorescent protein (CLC–GFP) and organelle markers. (a) Schematic representation of the criteria for classifying the relationships between CLC–GFP and a marker for a subcellular organelle. (b) Stacked bar graphs represent the localization relationships between CLC and various organelle markers. The marker pairs are indicated below the bars according to the fluorescent label used (GFP, Venus, or mRFP). The organelle markers included ARA6, a marker for a subpopulation of multivesicular endosomes (MVE); RHA1, a marker for a different subpopulation of MVEs; syntaxin of plants 43 (SYP43), a marker for the trans-Golgi network; and ST, a marker for the Golgi trans-cisternae. The control, ARA6 fused to two different fluorescent molecules, shows that the fluorescent labels may have contributed to a small part of the localization. n = the total number of fluorescent points analyzed.
Dynamic behavior of CLC–GFP in root epidermal cells
We then analyzed the dynamics of clathrin and the organelle markers in root epidermal cells. These cells possess a relatively thin cytoplasmic layer surrounding the vacuole. Most of the CLC–GFP points moved in concert with mRFP-SYP43 points (arrowheads in Figure 5a; Movie S1). We also occasionally observed CLC-positive, SYP43-negative tubules that protruded from the TGN, and vesicles that pinched off from these tubules (arrow in Figure 5a). We also observed that two or more mRFP-SYP43 points were transiently bridged by CLC-positive tubules (blue arrowheads in Figure 5b). These observations suggest that clathrin-positive vesicular and/or tubular carriers mediate traffic between the TGNs, or between the TGNS and other organelles. In addition, we noticed that there were smaller CLC–GFP points that frequently overlapped with the subdomains of ARA6 points (Movie S2); these points moved together in the cytosol (white arrowheads in Figure 6), which suggests a stable association between ARA6-endosomes and a subpopulation of CLC–GFP. Finally, we observed faint ARA6-mRFP signals on larger CLC points (white arrows in Figure 6).
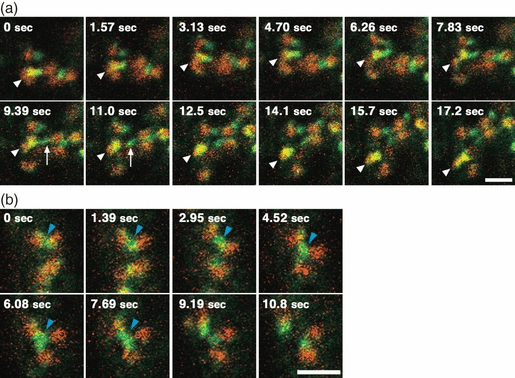
Dynamics of clathrin light chain fused to green fluorescent protein (CLC–GFP) and the trans-Golgi network marker, mRFP-tagged syntaxin of plants 43 (mRFP-SYP43), in root epidermal cells. (a) Sequential confocal images of CLC–GFP (green) and mRFP-SYP43 (red). Arrowheads indicate a motile organelle with both fluorescent markers, and arrows indicate a CLC–GFP-positive tubule (9.39 sec), from which a vesicle is pinched off (11.0 sec). Scale bar = 2 μm. (b) Sequential confocal images of a CLC-positive tubule that interconnects three independent mRFP-SYP43-compartments (blue arrowheads). Scale bar = 2 μm.
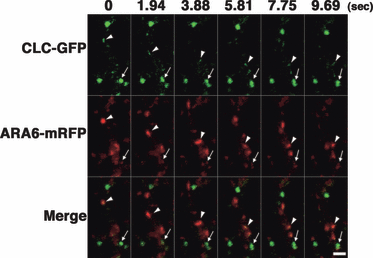
Dynamics of clathrin light chain fused to green fluorescent protein (CLC–GFP) and a multivesicular endosome marker, ARA6-mRFP, in root epidermal cells. Images of CLC–GFP (upper row) and ARA6-mRFP (middle row) in root epidermal cells were merged (bottom row) to detect colocalizations. A small, motile CLC–GFP point moved in concert with an ARA6-mRFP point (white arrowheads). A faint ARA6-mRFP signal was also observed on a subdomain of a large CLC–GFP-positive point (arrows). Scale bar = 2 μm.
To compare the localizations of CLC, SYP43, and ARA6 in the same cell, we generated transgenic plants that expressed CLC–GFP, mRFP-SYP43, and ARA6-Venus. As observed above, the major proportion of the CLC signal was colocalized with SYP43-positive points (white arrows in Figure 7; Movie S3). We also frequently observed ARA6-positive points independent of CLC–GFP and mRFP-SYP43 points (magenta arrowheads in Figure 7). Furthermore, we occasionally observed a CLC signal independent of either mRFP-SYP43 or ARA6-Venus (white arrowhead in Figure 7). We previously reported that ARA6-localizing MVEs and SYP43-localizing TGNs were independent from each other in root tip cells (Ebine et al., 2011); however, in elongating root epidermal cells, we sometimes observed some membrane domains that bore all three markers (cyan arrowhead in Figure 7). Thus, the majority, but not all, CLC was localized on the TGN, and a subpopulation of CLC resided on the subdomain of MVEs. This probably reflects the multiple functions of clathrin in post-Golgi trafficking pathways.
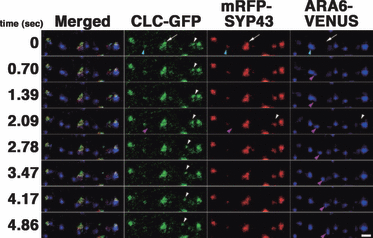
Clathrin light chain fused to green fluorescent protein (CLC–GFP), the trans-Golgi network (TGN) marker, mRFP-tagged syntaxin of plants 43 (mRFP-SYP43), and a multivesicular endosome (MVE) marker, ARA6-Venus were observed in the same root epidermal cells. Localization and dynamics of CLC–GFP (green), mRFP-SYP43 (red), and ARA6-Venus (blue) were observed in the same cell. (White arrows) The TGN was associated with CLC–GFP. (Blue arrowheads) An ARA6-positive MVE was associated with faint mRFP-SYP43 and CLC–GFP signals on a subdomain. (Magenta arrowheads) ARA6-positive compartments with no CLC–GFP or mRFP-SYP43. (White arrowheads) CLC–GFP-positive point that moved independently of mRFP-SYP43 and ARA6-Venus. Scale bar = 2 μm.
Effects of BFA on clathrin distribution and dynamics
We next examined the effects of drugs on CLC–GFP distribution and dynamics. BFA inhibits activation of ARF GTPase, which acts in multiple trafficking pathways (Chardin and McCormick, 1999; Nielsen et al., 2008; Robinson et al., 2008). BFA treatment generally causes a redistribution of Golgi-localized proteins to the endoplasmic reticulum (Sciaky et al., 1997; Saint-Jore et al., 2002). Arabidopsis thaliana possesses a BFA-insensitive ARF GEF, known as GNOM-LIKE 1, which functions at the Golgi apparatus (Richter et al., 2007; Teh and Moore, 2007). Therefore, the major effect of BFA treatment in A. thaliana is the formation of large organelle aggregates that include the TGN and MVE in plant cells; these are known as ‘BFA bodies’ (Ebine et al., 2011; Grebe et al., 2003; Jaillais et al., 2008; Figure 8d). Upon BFA treatment, most of the cytoplasmic CLC–GFP was trapped inside BFA bodies, which surrounded central regions that contained SYP43-positive domains (Figures 8e,f and Figure S1). Treatment with dimethyl sulfoxide (DMSO) did not exert this effect (Figure 8a–c).
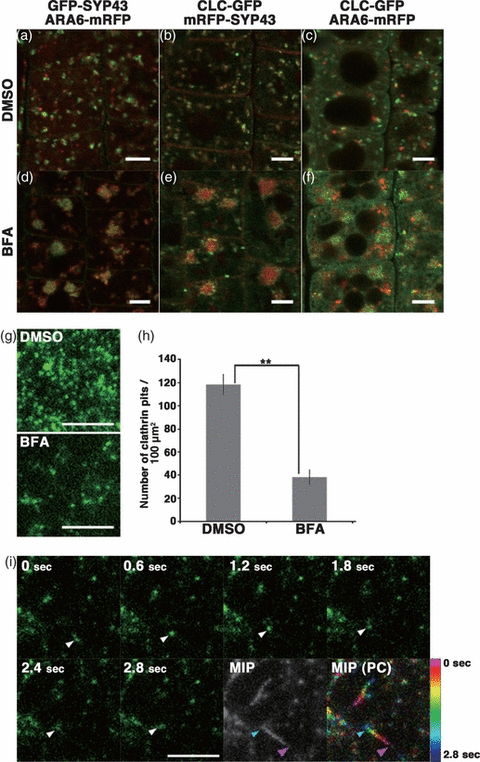
Effects of brefeldin A (BFA) on the distribution and dynamics of clathrin light chain fused to green fluorescent protein (CLC–GFP). (a–f) Distributions of CLC, the trans-Golgi network protein, syntaxin of plants 43 (SYP43), and a multivesicular endosome protein, ARA6, visualized in root epidermal cells treated with DMSO (a–c) or 50 μm BFA (d–f) for 1 h. Scale bars = 5 μm. (g) VIAFM images of CLC–GFP near the plasma membrane in root epidermal cells treated with DMSO (upper panel) or 50 μm BFA (lower panel) for 1 h. Scale bar = 5 μm. (h) Density of clathrin-coated pits at the plasma membrane. BFA, brefeldin A; DMSO, dimethylsulphoxide. **P < 0.01. (i) Time-sequential images of clathrin-coated domains near the plasma membrane in a BFA-treated cell observed by VIAFM. A maximum intensity projection image (MIP) was produced by superimposing 14 frames taken at 0.2-sec intervals; the MIP image was pseudo-colored (PC) with color-coded times (color/time scale on right) to highlight the lateral movement of the clathrin-coated pits. Arrowheads, a motile clathrin-coated pit, at 0 sec and 2.8 sec indicated by magenta and cyan arrowheads, respectively, in MIP and MIP (PC) panels. Scale bar = 5 μm.
We then examined the effect of BFA on CLC–GFP at the plasma membrane by VIAFM. The fluorescence-tagged CLC molecules were observed as punctate foci at the plasma membrane, as reported previously (Fujimoto et al., 2010; Konopka et al., 2008; Naramoto et al., 2010). It was also shown that the CLC constructs colocalized with DRPs and the regulator proteins for ARF GTPases at the plasma membrane. Thus, CLC–GFP most likely labeled clathrin-coated pits/newly-forming CCVs at the plasma membrane. As shown in Figure 8g, the density of clathrin-coated pits was significantly reduced with BFA treatment (mean ± standard deviation): DMSO-treated cells had 118 ± 9.06 foci per 100 μm2 area, and BFA-treated cells had 38.3 ± 6.63 foci per 100 μm2 area (n = 10 areas; P < 0.01, Student’s t-test; Figure 8h). We also noticed that the lateral movement of some clathrin pits was more prominent in BFA-treated cells than in DMSO-treated cells (arrowheads in Figure 8i; Figure S2; Movie S4, S5). These results indicate that BFA affects CLC distribution and dynamics on the plasma membrane, the TGN, and MVEs.
Effects of wortmannin on clathrin localization and dynamics
We next examined the effect of wortmannin (Wm), a phosphatidylinositol 3-kinase inhibitor, on CLC–GFP. ARA6-positive endosomes were swollen to form vacuolated ring-like structures as previously described (Grebe et al., 2003; Jaillais et al., 2008; Ebine et al., 2011). Regarding the TGN, a TGN protein, secretory carrier membrane protein 1 (SCAMP1) was reported to localize on dilated ring-like structures in Wm-treated BY2 cells (Lam et al., 2007; Wang et al., 2009); however, the mRFP-SYP43-labeled TGN was insensitive to Wm treatment in our experimental system (Ebine et al., 2011; Figure 9a). Similarly, most CLC–GFP points were not markedly affected by Wm; this was consistent with the notion that CLC–GFP was predominantly localized on the TGN (Figure 9b,c). We also found that noticeable amounts of CLC–GFP and GFP-SYP43 were closely associated with (or localized on the subdomains of) ring-shaped ARA6-positive structures (arrows in Figure 9a,c).
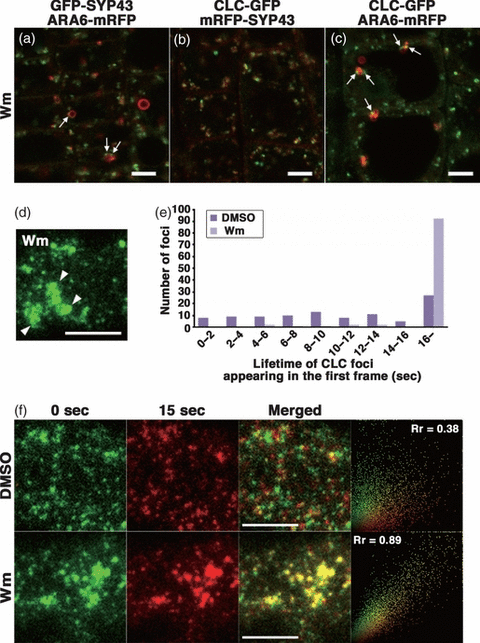
Effects of wortmannin (Wm) on clathrin light chain fused to green fluorescent protein (CLC–GFP). (a–c) Localization of CLC, the trans-Golgi network protein, syntaxin of plants 43 (SYP43), and a multivesicular endosome protein, ARA6, visualized in root epidermal cells treated with 33 μm Wm for 2 h. Arrows indicate (a) SYP43 and (c) CLC signals found near vacuolated ARA6-positive endosomes. Scale bars = 5 μm. (d) A VIAFM image of CLC–GFP near the plasma membrane in a cell treated with 33 μm Wm for 2 h. Arrowheads, aggregated clathrin-coated pits. Scale bar = 5 μm. (e) A histogram displays the lifetimes of 100 randomly chosen clathrin-coated pits in cells treated with DMSO (dark purple bars) or Wm (light purple bars). (f) Changes in spatial distributions of clathrin-coated pits at the plasma membrane imaged at 0 sec (green) and 15 sec (red) after 2 h-treatment with DMSO (upper row) or Wm (lower row). Right-most panels represent the scatter plots of the fluorescent intensity of each pixel. Rr, Pearson’s correlation coefficient. Scale bars = 5 μm.
The effect of Wm was more evident at the plasma membrane, when observed with VIAFM. Wm caused aggregation of clathrin patches at the plasma membrane (white arrowheads in Figure 9d; Movie S6). This finding may be related to the inhibitory effect of Wm on plant endocytosis (Dettmer et al., 2006; Ebine et al., 2011; Emans et al., 2002; Reichardt et al., 2007; Robatzek et al., 2006; Yamada et al., 2005). We then compared the resting times of CLC molecules in Wm-treated and DMSO-treated conditions. We randomly chose 100 CLC-positive points observed in the first frame, generated kymographs over 16 sec for each point of CLC–GFP (data not shown), and examined the time taken to disappear from the focal plane by sequestration into the cytoplasm. In DMSO-treated cells, the resting time of each CLC point was highly variable (dark purple bars in Figure 9e). This finding was probably due to the variable time required for loading cargos into clathrin-coated pits. Alternatively, it may have been due to the variable time required to form clathrin-coated pits. On the other hand, in Wm-treated cells, 92 out of the 100 points analyzed remained at the plasma membrane for the entire 16 sec (light purple bars in Figure 9e). Thus, the resting time of CLC was extended by Wm treatment. We next examined changes in the distribution pattern of clathrin-coated domains at the plasma membrane over 15 sec. We superimposed two images of one region taken 15 sec apart, where clathrin domains were colored green (time 0 sec) or red (time 15 sec) (Figure 9f). In DMSO-treated samples, most of the CLC dots did not overlap. This indicated that the distribution pattern of clathrin-coated domains was almost completely rearranged within 15 sec (Figure 9f, upper panels). In sharp contrast, the green and red images of Wm-treated samples overlapped quite well. This indicates the stabilization of clathrin-coated pits by Wm treatment at the plasma membrane (Figure 9f, lower panels). Accordingly, Pearson correlation coefficients (Rr) calculated for 10 independent images were significantly higher for Wm-treated cells (0.89 ± 0.022) than for DMSO-treated cells (0.38 ± 0.045; P < 0.01, Student’s t-test, Figure 9f). These results suggest that the inhibitory effect of Wm on plant endocytosis was exerted by aggregation and stabilization of clathrin-coated pits at the plasma membrane.
Discussion
Intracellular localization of clathrin light chain
To date, apparently inconsistent results have been reported on the intracellular localization of clathrin (Dhonukshe et al., 2007; Kang et al., 2011; Konopka et al., 2008; Stierhof and El Kasmi, 2010). This prompted us to use a robust method to perform a detailed, quantitative study to compare the subcellular localizations of clathrin and organelle markers. In this study, we visualized clathrin with CLC–GFP in A. thaliana and detected its intracellular localization and dynamics in living cells. We found that a major population of cytoplasmic CLC–GFP was localized on the SYP43-positive TGN. Moreover, live imaging indicated that CLC–GFP moved in concert with SYP43-positive membrane domains in root epidermal cells. In addition, CLC–GFP signals were also frequently observed close to ST-positive Golgi trans-cisternae, but colocalization of CLC–GFP and ST-mRFP was rarely observed. Previous studies that reported clathrin localization on the Golgi trans-cisternae might be explained by the close association between the TGN and the trans-cisternae of the Golgi (Dettmer et al., 2006; Kang et al., 2011; Viotti et al., 2010). The quantitative localization method used in this study represents a powerful tool for reliable evaluation of colocalization.
We also found that smaller CLC–GFP signals were tightly associated with ARA6-positive MVEs. In animal and yeast systems, clathrin has been shown to participate in the formation of intraluminal vesicles in MVEs (Sachse et al., 2002). Additionally, in plant cells, clathrin plaques and membrane invaginations at the rims of clathrin plaques were observed on the limiting membranes of MVEs by electron microscopy (Robinson et al., 2011; Stierhof and El Kasmi, 2010); this implies involvement of clathrin in the formation of intraluminal vesicles in the MVEs of plant cells. However, in animal cells, it was also reported that CCV formation occurred at the endosomes/lysosome interface (Brodsky et al., 2001). Further studies are needed to elucidate the precise function of clathrin on MVEs of plant cells.
Dynamin and clathrin at the forming cell plate
In plants, the dynamin-related proteins, DRP1A and DRP2B, have been shown to colocalize with clathrin at the plasma membrane. This suggests that the functions of dynamin and clathrin are coordinated in CCV formation, as proposed for the animal system (Konopka et al., 2008; Fujimoto et al., 2010). It was also reported that both dynamin and clathrin were localized on cell plates as they formed (Fujimoto et al., 2008; Konopka et al., 2008; Otegui et al., 2001; Samuels et al., 1995; Seguí-Simarro et al., 2004; Tahara et al., 2007; Van Damme et al., 2011). However, unlike their activities at the plasma membrane, we found that dynamin and clathrin behaved differently in cell plate formation (Figure 2). This finding indicates that these molecules contributed to distinct cellular events in cell plate formation.
Cell plate formation processes were intensively analyzed previously with electron tomography (Otegui et al., 2001; Samuels et al., 1995; Seguí-Simarro et al., 2004). In the early stages of cell plate formation, Golgi-derived vesicles fused at the cell plate assembly matrix, and this gave rise to a new cell plate (Seguí-Simarro et al., 2004). The fused vesicles first took on an hourglass-like shape. Dynamin-like helices were observed at the neck of these hourglass-shaped vesicles, and they seemed to cause tubulation of the neck region. This resulted in a deformation from the hourglass-shaped to a dumbbell-shaped structure (Otegui et al., 2001; Seguí-Simarro et al., 2004). On the other hand, clathrin-coated buds and CCVs were not observed during the early stages of cell plate formation. At later stages, these structures began to appear at the central region of the tubulo-vesicular network, which was formed by the fusion of the dumbbell-like vesicles (Otegui et al., 2001; Samuels et al., 1995; Seguí-Simarro et al., 2004). In this study, we demonstrated sequential recruitment of DRP1A and CLC to cell plates as they formed in living cells. DRP1A was recruited to the cell plates during the early stages, and CLC was observed at cell plates at the later stages, when DRP1A was concentrated at the edges of cell plates. These observations are consistent with the model proposed previously based on electron tomography; dynamin and clathrin act in different processes during cell plate formation. However, our observation of faint, but significant dynamin localization at the center of cell plates suggests that dynamin may also be involved in CCV formation at the subregions of cell plates.
Effects of BFA on clathrin localization and dynamics
We showed that clathrin patches at the plasma membrane were sensitive to BFA and Wm. This result appeared to contradict a previous report by Konopka et al. (2008), who argued that BFA and Wm did not exert any effects on clathrin dynamics. This apparent discrepancy could be explained by the different treatment times employed in these experiments; we treated seedlings for 1 and 2 h with 50 μm BFA and 33 μm Wm, respectively; in contrast, Konopka et al. (2008) treated samples for 20 min with 100 μm BFA and 33 μm Wm. Under our experimental conditions, BFA caused aggregation of the TGN and MVEs into BFA bodies, as previously reported (Ebine et al., 2011; Jaillais et al., 2008; Uemura et al., 2004); and Wm treatment caused MVE deformation (Ebine et al., 2011).
With VIAFM, we found that BFA treatment significantly reduced the number of clathrin patches at the plasma membrane (Figure 8g,h). Based on the observation that BFA caused the aggregation of cytoplasmic CLC into BFA bodies, a plausible interpretation was that sequestering CLC into BFA bodies resulted in a reduction of the amount of CLC available for recruitment to the plasma membrane. Alternatively, BFA might accelerate clathrin-mediated endocytosis. This notion would be consistent with the previous report that uptake of a fluorescent endocytosis tracer, FM1-43, was promoted by BFA treatment in tobacco BY-2 cells (Emans et al., 2002). However, it has been also reported that a mutation in GNOM, a BFA-sensitive ARF GEF of A. thaliana, causes perturbation of endocytosis (Naramoto et al., 2010). Because BFA is known to have different effects on different plant species and tissues (Robinson et al., 2008), further studies are needed to determine its mechanism of action in other plants and tissues.
The reduced number of clathrin-coated pits might also be explained by the reduction of endocytic cargo proteins on the plasma membrane. BFA is known to perturb recycling from endosomes to the plasma membrane in A. thaliana (Geldner et al., 2003), and this resulted in an accumulation of plasma membrane proteins (like PIN1) in BFA bodies (Dhonukshe et al., 2007; Geldner et al., 2003; Robatzek et al., 2006; Takano et al., 2005). BFA is also known to interfere with the secretory pathway (Satiat-Jeunemaitre et al., 1996). This situation could also lead to depletion of cargo molecules on the plasma membrane. Decreased trafficking activity would also affect the supply of new membrane to replenish the plasma membrane. Thus, the amount of cargo and/or membranes may be insufficient to evoke endocytosis on the plasma membrane of BFA-treated cells.
Another noteworthy BFA effect on clathrin patches at the plasma membrane was the acceleration of lateral movement (Figure 8i). This result suggests that the ARF GEF responsible for CCV formation at the plasma membrane may also stabilize clathrin-coated pits by restricting lateral movement.
Wortmannin inhibition of endocytosis in plant cells
Wm, a compound known to inhibit phosphatidylinositol 3-kinase (PI3K), is widely used in the plant cell biology field to inhibit endocytosis (Dettmer et al., 2006; Ebine et al., 2011; Emans et al., 2002; Reichardt et al., 2007; Robatzek et al., 2006; Yamada et al., 2005). However, the mechanism of the inhibitory effect on plant endocytosis is unknown. In this study, a VIAFM assessment has shown that Wm has striking effects on the distribution and dynamics of clathrin-coated pits on the plasma membrane; with Wm treatment, clathrin-coated pits formed large aggregates and displayed prolonged resting times (Figure 9d,e). Although further studies are needed to elucidate the precise site of action of Wm, these results strongly suggest that Wm affects the later steps of CCV formation, but not earlier events, like clathrin assembly at the plasma membrane. In the animal system, dynamin, which depends on phosphoinositide metabolism, recruits components and regulates CCV formation (Brodsky et al., 2001; Di Paolo and De Camilli, 2006). Similarly, in plants, the dynamin-related proteins, DRP1A and DRP2A, have been shown to bind PI3P and PI4P (Backues and Bednarek, 2010; Lee et al., 2002) and also assemble at clathrin-coated pits during CCV formation (Fujimoto et al., 2010; Konopka et al., 2008). In Vicia faba, Wm was shown to inhibit production of both PI3P and PI4P (Jung et al., 2002). Taken together, these lines of evidence suggest that Wm may prevent recruitment of dynamin to clathrin-coated pits by altering phosphoinositide metabolism in the plasma membrane. However, other factors involved in endocytosis, including clathrin adaptors, also require specific phosphoinositides for localization and functions (Di Paolo and De Camilli, 2006; Owen et al., 2004). Future studies on how Wm affects these components in CCV formation would be necessary to clarify the precise effect of this drug on plant endocytosis.
Experimental procedures
Plant materials
The following organelle markers were introduced into plants, as described previously: CLC–GFP, Venus-RHA1, ARA6-mRFP, ARA6-Venus, mRFP-SYP43, and ST-mRFP (Ebine et al., 2008; Fujimoto et al., 2010; Ebine et al., 2011). CLC-mKO was generated by replacing GFP with mKO. For DRP1A–GFP, the cDNA encoding GFP was inserted at the end of the cDNA for DRP1A, just in front of the stop codon. The cDNA for DRP1A was fused to 1.5 kb of the regulatory 5′-flanking region of the DRP1A gene. ST-mRFP was a gift from K. Shoda (RIKEN). Transgenic plants that expressed combinations of GFP, mRFP, and Venus fusion proteins were generated by cross-pollination, and F1 or F2 generations were used for microscopic observations. All plants were grown on 1× Murashige Skoog (MS; Murashige and Skoog, 1962) medium in plates at 23°C under continuous light.
Confocal laser scanning microscopy
Multi-color observations were carried out with an LSM710 confocal microscope (Carl Zeiss, http://www.zeiss.com/). For labeling with FM4-64, A. thaliana roots were soaked in 1/2× MS liquid medium that contained 4 μm FM4-64 at 23°C for 2 h. For drug treatments, BFA (50 μm; Sigma-Aldrich) and Wm (33 μm; Sigma-Aldrich, http://www.sigmaaldrich.com/) were applied for 1 and 2 h, respectively. The colocalization analysis was essentially performed as described previously (Bouttéet al., 2006). In brief, the distance from the center of a GFP signal to the center of the closest mRFP signal was measured with Metamorph software (Molecular Devices, http://www.moleculardevices.com/). Noise was removed by the Median Filter, and signals were enhanced with the Morphological Top Hat Filter. Then, images were converted into binary images and noise was removed again. The coordinates of the centers of objects were measured with Integrated Morphometry Analysis; these were then compared in two processed images (GFP and mRFP, or GFP and Venus; Appendix S1). Images were captured with an LSM710 confocal microscope with oil immersion lens (×63, NA = 1.40). We analyzed at least four images from at least three independent roots, which included between 622 and 1093 GFP points.
VIAFM
Roots of transgenic A. thaliana seedlings were placed on glass slides (76 × 26 mm; Matsunami, http://www.matsunami-glass.co.jp/), covered with a 0.12-0.17-mm-thick coverslip (24 × 60 mm; Matsunami), and root epidermal cells were observed under a fluorescence microscope (Nikon Eclipse TE2000-E and a CFI Apo TIRF × 100 H/1.49 numerical aperture objective, http://www.nikon.com/) equipped with a Nikon TIRF2 system. GFP and mRFP were simultaneously excited with 488 nm and 561 nm lasers, respectively. The fluorescence emission spectra were separated with a 565LP dichroic mirror and filtered through either a 515/30 (GFP) or 580LP (mRFP) filter with a Dual View filter system (Photometrics, http://www.photometrics.com/). All images were acquired with an Andor iXonEM EMCCD camera. The acquired images were analyzed with Photoshop CS4 extended, version 11.0.2 (Adobe Systems, http://www.adobe.com/) and Image J (National Institutes of Health, http://www.nih.gov/). The Pearson correlation coefficient was calculated with Image Pro Plus (Media Cybernetics, http://www.mediacy.com/).
Accession numbers for the sequence data
The Arabidopsis Genome Initiative locus identifiers for the genes mentioned in this article are At2g40060 (CLC2), At3g05710 (SYP43), At3g54840 (ARA6/RABF1), At5g45130 (RHA1/RABF2a), and At5g42080 (DRP1A/ADL1A).
Acknowledgements
We thank K. Kondo and M. Koyama (Olympus) for constructing a macro for the Metamorph software, and K. Shoda (RIKEN) for the ST-mRFP plant. This work was supported by Grants-in-Aid for Scientific Research and the Targeted Proteins Research Program (TPRP) from the Ministry of Education, Culture, Sports, Science and Technology of Japan, and a Grant-in-Aid for JSPS Fellows (E. I., 2010649).


