H4 acetylation does not replace H3 acetylation in chromatin remodelling and transcription activation of Adr1-dependent genes
Summary
Histone acetylation regulates gene expression. Whether this is caused by a general increase in nucleosome fluidity due to charge neutralization or by a more specific code is still matter of debate. By using a set of glucose-repressed Adr1-dependent genes of Saccharomyces cerevisiae, whose transcription was previously shown to require both Gcn5 and Esa1, we asked how changes of histone acetylation patterns at the promoter nucleosomes regulate chromatin remodelling and activation. When the signal of glucose reduction reaches the cells, H4 acetylation is kept constant while an increase of H3 acetylation occurs, in an Adr1- and Gcn5-dependent manner. In cells lacking Gcn5 activity, the H3 acetylation increase does not occur and an unexpected increase of histone H4 acetylation is observed. Nevertheless, chromatin remodelling and transcription activation are impaired, suggesting that acetylation of H3 and H4 histones plays different roles.
Introduction
The dynamic nature of chromatin fibre provides the structural and functional flexibility necessary for carrying out the crucial cellular processes, such as cell cycle and differentiation, and for setting the adequate transcriptional responses required to face changing environments. These processes are accompanied by chromatin remodelling and involve reorganization of higher-order chromatin structures. The fundamental unit of the chromatin fibre, the nucleosome, is continuously modified by ATP-dependent remodelling complexes that weaken the interaction between DNA and histones, thus facilitating nucleosome repositioning and exchange of histone variants. At the same time, nucleosomes are continuously targeted by regulatory complexes that covalently modify specific amino acid residues of the histone tails (Wu and Grunstein, 2000; Narlikar et al., 2002; Mellor, 2005).
Histone modifications, including lysine acetylation and methylation, serine phosphorylation and arginine methylation, play major regulatory roles in many genetic events such as transcriptional activation and elongation, silencing and epigenetic cellular memory (Strahl and Allis, 2000; Berger, 2002; Turner, 2002). The interplay between different patterns of modifications was recently reviewed (Fischle et al., 2003).
Histone acetylation has been extensively analysed to define its role in gene expression. Two different functions have been proposed for this covalent modification. The first is the alteration of the physical properties of the histone tail: charge neutralization reduces the electrostatic affinity of the histone tail for DNA, with a consequent increase of nucleosome fluidity and a greater access of protein complexes to specific DNA sites (Howe and Ausio, 1998; Imhof and Wolffe, 1998). The second proposed function is the creation on the histone tail of new epitopes or binding surfaces that can recruit to the nucleosome bromodomain containing proteins (Yang, 2004). This latter function is strictly related to the histone code hypothesis (Strahl and Allis, 2000; Turner, 2000; Marmorstein, 2001).
In order to discriminate between these two different functions several groups have recently exploited genome-wide approaches in yeast. The existence of unique patterns of acetylation on promoter as well as coding regions has been described (Kurdistani et al., 2004). In another study, focused on the histone H4, a general role for lysines 5, 8, 12 acetylation as a cumulative regulator of gene expression and a unique role for lysine 16 in transcriptional control emerged (Dion et al., 2005). A high resolution map of histone acetylation and methylation has revealed that both modifications are associated with transcriptional activity, the first one occurring mainly at the beginning of genes whereas the second one occurs throughout transcribed regions (Pokholok et al., 2005). On the other hand, by using an in vitro reconstitution assay, it was recently shown that acetylation of histone H4 K16 residue specifically and directly affects both higher order chromatin structure and functional interaction with a remodelling complex, strongly indicating that the contribution of histone acetylation can be dual (Shogren-Knaak et al., 2006). Thus, the answer to the question ‘Is it a lysine-specific process or a general mechanism based on charge that makes nucleosome more fluid?’ appears to be that both mechanisms are likely to be important, as suggested (Schübeler and Turner, 2005).
Our major question concerns the possibility that acetylation of H3 and H4 N-terminal tails play different roles in chromatin remodelling and transcriptional activation. By using a set of co-regulated Adr1-dependent genes of Saccharomyces cerevisiae, whose transcription was previously shown to require both Gcn5 and Esa1 (Agricola et al., 2004; Verdone et al., 2005), we asked whether the genes are characterized by similar or different H3 and H4 acetylation patterns and, if so, what is the role of these covalent modifications in chromatin remodelling and transcription activation.
We show that H3 acetylation increases within 30 min from derepression in a Gcn5- and Adr1-dependent manner. Instead, H4 acetylation is kept constant, but shows an unexpected increase in a gcn5 strain. By using a strain carrying a point mutation in the Gcn5 catalytic domain we observe that, when the H3 acetylation increase is specifically impaired, only partial chromatin remodelling occurs and the rate of transcription is low. This suggests that H4 acetylation does not substitute H3 acetylation in nucleosome reorganization and transcription activation.
Results
Activation of ADR1-dependent genes is facilitated by hyperacetylation of both H3 and H4 histone tails
In repressing conditions (3% glucose) the promoters of the Adr1-dependent genes analysed are characterized by the presence of a positioned nucleosome, dubbed −1, on the TATA box, which is strongly perturbed when the cells are shifted to derepressing conditions (0.05% glucose) (Agricola et al., 2004).
Transcription of these genes is affected by the absence of both Gcn5 and Esa1 acetyltransferases, as shown by the reduction of mRNA accumulation in strains lacking either one of the two enzymes (Agricola et al., 2004). This indicates the involvement of H3 and H4 histone N-terminal acetylation in chromatin remodelling and/or promoter activation. To further investigate this issue, we tested a group of strains carrying deletions in histone deacetylases genes. If histone hypoacetylation impairs activation of these genes, one would expect that histone hyperacetylation facilitates mRNA accumulation. The results are shown in Fig. 1: very early times of induction were tested (10 and 30 min after the shift to derepressing conditions) for five genes (ADH2, ADY2, CTA1, POX1 and POT1) in four isogenic strains. Hyperacetylation due to lack of either Hda1 or Rpd3 is clearly responsible for the anticipation of mRNA appearance; the effect is stronger in the double hda1 rpd3 mutant, where a signal even in repressing conditions is observed for most of the genes.
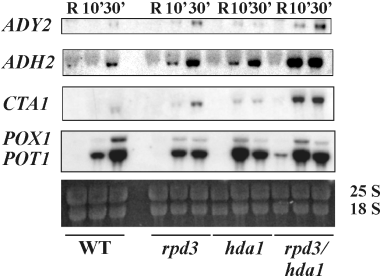
Effects of histone hyperacetylation on the kinetics of ADR1-dependent genes. Northern analysis for the wild type and rpd3, hda1 and rpd3 hda1 mutant strains. Cells in the exponential growth phase (3% glucose repressing conditions, R) were washed once with water, resuspended in fresh medium containing 0.05% glucose (derepressing conditions) and analysed at different time points (10 and 30 min). Ten micrograms of total RNA were loaded on 1.2% formaldehyde-agarose gel, transferred to a nylon membrane and hybridized with probes specific for each gene, as described in Experimental procedures. 25S and 18S indicate the two major yeast rRNA species.
These data indicate that increasing the acetylation levels of histones H3 and H4 by genetic means facilitates activation of all the Adr1-dependent genes tested.
H3 tails acetylation levels of promoter nucleosomes increase when the cells are shifted to low glucose
Because of the effect of hyperacetylation on the kinetics of transcription shown in Fig. 1, we reasoned that derepression of Adr1-dependent genes could be accompanied by a change in the level of acetylation of the promoter nucleosomes. Therefore, we analysed by chromatin immunoprecipitation the region spanning both nucleosomes −1 and +1 of the five Adr1-dependent genes, using nine different antibodies (five specific for the histone H3 acetylated lysines K9, K14, K18, K23 and K27, and four specific for the histone H4 acetylated lysines K5, K8, K12 and K16) on two wild-type cell extracts, one prepared from cultures grown in 3% glucose (repressing conditions), and the other one prepared from cultures shifted to 0.05% glucose (derepressing conditions) for 30 min. The immunoprecipitated DNA was then analysed by real time polymerase chain reaction (PCR).
The results are shown in Fig. 2A. Each plot shows the results for a single gene and each histogram indicates the amount of acetylation observed after 30 min of derepression relative to the repressed state (30 min/R). As a control, a telomeric region, whose pattern of histone modifications is not glucose-regulated, was amplified (see Experimental procedures). The results from three different wild-type backgrounds and from three separate experiments for each background were averaged. The level of 1.5 for the ratio 30 min R−1, which we consider significant, is indicated by a sketched line. An increase in the acetylation levels is observed for all the H3 lysine residues, with a preference for K18, for the ADY2, CTA1, POT1 and POX1 genes, whereas only two residues, K9 and K18 show an increase for the ADH2 promoter. Nevertheless, when extracts from cells derepressed for 1 h instead of 30 min were tested, the acetylation levels of lysines K9 and K18 were higher and also lysine K27 showed a significant increase (data not shown), suggesting that the kinetics of acetylation for the ADH2 promoter could be slower relative to the other genes.
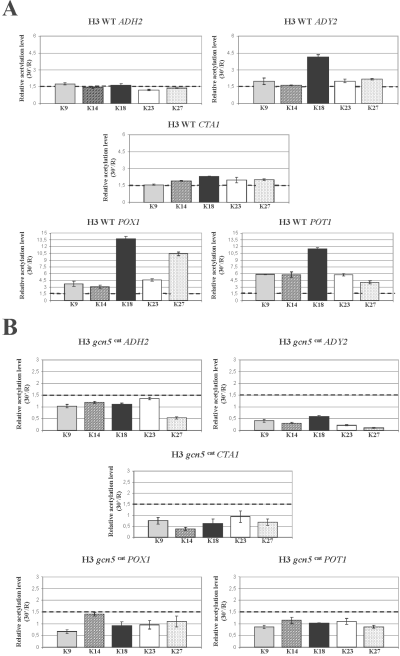
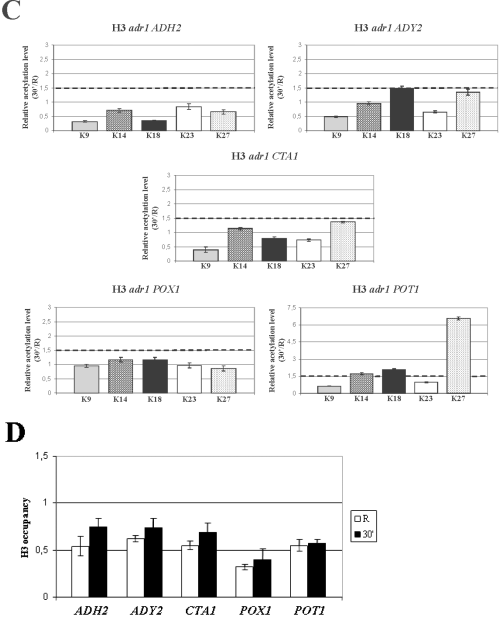
Histone H3 relative acetylation levels at the promoters of Adr1-dependent genes in wild type and mutant strains. Chromatin immunoprecipitation was performed on wild type (A), gcn5 cat (B) and adr1 (C) mutant strains. Cells were collected in repressing conditions (3% glucose, R) and at 30 min after the shift to derepressing conditions (0.05% glucose). Formaldehyde cross-linked protein–DNA complexes were immunoprecipitated using antibodies against individual acetylated H3 lysine residues K9, K14, K18, K23 and K27. Real time PCR was performed using specific primer pairs (see Experimental procedures). The histograms show the relative acetylation enrichments during activation for each H3 lysine residue, obtained by dividing the value at 30 min of derepression by the value in repressing conditions, R. The sketched line represents the value above which we consider any acetylation increase as significant. Each panel shows the same analysis for ADH2, ADY2, CTA1, POT1 and POX1.D. Chromatin immunoprecipitation was performed on wild-type cells collected in repressing conditions (3% glucose, R) and at 30 min after the shift to derepressing conditions (0.05% glucose). Formaldehyde cross-linked protein–DNA complexes were immunoprecipitated using an antibody against the C-terminus of histone H3.
When the same R and 30 min extracts were tested with an antibody against the C-terminus of H3, no significant change of H3 occupancy was observed (Fig. 2D). No histone depletion is therefore occurring during the first 30 min of derepression.
Taken together, the results indicate that when yeast cells are shifted to low glucose the H3 tails of Adr1-dependent promoter nucleosomes undergo an increase in the acetylation levels, with a strong preference for the lysine K18 residue.
A functional Gcn5 catalytic site is required for the increase of H3 acetylation levels at promoter nucleosomes
In order to verify whether the increase in the acetylation levels, observed for the H3 N-terminal tails during activation of the Adr1-dependent genes, was due to the activity of Gcn5, we tested a point mutation in the Gcn5 catalytic site that was shown to impair in vitro the acetyltransferase function (Liu et al., 2005). The analysis of the histone H3 acetylation levels during derepression for this strain is shown in Fig. 2B. No increase of acetylation can be observed for all the lysine residues in all the five genes tested.
These results indicate that the acetyltranferase Gcn5 activity is responsible for the epigenetic modification occurring on the histone H3 tails of the Adr1-dependent promoters during transcriptional activation.
Adr1 is required for the increase of H3 acetylation levels at promoter nucleosomes
Glucose exhaustion in the medium primes a drastic reprogramming of gene expression in yeast cells. In a way, it can be considered as a stress fuelling a series of events that finally influence the majority of cellular pathways. As the switch from fermentation to respiration induces an increase in the level of acetyl-CoA, a relevant cofactor of all acetyltransferases including Gcn5, we argued that such an increase could by itself drive an increase of activity of this enzyme. From this point of view the change of histone H3 acetylation levels observed (Fig. 2A) could represent a side-effect of the metabolic switch. On the other hand, it is possible that the observed change of acetylation levels is the consequence of a more targeted event taking place specifically at the promoter nucleosomes, where chromatin remodelling has to occur in order to allow the transcription machinery to initiate mRNA synthesis. We therefore asked whether the transcription factor Adr1, whose deletion in the cells impairs both chromatin remodelling and activation, is necessary for the H3 acetylation increase. The results of the chromatin immunoprecipitation analysis are shown in Fig. 2C. With the exception of the POT1 gene, whose chromatin remodelling was previously shown to be only partially dependent on Adr1 (Agricola et al., 2004), it is evident that for the other promoters tested the activator Adr1 is necessary to drive the increase in histone H3 acetylation levels.
Thus, the epigenetic modification accompanying derepression of Adr1-dependent genes is a specific event taking place on these promoter nucleosomes and not the consequence of generalized stress-induced increase of Gcn5 acetyltransferase activity.
H4 tails acetylation levels of promoter nucleosomes are kept constant or decrease when the cells are shifted to low glucose
When antibodies against specific histone H4 lysine residues were used in chromatin immunoprecipitation experiments, we found that with the exception of POT1 no significant increase in H4 acetylation levels occurs during derepression (Fig. 3A). Instead, the levels of most residues remain essentially unchanged or even show a decrease, as for the ADY2 gene. Nevertheless, the acetyltransferase Esa1 is acting at least on the ADH2 promoter, as shown by the decrease in H4 acetylation levels observed in a temperature-sensitive esa1 mutant when nucleosomes −1 and +1 were tested in repressing conditions (Verdone et al., 2002). In addition, in the same temperature-sensitive mutant mRNA accumulation of the ADH2 gene (Verdone et al., 2002) and of the CTA1 and POT1 genes (Agricola et al., 2004) is considerably lower.
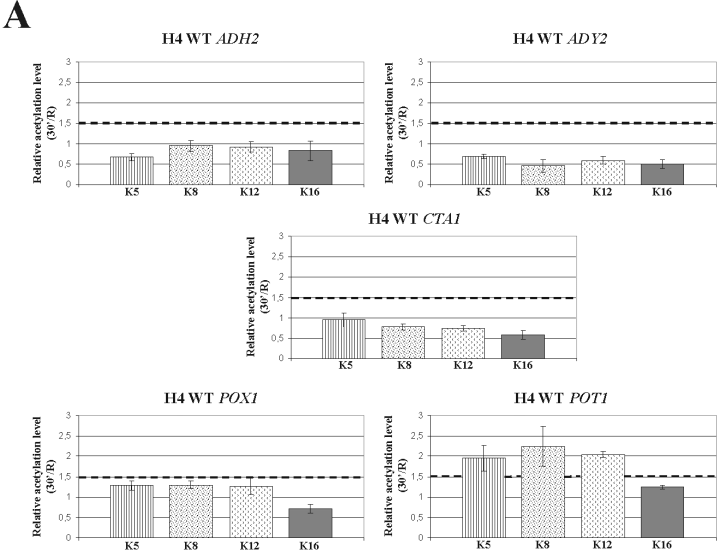
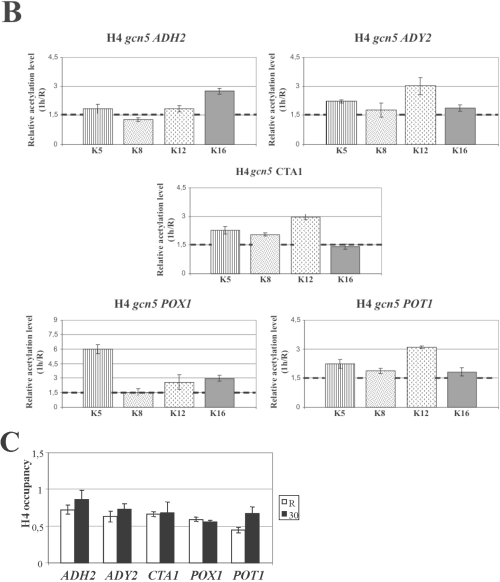
Histone H4 relative acetylation levels at the promoters of Adr1-dependent genes in wild type and mutant strains. Chromatin immunoprecepitation was performed on wild type (A) and gcn5 (B) mutant strains. Cells were collected in repressing conditions (3% glucose, R) and at 30 min (A) and 1 h (B) after the shift to derepressing conditions (0.05% glucose). Formaldehyde cross-linked protein–DNA complexes were immunoprecipitated using antibodies against individual acetylated H4 lysine residues K5, K8, K12 and K16. Real time PCR was performed using specific primer pairs (see Experimental procedures). The histograms show the relative acetylation enrichments during activation for each H4 lysine residue, obtained by dividing the value in derepressing conditions by the value in repressing conditions, R. The sketched line represents the value above which we consider any acetylation increase as significant. Each panel shows the same analysis for ADH2, ADY2, CTA1, POT1 and POX1.C. Chromatin immunoprecipitation was performed on wild-type cells collected in repressing conditions (3% glucose, R) and at 30 min after the shift to derepressing conditions (0.05% glucose). Formaldehyde cross-linked protein–DNA complexes were immunoprecipitated using an antibody against the C-terminus of histone H4.
Taken together these results indicate that histone H4 constitutive acetylation is relevant for transcription activation of this group of genes.
When the same R and 30 min extracts were tested with an antibody against the C-terminus of H4, no significant change of H4 occupancy was observed (Fig. 3C), suggesting that the observed decrease of H4 acetylation, as for the ADY2 gene, is not due to histone depletion.
We also tested lysines K7 and K16 of histones H2A and H2B, respectively, for increased acetylation during ADH2 gene derepression and found that there is no change relative to the repressed state (data not shown).
H4 tails acetylation levels of promoter nucleosomes increase in a gcn5 strain when the cells are shifted to low glucose
When we used as a control the derepressed cell extracts from the Gcn5 catalytic site mutant (Fig. 2B) with the antibodies against the histone H4 lysine residues, we unexpectedly found that at 30 min some of the lysine residues analysed showed hyperacetylation (data not shown). We therefore investigated whether in the absence of Gcn5 the acetylation levels of histone H4 increases with time, by testing the extract of a gcn5-deleted strain at 1 h after derepression. The results are shown in Fig. 3B. At this time, for all the genes and for 80% of the lysine residues tested an increase in the acetylation levels is observed, whereas in a wild type no significant increase occurs (data not shown). In other words, when the increase in the acetylation levels of histone H3 is impaired, a compensatory increase in the acetylation levels of the other core histone, H4, takes place. In the same conditions, the acetylation level of H2A K7 and H2B K16 at the ADH2 promoter does not show any increase (data not shown).
Whatever explanation one may propose for this effect, the increased histone H4 acetylation on the same promoter nucleosomes showing histone H3 hypoacetylation offers the unique opportunity to compare the role of H3 and H4 acetylation in chromatin remodelling and transcription activation.
Chromatin remodelling of Adr1-dependent promoters is impaired in the absence of a functional Gcn5 acetyltransferase, even if histone H4 is hyperacetylated
Transcription activation for the Adr1-dependent genes tested is accompanied by chromatin remodelling. In particular, the nucleosome covering the TATA box (−1 nucleosome) in repressing conditions is heavily perturbed when the cells are shifted to low glucose conditions, as shown by the increased accessibility to micrococcal nuclease of the previously protected DNA sequences (Agricola et al., 2004). This chromatin remodelling event requires the presence of a functional Adr1 transcription factor. In addition, it is influenced by variation in the acetylation levels of the promoter nucleosomes, as shown in the case of the ADH2 gene by using both histone deacetylases and acetyltransferases deletion mutants (Verdone et al., 2002). In order to distinguish between the general effect exerted by the addition of acetyl groups and the more specific effect of targeting H3 or H4 for activation, we tested the promoters of two Adr1-dependent genes for the ability to undergo chromatin remodelling during derepression in the absence of the acetyltransferase Gcn5 or in the presence of a single point mutation in its catalytic site.
The results are shown in Fig. 4. Activation of ADH2 (Fig. 4A) and POT1 (Fig. 4B) is accompanied by a strong perturbation of the TATA box containing −1 nucleosome in wild-type strains as expected (Agricola et al., 2004). Instead, in the two gcn5 mutant strains, inefficient remodelling occurs. In fact, the ratio between the intensity of the band corresponding to the MN hypersensitive site inside the −1 nucleosome (filled arrowhead) and the band corresponding to the upstream border of the same nucleosome (empty arrowhead) is different relative to the same ratio in the wild-type strains (see graphs in the lower part of Fig. 4A and B). The two genes we have analysed for chromatin remodelling were chosen for the following reasons: the first one, ADH2, because it can be considered as a prototype of Adr1-dependent genes, showing a behaviour consistent with other three genes analysed (ADY2, CTA1 and POX1) in terms of Adr1-dependent increase of H3 acetylation during derepression (Fig. 2C). The second one, POT1, because it can be considered as an exception to the rule, showing Adr1-independent acetylation increase of H3 (Fig. 2C) and H4 (data not shown).
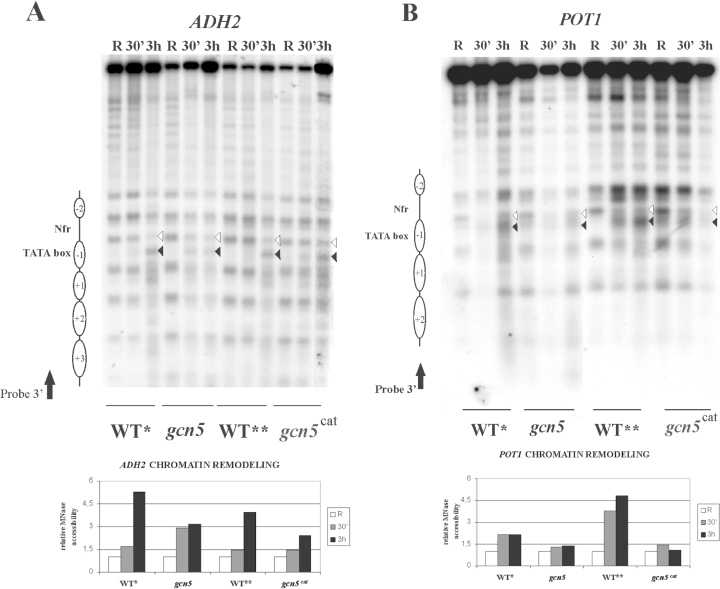
Effects of histone acetylation on ADH2 and POT1 chromatin structure. Spheroplasts from wild type* (YDS2), gcn5, wild type** (yMK839) and gcn5cat cells growing in repressing (R = 3% glucose) or derepressing (D = 0.05% glucose, 30 min and 3 h after glucose depletion) conditions were treated with nystatin and MNase (U = 1.2 units (400 μl)−1 for each condition). After digestion with the appropriate restriction enzymes [HindIII for ADH2 (A) and EcoRI for POT1 (B)] the samples were transferred to nitrocellulose filters and hybridized with specific probes, as described in Verdone et al. (1997) and Agricola et al. (2004) (black arrows). Nucleosomes are represented by ovals. The histograms show the relative MN accessibility of the −1 nucleosome, obtained by dividing the values corresponding to the intensities of the two indicated bands (filled/empty arrowhead). For the repressing (R) conditions the value of this ratio has been fixed to 1.
When a similar type of unbalance in acetylation levels between histone H3 and H4 was achieved by a different method, i.e. by a mutation in both Gcn5 and Rpd3, such that H3 is hypoacetylated and H4 is hyperacetylated, inefficient chromatin remodelling at the same promoters was again observed (data not shown).
For both genes analysed, ADH2 and POT1, even though the dependence of acetylation on Adr1 is different, the promoter nucleosomes cannot be efficiently remodelled because H4 hyperacetylation (Fig. 3B) is not sufficient to compensate for the lack of Gcn5-dependent increase in H3 acetylation levels during derepression (Fig. 2B).
mRNA accumulation of Adr1-dependent genes is strongly impaired in a strain carrying a point mutation in the Gcn5 catalytic site
If chromatin remodelling is not efficient in the absence of H3 hyperacetylation one can expect the same also for transcription activation. We therefore analysed the kinetics of mRNA accumulation for all of the genes in a strain carrying a single point mutation in the Gcn5 catalytic site. The results are shown in Fig. 5. mRNA signals are much lower in the mutant relative to the wild-type strain, suggesting that H4 hyperacetylation (Fig. 3B) is not sufficient to compensate for the lack of Gcn5-dependent increase in H3 acetylation levels during derepression (Fig. 2B).
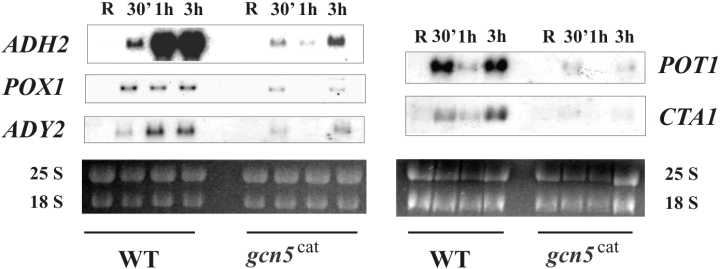
Effects of Gcn5 catalytic site mutation on mRNA accumulation of ADR1-dependent genes. Northern analysis of wild type and isogenic mutant strain gcn5cat. Cells were collected in repressing conditions (3% glucose, R) and at different times (30 min, 1 h and 3 h) after the culture was shifted to derepressing conditions (0.05% glucose). 25S and 18S indicate the two major yeast rRNA species. Two independent filters were hybridized with the specific probes (see Experimental procedures).
Thus, the addition of acetyl groups to either histone H3 or H4 plays different roles in chromatin remodelling and transcription activation.
Discussion
A positive genome-wide association between acetyltransferases recruitment and gene activity (Robert et al., 2004) as well as between histone acetylation at promoters and transcription (Pokholok et al., 2005) was shown, although in another report this last association appears to be controversial (Kurdistani et al., 2004). One interesting aspect of the debate is to understand whether the contribution of histone acetylation to transcription is based on the property of acetyl groups of reducing the positive charges and therefore the strength of the association of the core particles with DNA, or it is based on their capability to provide promoter nucleosomes with tags that can be recognized by diverse sets of proteins involved in chromatin remodelling and/or transcription initiation. In light of recent evidence, it appears that both properties of histone acetylation are relevant, at least as far as H4 is concerned (Shogren-Knaak et al., 2006).
The results presented in this work on a set of Adr1-dependent genes suggest that acetylation of H3 and H4 histones differentially contributes to the mechanism of transcription initiation.
Different roles for H3 and H4 acetylation in chromatin remodelling and transcriptional activation
The recruitment of both SAGA and NuA4 complexes in S. cerevisiae gene activation has been extensively demonstrated (Kuo et al., 1998; Krebs et al., 1999; Vignali et al., 2000; Cosma, 2002; Barbaric et al., 2003; Bryant and Ptashne, 2003; Geng and Laurent, 2004; Nourani et al., 2004; Robert et al., 2004), so that histone acetylation has been clearly implicated in promoter activation. This covalent modification is regulated, as shown by the fact that individual activators confer distinct acetylation patterns on target promoters (Deckert and Struhl, 2001). Interestingly, in the case of the glucose-repressible SUC2 gene, the acetyltransferases recruitment pattern (constitutive for Esa1 and inducible for Gcn5) resembles the acetylation pattern of Adr1-dependent promoter nucleosomes (constitutive for H4 and inducible for H3), suggesting that gene induction by low glucose is mechanistically conserved. Nevertheless, only in a few reports the question of whether different contributions are provided by the various histone tails was addressed.
Without any covalent modifications, the N-terminal tails do not possess a well-defined structural motif, but are highly flexible: in fact, they did not adopt well-defined positions in the crystal structure of the nucleosome core particle (Luger et al., 1997). An in vitro study, based on analytical ultracentrifugation and aimed at determining the consequence of individual histone tail domain deletions on array folding, has shown that the stretch of amino acids 14–19 of histone H4 is specifically required to mediate chromatin compaction (Dorigo et al., 2003). One further in vitro study has analysed the specific contributions of histone tail acetylation to the mechanical stability of nucleosomes (Brewer-Toland et al., 2005). An in vitro competition assay, designed to mimic in vivo conditions, was developed to analyse the distribution of acetylated histones, and it was found that H3 acetylation by SAGA is promoter-proximal, whereas H4 acetylation is more broadly distributed (Vignali et al., 2000), suggesting mechanistically different processes. In contrast, in a genome-wide analysis acetylation of either H3 or H4 amino terminus was shown to be sufficient to allow activation (Sabet et al., 2004).
Our present in vivo study demonstrates that H3 hyperacetylation plays a crucial role in chromatin remodelling of Adr1-dependent promoters. If this major pathway is not acting, an alternative mechanism is primed leading to H4 hyperacetylation. The increase of H4 acetylation could alternatively be an indirect consequence of Gcn5 loss, indicating a decrease in the activity or in the synthesis of an H4 deacetylase. Nevertheless, the event occurring during derepression in the absence of a functional Gcn5 is not sufficient to drive efficient −1 nucleosome destabilization and mRNA accumulation (4, 5).
When a similar type of unbalance in acetylation levels between histone H3 and H4 is achieved by a different method, i.e. by a mutation in both Gcn5 and Rpd3, such that H3 is hypoacetylated and H4 is hyperacetylated, inefficient chromatin remodelling is again observed (data not shown). On the other hand, the increase in H3 acetylation alone is not sufficient to allow a high level of mRNA accumulation, as shown by the reduced transcription level in an esa1 temperature-sensitive mutant (Verdone et al., 2002; Agricola et al., 2004).
Taken together these results suggest that the H3 hyperacetylation, occurring soon after the shift to low glucose conditions, is mainly involved in the chromatin remodelling step, whereas H4 acetylation, which is a constitutive feature of the promoter nucleosomes, is more relevant to stabilize the remodelled state and the association of the transcription machinery.
Therefore, acetylation of H3 and H4 N-terminal tails promotes mechanistically different processes and does not display redundant function in chromatin remodelling and gene activation.
Dynamics of histone H3 and H4 acetylation
The increase in H3 acetylation levels observed (Fig. 2) could actually be an underestimation of the real change if the activation of these genes led to reduced nucleosome occupancy, as shown for specific genes such as PHO5 (Boeger et al., 2003; Reinke and Hörz, 2003; Adkins and Tyler, 2006), HSP30 and HSP82 (Pokholok et al., 2005), and genome-wide (Lee et al., 2004). Two of the promoters analysed in the present work, namely ADH2 and ADY2, were recently shown to undergo nucleosome depletion during derepression (Adkins and Tyler, 2006). In particular, the experiment in that report was performed by using an antibody against the C-terminus of H3 on extracts from cells grown for 4 h in derepressing conditions. We show that 30 min after derepression the amount of bulk histones that can be immunoprecipitated with antibodies against both H3 and H4, does not decrease relative to the repressed state (Fig. 2D and Fig. 3C). Therefore, within the first 30 min of activation, nucleosomes are not lost and H3 acetylation increases, whereas, at later times, they start to be depleted as remodelling proceeds and, after 4 h, a drop in the amount of bulk histones is observed (Adkins and Tyler, 2006). In a previous report, no increase of H3 acetylation and a decrease of H4 acetylation, relative to the repressed state, were shown when the ADH2 promoter was tested 6 h after the shift to derepressing conditions (Deckert and Struhl, 2001). These results were explained by the authors as being due to H4-specific deacetylation, but they are also compatible with reduced nucleosome occupancy occurring at later times of activation.
On the other hand, we have shown that chromatin remodelling during activation of the ADH2 gene consists in a change of translational positioning of the TATA box-containing nucleosome (Di Mauro et al., 2002), suggesting that nucleosome particles are repositioned rather than lost. The partial chromatin remodelling observed in the absence of a functional Gcn5 (Fig. 4A) could be due to insufficient fluidity of the nucleosome particles that impairs the required mobilization. This would be consistent with the fact that the borders of the −1 and +1 nucleosomes are still visible, suggesting the presence of more stable particles on the promoter sequences. This is true even though the same nucleosomes show enhanced H4 acetylation, thus indicating that either H4 acetylation does not provide enough fluidity or that H3 acetylation actually works through a different modality, i.e. by recruiting proteins capable of mobilizing promoter nucleosomes, as shown for the RSC complex (Kasten et al., 2004).
Besides nucleosome depletion and sliding, other mechanisms are certainly acting to make the process of acetylation as dynamic as possible. In fact, in addition to targeted histone modification, global acetylation and deacetylation were reported (Vogelauer et al., 2000; Waterborg, 2001), indicating that the acetylation state of a genome, and therefore the chromatin structure itself are in constant flux. The activity of histone deacetylases, acting on both H3 and H4 histones at the ADH2 promoter (Fig. 1 and Verdone et al., 2002), as well as on the other four analysed, is shown by the faster kinetic of mRNA accumulation occurring in strains mutated for Hda1 and Rpd3 (Fig. 1).
The POT1 promoter: the exception that confirms the rule
The Adr1-dependent genes tested show the same mechanism of activation, in terms of histone acetylation increase and chromatin remodelling. The co-ordinate regulation is based on the fact that all promoters share a common chromatin architecture in repressing conditions and a common remodelling process during activation, involving the TATA box-containing nucleosome −1 (Agricola et al., 2004). In the present study, we show that hyperacetylation of histone H3, required for chromatin remodelling and derepression, do also occur in a co-ordinate fashion, even though specific residues show different levels of modification for each promoter (Fig. 2A). The POT1 promoter represents an exception: in fact, we observe an increase in the acetylation levels of both histones H3 and H4 in a wild-type strain (Fig. 2A and Fig. 3A), which is Adr1-independent (Fig. 2C and data not shown). Other factors are indeed involved in POT1 chromatin remodelling and activation (Fazzio and Tsukiyama, 2003; Young et al., 2003), and, in fact, Adr1 is only partially required for nucleosome −1 destabilization (Agricola et al., 2004).
Nevertheless, histone H3 acetylation is strongly required for efficient remodelling of the TATA box-containing nucleosome (Fig. 4B), even in the presence of H4 hyperacetylation, therefore confirming the rule.
Who reads the code?
Acetylated lysines on histone tails provide a platform for the recruitment of bromodomain-containing transcriptional regulators, including histone acetyltransferases and components of chromatin-associated multiprotein complexes (Jenuwein and Allis, 2001; Hassan et al., 2002; Yang, 2004). Bromodomains are known to recognize acetyl lysine of histone H4 (Dhalluin et al., 1999; Owen et al., 2000; Matangkasombut and Buratowski, 2003; Martinez-Campa et al., 2004). Nevertheless, also histone H3 was shown to be a bromodomain target (Ladurner et al., 2003; Kasten et al., 2004; Kurdistani et al., 2004).
As in the class of co-regulated genes here analysed histone H3 acetylation appears to be more relevant than histone H4 acetylation in chromatin remodelling, we hypothesize that the acetylated lysines of histone H3 could be read by some ATP-dependent chromatin remodelling complex, such as RSC (Kasten et al., 2004). Alternatively, H3 acetylation could represent a signal for the induction of a different type of histone modification. The Bdf1 protein could instead be involved in binding the acetylated lysines of histone H4 at these promoters, helping in the recruitment and stabilization of TFIID for the onset of transcription, as shown for the PHO5 promoter (Martinez-Campa et al., 2004). Indeed, we have observed a dependence on Bdf1 of all the genes tested at the early stage of mRNA accumulation, even though we do not know whether the effect is direct or indirect (data not shown).
Experimental procedures
Yeast strains and media
Saccharomyces cerevisiae strains used in this work are CY26 (wild type), MATα, ura3-52, lys2-801a, ade2-101o, trp1-Δ1, his3-Δ200, leu2-Δ1; JSY112 (adr1), same as CY26 except adr1::LEU2; YDS2 (wild type), MATa, trp1-1, his3-11, 15, ade2-1, leu2-1, can1-100 (Laman et al., 1995); WJY111 (hda1), same as YDS2 except hda1::TRP1; WJY139 (gcn5) same as YDS2 except gcn5::URA3; WJY140 (rpd3), same as YDS2 except rpd3::LEU2; WJY141 (rpd3 hda1), same as YDS2 except rpd3::LEU2, hda1::TRP1; yMK839 (wild type), MATa trp1, leu2-3, 112, ura 3-52; yMK984 (gcn5cat), same as yMK839 except gcn5 F221A (Liu et al., 2005).
Yeast strains were grown in YPD medium (1% yeast extract, 2% bacto peptone, 3% glucose). To derepress all genes, the cells were collected by centrifugation, washed once with water, and resuspended in the same volume of fresh YP medium containing 0.05% glucose for the appropriate time.
Enzymes
All nucleases were purchased from Roche. Zymolyase 100T was purchased from Seikagaku Corp.
Antibodies
All antibodies against acetylated lysines were purchased from Upstate. The antibody against the C-terminus of histone H3 was from Abcam (ab1791) and the one against the C-terminus of histone H4 was from Santa Cruz (sc-8658).
Chromatin analysis
The analysis of nucleosome position was performed by using MN digestion of spheroplasts coupled with the indirect end-labelling procedure (Wu, 1980). Cells exponentially growing (A600 0.3 OD ml−1) in repressing (3% glucose) or derepressing (0.05% glucose) conditions were washed once with water and then resuspended in Zymolyase buffer (1 M sorbitol, 50 mM Tris-HCl pH 7.5, 10 mM β-mercaptoethanol). Incubation with Zymolyase (0.01 mg OD−1) was for 20 min at room temperature. The resulting spheroplasts were collected by centrifugation and resuspended in Nystatin buffer (1 M sorbitol, 20 mM Tris-HCl pH 8.0, 1.5 mM CaCl2, 50 mM NaCl, 100 μg ml−1 Nystatin) in order to permeabilize cell membranes for the subsequent treatment with MN (Venditti and Camilloni, 1994). Incubation with MN was for 15 min at 37°C and the reaction was stopped with 5 mM EDTA, 1% SDS final concentrations. The samples were then treated with proteinase K for 2 h at 56°C and purified by phenol-chloroform extraction and ethanol precipitation.
After secondary digestion with the appropriate restriction endonuclease the samples were run on 1.5% agarose gels in TBE 1× buffer and transferred to nitrocellulose filters. Southern blot and hybridization were performed by standard procedures.
For POT1 the oligonucleotides used were 5′CCAACAAGATTAAGGTTGGGC3′ and 5′-AGCGAACTCGTCTTGATCCTT3′ (starting positions 406 and 623 respectively). pFA plasmid DNA (Verdone et al., 1997) was used to prepare the ADH2 probe for the indirect end-labelling analysis.
RNA analysis
Aliquots containing the same number of cells were collected by centrifugation, and total RNA was prepared as previously described (Schmitt et al., 1990). After spectrophotometric determination of the RNA amount present in each aliquot, 10 μg of RNA was loaded onto 1.2% agarose-MOPS gels containing formaldehyde and ethidium bromide.
Northern blot analysis was performed by standard procedures. To detect the ADH2 mRNA a 5′-end-labelled oligonucleotide was used (5′-GTTGGTAGCCTTAACGACTGCGCTAAC-3′; from +710 to +684 of the coding region).
To detect the CTA1 mRNA a 1207 bp restriction fragment (BamHI-EcoRI) from plasmid ER1-1 was used (pUC18 containing the catalase A gene).
For all the other genes the oligonucleotides used were as follows: 5′GCTAGGCTTGCTAGTTATATG3′ and 5′CGAAGCTTTGTCTGGATCATT3′ for the POX1 gene (starting positions 249 and 336 respectively); 5′CCAACAAGATTAAGGTTGGGC3′ and 5′-AGCGAACTCGTCTTGATCCTT3′ for the POT1 gene (starting positions 406 and 623 respectively); 5′GTACCATGAAATCCACTGTTATG3′ and 5′CTGCATATGCGTTGTACCAA3′ for the ADY2 gene (starting positions 610 and 755 respectively).
ChIP with anti-acetylated histone antibodies and real time PCR analysis
ChIP was carried out with highly specific antibodies raised against individual acetylated lysines as described previously (Rundlett et al., 1998; Hecht and Grunstein, 1999; Suka et al., 2001). Input and immunoprecipitated DNA were analysed by real time PCR using primer pairs for specific regions. The primers used were described in Table 1.
| Promoter | Primer | Sequence |
|---|---|---|
| POT1 | Forward | 5′-GGAAGAACTCGTTGCTGGAGAA-3′ |
| Reverse | 5′-ACCTTTACCGATGGCAGACCT-3′ | |
| POX1 | Forward | 5′-AAAATTATTTAAACAACTTGAACAGGCC-3′ |
| Reverse | 5′-ATTAATAGTAGTACGTCTCGTCATATCG-3′ | |
| ADY2 | Forward | 5′-AACCACAAAACAACTCATATACAAACAA-3′ |
| Reverse | 5′-TAAATCTTGCCCAACGAATCATGAG-3′ | |
| CTA1 | Forward | 5′-CGAAAATCCCCACAGTGACAG-3′ |
| Reverse | 5′-TCTTCTAGGGTTCCAAATTTATTTGTAA-3′ | |
| ADH2 | Forward | 5′-AATACACAATGTCTATTCCAGAAACTCA-3′ |
| Reverse | 5′-GTACTTGACGTTGATTAACAATTCGTT-3′ | |
| TEL a | Forward | 5′-CCATAATGCCTCCTATATTTAGCCTTT-3′ |
| Reverse | 5′-TGACATATCCTTCACGAATATTGTTAGA-3′ |
- a. Telomere of chromosome VI-R.
For real time PCR 0.5 μl of each input (1:250) and immunoprecipitated DNA were used as template in 25 μl reactions containing 1× Green Supermix Bio-Rad (100 mM KCl, 40 mM Tris-HCl pH 8.4, 0.4 mM dNTPs mix, iTaq DNA polimerase 50 U ml−1, 6 mM MgCl2, SYBR Green I, 20 nM fluoresceine) and 7.5 pmol of each primer. Thermal cycling was performed for 40 cycles.
Quantitative analysis of real time PCR products was performed according to the Bio-Rad technical note 2916.
Acknowledgements
We thank M.-H. Kuo for the kind gift of the strains yMK839 and yMK984. We also thank P. Filetici and E. Bastonini for helpful discussion and the Department of Cellular and Developmental Biology (University of Rome, La Sapienza) for the utilization of the real time PCR machine. This work was supported by grants from CNR ‘Genomica Funzionale’, Centre of excellence BEMM La Sapienza, FIRB, and Ministero dell'Ambiente e della Tutela del Territorio.


