Distribution, metabolism, and excretion of toceranib phosphate (Palladia™, SU11654), a novel tyrosine kinase inhibitor, in dogs
Abstract
Yancey, M. F., Merritt, D. A., White, J. A., Marsh, S. A., Locuson, C. W. Distribution, metabolism, and excretion of toceranib phosphate (Palladia™, SU11654), a novel tyrosine kinase inhibitor, in dogs. J. vet. Pharmacol. Therap.33, 154–161.
Toceranib phosphate (Palladia™, SU11654), a multireceptor tyrosine kinase inhibitor with anti-tumor and anti-angiogenic activity, has been developed for the treatment of mast cell tumors in dogs. An overview of the distribution, metabolism, and excretion of toceranib phosphate in dogs is presented. When [14C]-toceranib was orally administered to dogs, the majority of the radioactivity (92%) was excreted in feces and only a small portion (7%) was excreted in urine. Seven days after a single 3.25 mg/kg oral dose, radioactivity was the highest in bile and liver, with measurable concentrations in lymph nodes, colon, adrenals, bone marrow, kidneys, lungs, spleen, pancreas, and skin. Plasma protein binding of toceranib in fresh plasma ranged from 90.8% to 92.8% at concentrations between 20 ng/mL and 500 ng/mL and was independent of concentration. Microsomal and hepatocyte incubations resulted in the formation of a single metabolite. Spectrometric analysis of the metabolite was consistent with the formation of an alicyclic N-oxide of toceranib. The combination of the high rate of fecal excretion and the long elimination half-life of toceranib indicate enterohepatic recirculation of the parent compound and/or the N-oxide metabolite.
Introduction
Toceranib phosphate (Palladia™, SU11654, Fig. 1) is a tyrosine kinase inhibitor which exerts its anti-tumor and anti-angiogenic activity through inhibition of KIT, vascular endothelial growth factor 2 (VEGFR2), and platelet-derived growth factor receptor-2 (PDGFR2) (Liao et al., 2002; London et al., 2003; Pryer et al., 2003). When administered to dogs as an oral tablet at an initial dose of 3.25 mg/kg every other day for 6 weeks, toceranib phosphate has been shown to increase significantly the objective response rate (sum of complete and partial responses) compared with placebo treatment in dogs with Patnaik grade II or III, recurrent, cutaneous mast cell tumors with or without regional lymph node involvement (London et al., 2009). Studies in canine cancer patients have shown that an initial dose of 3.25 mg/kg administered orally every other day with dose reductions to as low as 2.2 mg/kg every other day or dose interruptions (cessation of drug for up to 2 weeks) to manage adverse events, if needed, yields plasma drug concentrations that are both effective and well tolerated (London et al., 2003, 2009; Pryer et al., 2003).
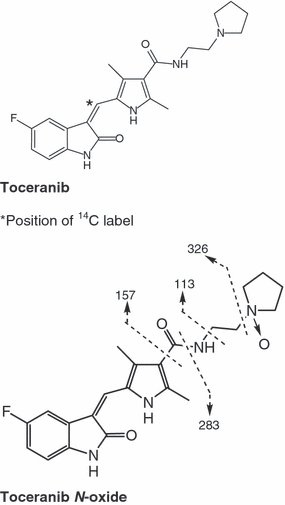
Structure of toceranib and its metabolite shown with proposed mass spectrometry derived product ions.
Pharmacokinetic results reported elsewhere (Yancey et al., 2009) show that toceranib has a moderate clearance and a large volume of distribution. The high volume of distribution suggested that the drug was well distributed in the body and sequestered in various tissues. There was also evidence of enterohepatic recirculation observed in a fed/fasted study. Three studies with toceranib have been performed to further investigate its distribution, metabolism, and excretion. A single oral dose of 3.25 mg/kg [14C]-toceranib, the target therapeutic dose, was administered to beagle dogs to evaluate the distribution and excretion of toceranib. Plasma protein binding of toceranib was determined in an in vitro experiment. The in vitro metabolism of toceranib was also evaluated in dog microsomes and hepatocytes. These studies provide additional insight into the disposition of toceranib and build on the PK data presented elsewhere (Yancey et al., 2009).
Materials and Methods
ADME studies
All references to doses are as toceranib phosphate, the salt form of the drug, and are given as free base equivalents. All references to plasma concentrations and pharmacokinetic estimates are as toceranib, the free base.
The [14C]-toceranib used in Studies 1 and 2 was synthesized by Nerviano Medical Sciences (Milan, Italy). See Fig. 1 for the position of the 14C label. The specific activity was 0.125 mCi/mg and radiochemical purity was 97.5%. Nonradiolabeled toceranib phosphate was used to dilute the radiolabel as needed prior to dose administration at the time the formulations were prepared.
All experiments described in this manuscript were carried out in compliance with national legislation and were subject to local ethical review. All studies were well documented consistent with internationally recognized standards.
Study 1 (distribution and excretion)
Eight clinically healthy laboratory beagle dogs (four male and four female, aged 18 to 24 months and weighing between 9.4 kg and 18.4 kg at the beginning of the study) were used. During the study period, the animals were individually housed in stainless-steel metabolism cages designed for separate quantitative collection of urine and feces. The formulation consisted of 447 mg toceranib and 23.14 mg [14C]-toceranib dissolved in 72 mL of 0.1 m phosphoric acid containing 7.271 g Captisol® (β-cyclodextrin sulfobutyl ether 7-sodium salt; Cydex, Inc., Terrace, KS, USA) and 0.543 g sodium chloride. The solution was adjusted to pH 5.77 with 2 m sodium hydroxide and diluted to a final weight with water. The final formulation had a concentration of 3.26 mg/g toceranib (20 μCi/g). This formulation was administered to the eight dogs on study as a single oral gavage at a target dose of 3.25 mg/kg. Urine was quantitatively collected into opaque containers (cooled by solid CO2 for the first 48 h) at predose, 0 to 6 h, 6 to 24 h, and then for 24-h intervals to 168 h postdose. Feces were quantitatively collected at 24-h intervals to 168 h postdose. At the time of each daily collection, the cages were washed with water and the water was retained. Whole blood samples (2 mL each) were collected from the jugular vein into EDTA tubes at 0 (pre-dose), 0.5, 1, 2, 4, 8, 12, 24, 32, 48, 56, 72, 96, 120, 144, and 168 h postdose. Plasma was separated from the whole blood by centrifugation and the blood cells were discarded.
At 168 h postdose, the animals were euthanized and the organs, tissues, and fluids listed in Table 1 were collected. Samples were stored frozen at approximately −20 °C.
| Sample | Male | Female | Overall | |||
|---|---|---|---|---|---|---|
| Mean | SD | Mean | SD | Mean | SD | |
| Adrenals | 160 | 63 | 212 | 76 | 186 | 70 |
| Bile | 1420 | 638 | 1380 | 778 | 1400 | 659 |
| Bladder | 14* | 7* | 27 | 6 | 21 | 9 |
| Bone Marrow | 79 | 51 | 240 | 69 | 160 | 102 |
| Brain | BLQ | NC | BLQ | NC | BLQ | NC |
| Colon | 99 | 26 | 305 | 229 | 202 | 187 |
| CSF | BLQ | NC | BLQ | NC | BLQ | NC |
| Duodenum | 34 | 10 | 30 | 9 | 32 | 8 |
| Fat-Renal | BLQ | NC | BLQ | NC | BLQ | NC |
| Heart Muscle | 27 | 20 | 44 | 13 | 36 | 18 |
| Ileum | 41 | 17 | 47 | 13 | 44 | 14 |
| Jejunum | 31 | 29 | 27 | 7 | 29 | 20 |
| Kidneys | 108 | 28 | 152 | 48 | 130 | 43 |
| Liver | 950 | 535 | 1130 | 383 | 1040 | 442 |
| Lungs | 78 | 32 | 114 | 62 | 96 | 49 |
| Lymph Node | 349 | 221 | 365 | 290 | 357 | 239 |
| Mammary Gland | 18* | 12* | 68 | 35 | 44 | 36 |
| Muscle | 12* | 4* | 12* | 3* | 12 | 3 |
| Pancreas | 76 | 31 | 99 | 39 | 87 | 35 |
| Sciatic Nerve | BLQ | NC | BLQ | NC | BLQ | NC |
| Skin | 74 | 36 | 89 | 25 | 82 | 29 |
| Spinal Cord | BLQ | NC | BLQ | NC | BLQ | NC |
| Spleen | 58 | 16 | 122 | 53 | 90 | 50 |
| Stomach | 21* | 12* | 29 | 9 | 25 | 11 |
| Stomach Mucosa | 42 | 24 | 41 | 27 | 41 | 23 |
| Synovial Fluid | BLQ | NC | BLQ | NC | BLQ | NC |
| Whole Blood | BLQ | NC | BLQ | NC | BLQ | NC |
- BLQ, below the lower limit of quantification (∼11 ng-eq/g); NC, not calculated; *Mean accounts for some values BLQ.
Study 2 (plasma protein binding)
A single pool of fresh plasma was collected from three male and three female beagle dogs (1 to 2 years old) using EDTA as an anticoagulant. For experiments in once-frozen plasma, the plasma was stored frozen at ≤−10 °C for approximately 24 h before thawing at ambient temperature for use in the experiment. Both fresh and frozen plasma were fortified with [14C]-toceranib at concentrations of 20, 70, 150, and 500 ng/mL to cover the range of therapeutic plasma concentrations. Duplicate aliquots of each spiked plasma sample were dialyzed with a Dianorm Equilibrium Dialyser in conjunction with Diachema membranes with a molecular weight cut off of 5000 Daltons (Dianorm BmbH, Germany) against an equal volume of phosphate buffered saline at 37 °C for 4 h. At the end of dialysis, each half cell was emptied and duplicate aliquots were taken for analysis for total radioactivity. All experiments for plasma protein binding were conducted under yellow light to prevent photoisomerization of toceranib.
Study 3 (in vitro metabolism)
Toceranib was incubated at a concentration of 6 μm (2.4 μg/mL) in the presence of pooled microsomes (1 mg microsomal protein/mL, Xenotech LLC, Lenexa, KS, USA) from 4 male and 4 female dogs, and 1.0 mm NADPH in 50 mm potassium phosphate buffer at pH 7.4 at 37 °C in a darkened room to prevent photoisomerization. Control samples without NADPH (Control A) and without drug (Control B) were incubated concurrently with experimental samples. Following the incubation period, samples and controls were quenched with 0.5 mL of ice-cold acetonitrile. Samples were centrifuged for 10 min at ∼1000 g. Supernatants were transferred to autosampler vials for analysis by HPLC. Experiments were performed to evaluate metabolite formation, differences in metabolism of the two photoisomers, and differences between male and female dogs.
For Phase II metabolism studies of toceranib, preplated dog hepatocytes with a matrigel overlay (Cedra Corp., Austin, TX, USA) were used on the day of delivery. The cells were prepared for use according to the supplier’s instructions. Cells were then dosed with toceranib at 1 μm, 10 μm, or 100 μm concentration. Glucuronidation of umbelliferone was used as a control to verify proper cell function. All plated cells were incubated at 37 °C under CO2. At time points of 0, 8, 24, and 48 h, samples were removed from the incubator and the media from each well was transferred and rinsed into individual 15 mL polypropylene test tubes. The combined eluent, cells, and solvent were mixed, centrifuged, and the supernatant transferred to a HPLC vial for analysis.
Total radioactivity determinations
Duplicate aliquots of clear liquid samples from Study 1 (0.15 to 1.0 mL) were diluted to 1 mL with water and mixed with 10 mL of liquid scintillation fluid. Feces, tissues, and whole blood were homogenized with water (if necessary) and duplicate aliquots of each sample (∼0.3 g) were combusted using a Packard Tri-Carb 307 Automatic Sample Oxidizer (Packard Instrument Co., Downers Grove, IL, USA). The resultant 14CO2 generated was collected by absorption in Carbosorb (PerkinElmer, Waltham, MA, USA) (8 mL) to which 10 mL Permafluor E+ scintillation fluid (PerkinElmer) was added. Samples from Study 2 (100 to 200 μL) were diluted with 1 mL of water and mixed with 10 mL of Aquasafe 500 Plus scintillation fluid (Zinsser Analytic, Maidenhead, UK).
All samples prepared in scintillation fluid were subjected to liquid scintillation counting for 5 min, together with blank samples, using a Packard TR2100 Liquid Scintillation Analyzer (Packard Instrument Co.) with automatic quench correction by an external method. Where possible, samples were analyzed in duplicate and allowed to heat and light stabilize prior to analysis. Prior to calculation of each result, a background count rate was determined and subtracted for each sample count rate.
Evaluation of microsomal and hepatocyte incubations
Prepared samples were analyzed using a high performance liquid chromatography (HPLC) system consisting of a Waters 600 E multi-solvent delivery system, a Waters 717 plus autosampler, and a Waters model 486 UV absorbance detector. The column was a BDS Hypersil C18 (100 × 4.6 mm, 5 μm particle size). The samples were eluted from the column using a gradient elution from 0.1% trifluoroacetic acid:acetonitrile (95:5, v:v) to 0.1% trifluoroacetic acid:acetonitrile (5:95, v:v) over 36 min.
A single metabolite was observed in microsomes and purified by preparative HPLC. A 100-μg sample was subsequently concentrated to dryness and evaluated by UV, Tandem mass spectrometry (MS/MS), 1H NMR, IR, and Raman spectroscopy analyses. UV spectra were collected using a Waters 996 photodiode array detector (Waters Corp., Milford, MA, USA). High resolution mass spectral data were acquired on a Finnigan MAT-900ST mass spectrometer (Thermo Fisher Scientific, Inc., Waltham, MA, USA) operating in the micro-electrospray ionization mode. MS/MS analysis was performed on the metabolite using direct syringe infusion electrospray ionization on the Thermo Finnigan TSQ-Quantum triple quadrupole mass spectrometer (Thermo Fisher Scientific, Inc.) in the positive-ion mode. Proton NMR spectra (1D reference and COSY) were acquired on a Varian INOVA 600 MHz NMR spectrometer (Varian, Inc., Pala Alto, CA, USA). Particles of the parent drug and metabolite were placed on gold-coated microscope slides for IR and Raman analyses. Micro-IR data were collected on a Nicolet 760 FTIR spectrometer (Thermo Fisher Scientific, Inc.) at 4/cm resolution. Micro-Raman data were collected on a Nicolet Almega Raman spectrograph at 8/cm resolution.
Results
Excretion and distribution (study 1)
Combustion of matrix standards showed that recovery efficiencies for 14C were in excess of 98%. A limit of reliable determination of 30 dpm above background was used, resulting in a lower limit of quantitation of 22 ng-equivalents/mL (ng-eq/mL) of toceranib in plasma (based on a 0.1 mL sample) and 11 ng-eq/g of toceranib in whole blood or tissue (based on a 0.2 g sample).
Excretion data are presented in Fig. 2. Following a single oral administration of [14C]-toceranib, the majority of the administered radioactivity was excreted via the feces accounting for a mean ± SD of 91.8 ± 5.3% of the administered drug by day 7. The fecal recovery from individual dogs ranged from 90.4% to 96.4% with the exception of a single dog at 79.9%. This was the only dog with total recovery below 97%. Urinary excretion, cage wash, and carcass accounted for mean ± SD of 7.2 ± 1.5%, 0.5 ± 0.3%, and 2.1 ± 0.5% of the total dose, respectively.
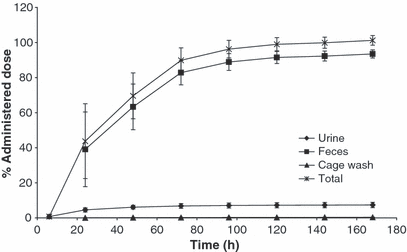
Mean (±SD) cumulative excretion of total radioactivity following a single oral administration of [14C]-toceranib to male and female dogs (Study 1).
Plasma concentration data are shown in Fig. 3. Following a single oral administration of [14C]-toceranib to male and female dogs, highest concentrations of total radioactivity in plasma were typically noted at 4 h, with concentrations ranging from 78 to 164 ng-eq/mL with a mean ± SD of 112 ± 31 ng-eq/mL. The mean concentration of total radioactivity then decreased slowly to 79 ng-eq/mL at 12 h postdose. The mean concentration of total radioactivity in plasma fell to below the limit of quantitation (22 ng-eq/mL) in males and females at 24 h and 32 h postdose, respectively. The mean Area under the plasma drug concentration–time curve from time 0 to the last measurable concentration (AUC0-t(last)) was 3200 ng-eq·h/mL and the mean t1/2 for total radioactivity was 13.5 h.
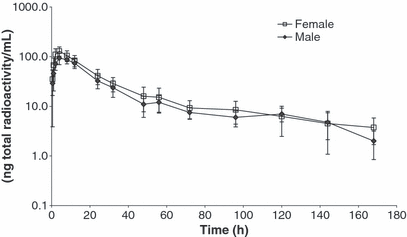
Mean (±SD) concentration of total radioactivity in plasma following a single oral administration of [14C]-toceranib to male and female dogs.
The concentrations of total radioactivity in tissues at 168 h after a single oral administration of [14C]-toceranib to male and female dogs at a target dose of 3.25 mg/kg are shown in Table 1. Several tissues including blood, brain, synovial fluid, cerebrospinal fluid, renal fat, sciatic nerve, and spinal cord contained concentrations of total radioactivity below the limit of reliable measurement (approximately 11 ng-eq/g). The highest concentrations of total radioactivity were noted in the bile and liver, with mean ± SD concentrations of 1400 ± 659 ng-eq/g and 1040 ± 442 ng-eq/g, respectively. Concentrations of total radioactivity above the limit of reliable determination were also noted (in decreasing concentration) in the lymph nodes, colon, adrenals, bone marrow, kidneys, lungs, spleen, pancreas, and skin. Other tissues shown in Table 1 had measurable concentrations below 50 ng-eq/g.
Plasma protein binding (study 2)
Preliminary experiments to determine stability, nonspecific binding, and time to equilibrium were performed at two concentrations, 20 and 500 ng/mL. [14C]-toceranib was shown to be stable in the stock solutions for up to 168 h following storage at −20 °C. The stability of toceranib in plasma at room temperature had previously been demonstrated for 48 h and was assumed to be stable at 37 °C for the duration of these experiments. The plasma protein binding of [14C]-toceranib was found to equilibrate following 4 h of incubation at 37 °C. This equilibration time was used for all subsequent dialysis investigations. Nonspecific binding of [14C]-toceranib to the dialysis apparatus in dog plasma over the 4 h incubation ranged from 31.1% to 35.5% at the two concentrations investigated.
In vitro plasma protein binding of [14C]-toceranib in fresh dog plasma was determined at concentrations of 20, 70, 150, and 500 ng/mL, covering the range of therapeutic plasma concentrations (London et al., 2009). The protein binding ranged from 90.8% to 93.1% and was independent of concentration. Protein binding was also determined in once-frozen plasma at 91.7% to 92.8%, indicating that a single freeze/thaw cycle had no impact on the plasma protein binding of [14C]-toceranib.
Microsomal and hepatocyte incubation (study 3)
In a 2-h incubation of toceranib in pooled (male and female) canine microsomes, approximately 72% of toceranib was converted into a single metabolite. Approximately 81% of toceranib was converted to the metabolite in pooled female dog microsomes vs. 56% in pooled male dog microsomes. However, because pooled microsomes were prepared from a small number of animals, this numeric difference was not considered meaningful.
Toceranib exists as the thermodynamically stable Z-isomer when protected from light. While stable as solid drug and in many aqueous solutions and suspensions, it readily undergoes photoisomerization in some types of solutions when exposed to light (data not shown). For example, toceranib in a 50% acetonitrile solution at 50 ng/mL converts from 100% of the Z-isomer to approximately 25% of the E-isomer within 1 h of exposure to ambient laboratory light. Depending upon the solution conditions, equilibrium is established in this timeframe, with the E-isomer representing approximately 25 to 50% of the isomer mixture. This reaction is reversible upon removing the light source and storing in the dark; however, complete reversion to the thermodynamically-favored Z-form takes more than 10 h.
The photoisomerization characteristics were exploited in several in vitro metabolism experiments. In microsome incubations of toceranib conducted under normal ambient laboratory lighting conditions, four distinct peaks were observed by HPLC, the Z- and E-isomers of both toceranib and its metabolite. After incubation, when these samples were returned to darkness, only two peaks were observed in chromatograms, the Z-isomers of toceranib and its metabolite.
Additional microsome incubations were conducted using preirradiated toceranib that contained a mixture of the Z- and E-isomers, with samples also exposed to light during incubation. At time 0, two distinct peaks were observed which corresponded to the Z- and E-isomers of toceranib. At various incubation times, four peaks were observed which corresponded to the Z- and E-forms for both the parent compound and its single metabolite. When samples were quenched and light was removed, the E-isomer forms of toceranib and its metabolite interconverted to the thermodynamically more stable Z-isomers. Representative chromatograms are provided in Fig. 4. Similarly, only two peaks (toceranib and its metabolite) were observed in chromatograms when microsome incubations and all sample preparation steps were conducted in a darkened laboratory (data not shown).
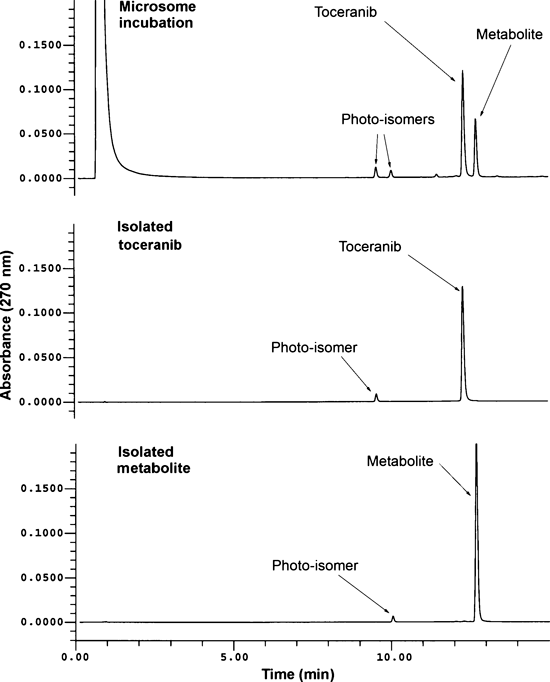
Representative chromatograms: scaled-up pooled dog microsomal incubation, isolated toceranib, and metabolite.
No Phase II metabolism was observed in dog hepatocytes.
Metabolite isolation and identification (study 3)
Observations from the in vitro metabolism experiments (with and without light exposure) and the collective spectroscopic data were utilized to elucidate the structure of the metabolite isolated from dog microsome preparations.
The ultraviolet spectrum of the metabolite was the same as that for toceranib with the UV maximum for both compounds at 430 nm. Based upon the similar photoisomerization characteristics and similarities in the UV spectra for toceranib and its metabolite, we interpret that the extensive conjugation pattern throughout the molecule remained intact upon formation of the metabolite. Further, these data supported the interpretation that the methylene group between the pyrrole and 2-oxoindoline rings was not modified in the metabolite, which is consistent with this region of the parent molecule being somewhat sterically hindered.
Mass spectrometric analysis of the metabolite yielded a molecular weight of 412. A product ion scan from m /z 413 (M + 1) of the metabolite, shown in Fig. 5, shows fragments at m/z 326, 283, 157, and 113. These fragments are identified in the structure of toceranib N-oxide shown in Fig. 1. An accurate mass (resolution 6600) for the metabolite was determined to be 412.19142 Daltons, with a standard deviation of 0.00065 Daltons from ten measurements. The experimental mass differed by 0.9 ppm from the theoretical mass of the empirical formula of the structure, C22H25N4O3F, consistent with the addition of an oxygen to the parent drug. The accurate mass (resolution 6500) of a major fragment ion was also peak matched. The mass was measured as 326.12984 Daltons with a standard deviation of 0.00162 Daltons from ten measurements. The experimental mass differed by −2.0 ppm from the theoretical mass of the empirical formula of C18H17N3O2F, which matched the m/z 326 fragment determined by LC-MS and consistent with the loss of the pyrrolidine ring and an oxygen. This implied that the addition of oxygen was in the pyrrolidine ring. Other mass spectral fragments from unit resolution LC/MS of 283, 157, and 113 Daltons were observed and have been assigned as shown in Fig. 1.
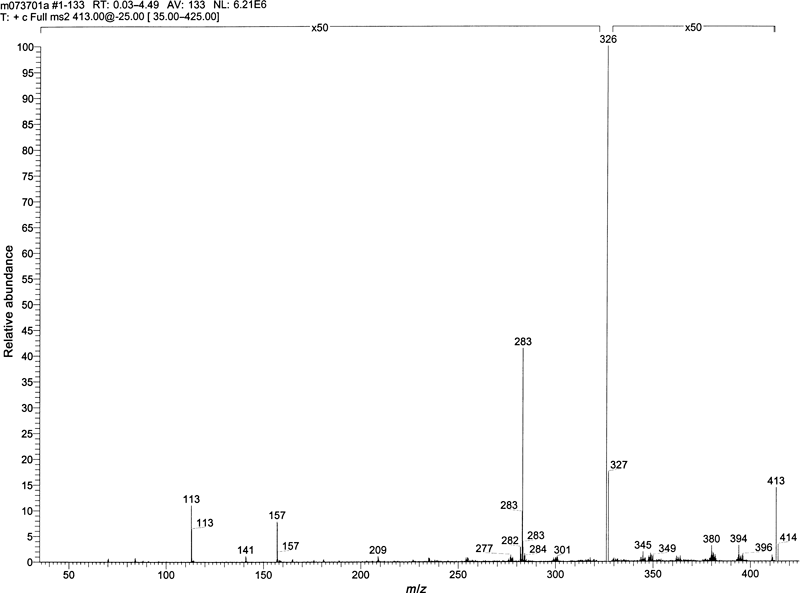
Product-ion mass spectrum of N-Oxide metabolite of toceranib.
The NMR data collected for the sample allowed complete assignment of all proton and protonated carbon resonances. The data indicated that the carbon skeleton of the analyte was intact with respect to the parent compound. No significant changes were observed in the aromatic region compared to model compounds, and the aliphatic methylene resonances were observed intact. The chemical shift of the methylene groups α to the pyrrolidine nitrogen atom was observed somewhat downfield from those of the parent compound implying lower electron density at that site.
The vibrational data for the parent compound and metabolite were very similar. Both Raman and IR data of the metabolite exhibited a peak at 1388/cm that was not observed for toceranib. This frequency is consistent with the N-O stretch observed in N-oxides. Thus, the proposed structure for this metabolite is the N-oxide of toceranib (Fig. 1).
Discussion
The primary goal of the studies presented here was to characterize the disposition of toceranib in the dog. Following oral administration of [14C]-toceranib, the majority of the administered radioactivity (92%) was excreted via the feces. Renal clearance accounted for a small portion (approximately 7%) of the total clearance of toceranib. Radioactivity detected in the fluids and tissues collected 168 h after a single oral dose is provided in Table 1. High concentrations in bile and liver suggest that hepatobiliary elimination is an important route of excretion, which is consistent with the large portion of the drug-related material eliminated in the feces. The remaining tissue data indicate that [14C]-toceranib was well distributed throughout the body from the central compartment following oral administration into numerous tissues, where it remained at detectable concentrations for more than 168 h after a single dose. This widespread distribution of radioactivity is consistent with the high apparent volume of distribution at steady-state, 30 L/kg (Yancey et al., 2009), and the high protein binding of 91–93%.
The concentration–time profile of total radioactivity in plasma after oral dosing was characterized by broad, sustained exposure with quantifiable concentrations for 24 h after dosing. Although the plasma levels of radioactivity were below the limit of quantitation, radioactivity in plasma was detectable for the entire 168-h period following dosing, indicating that radioactivity was likely sequestered in the body and slowly eliminated. Exploratory oral PK studies using various solution and tablet formulations demonstrated similar rates of absorption and oral bioavailability indicating that the oral pharmacokinetics of toceranib are not sensitive to drug formulations such as the solution formulation used for this radiolabel study (data not shown).
Plasma was not profiled to quantify concentrations of parent toceranib and confirm the presence of the N-oxide or other potential metabolites in the distribution and excretion study (Study 1). However, due to the similarity of the profile based on total radioactivity to that of the parent drug from other PK studies, it is inferred that the total drug-related material in circulation is predominantly parent drug. Based upon the in vitro data, we presume the predominant metabolite produced in vivo is also the N-oxide; however, its presence has not been verified from in vivo samples. If formed, it may be present at relatively low abundance; however, we recognize that any metabolite may be rapidly cleared from circulation. Although we have no direct data for activity, N-oxides are frequently less active than the parent compounds.
The high rate of fecal excretion and the long elimination half-life of toceranib are indicative of enterohepatic recirculation of the parent compound and/or of metabolites. While glucuronides are often found to undergo recirculation, no phase II metabolism has been observed for toceranib. However, the N-oxide metabolite may also be excreted in bile and subsequently reabsorbed. It has been documented by Cashman and others that N-oxides can be reduced in the gut (Cashman, 1999; Fisher et al., 2002; Bethke et al., 2007). In either case, both the parent compound and any quantity of the N-oxide metabolite that may be formed in vivo are candidates for enterohepatic recirculation. Although enterohepatic recycling is often accompanied with a second peak after the initial absorption phase in the plasma concentration vs. time profile, this phenomenon was subtle in the plasma profiles from the radiolabeled ADME study. The only dogs that have shown this second peak were the fasted dogs from a fed/fasted study where a small second peak corresponded with the time food was returned to the dogs. Therefore, if enterohepatic recirculation is occurring, it could be masked by the slow absorption seen for toceranib (Yancey et al., 2009). However, it has been shown that the enterohepatic recirculation has no effect on drug accumulation if the drug is dosed not more frequently than every other day.
As the N-oxide was the only metabolite of this molecule formed in dog liver microsomes and hepatocytes, the enzymes involved in its formation are likely flavin monooxygenase (FMO) or cytochromes P450. Many tertiary amines that undergo N-oxidation are metabolized by FMO. This phenomenon has been reported in both human and dog as amino acid sequences of FMO1 and FMO3 in these species are very similar (Lattard et al., 2002; Stevens et al., 2003). While these studies were conducted, the limited availability of expressed P450 or FMO dog enzymes, currently the gold standard for enzyme phenotyping, prevented a comprehensive analysis of the enzymes involved in toceranib metabolism. Furthermore, few specific inhibitors for dog drug metabolizing enzymes have been described that would enable enzyme phenotyping in liver microsomes or hepatocytes.
As polypharmacy is a frequent occurrence in managing canine oncology patients, assessing the potential for metabolic drug–drug interactions is important. Some inferences can be prepared regarding potential for interactions, although no direct data have been generated. First, FMO is not typically induced or readily inhibited. Secondly, potential adverse drug–drug interactions are minimal for drugs prominently metabolized by FMO (Cashman, 2005). Drug–drug interactions occurring via P450 metabolism are well documented, but few veterinary drugs have been thoroughly assessed for their interaction potential at the enzyme level. As a result of this, it is the authors’ opinion that it is not yet feasible to speculate on P450 interactions in vivo based on liver microsome data that have assumed that P450 substrates and inhibitors in humans have the same specificity in dogs. Furthermore, the pharmacogenetics and expression variability of FMO and P450 activities have typically been limited to beagles and the effects of these pharmacogenetic differences are not fully understood (Blaisdell et al., 1998; Roussel et al., 1998; Paulson et al., 1999; Hay Kraus et al., 2000; Kamimura, 2006).
The high fecal excretion of toceranib and associated residues may also indicate the potential for drug transporter-mediated drug–drug interactions, if in fact, any active transport of toceranib occurs. The way in which other drugs would presumably interact with biliary elimination of toceranib is if they were substrates for the same hepatocyte transporters expressed in the canalicular membrane. Some tyrosine kinase inhibitors targeting epidermal growth factor receptors are drug transporter substrates and inhibitors (Lemos et al., 2008), but it is not known if toceranib is a substrate or inhibitor of other liver transporters responsible for biliary drug excretion such as MRP-2, BCRP, BSEP, or OATPs. With the exception of Pgp, little is known about the expression and activity of drug transporters in dogs, making it difficult to assess these potential interactions.
In conclusion, radioactivity associated with toceranib was extensively distributed throughout the body after a single oral dose. Seven days after a single 3.25 mg/kg oral dose, radioactivity was the highest in bile and liver, with measurable concentrations in lymph nodes, colon, adrenals, bone marrow, kidneys, lungs, spleen, pancreas, and skin. The lowest levels of radioactivity were found in brain, CSF, and synovial fluid. The primary route of elimination of toceranib residues was by the fecal route (94%) with a smaller portion eliminated in urine (7%). Approximately, 90% of the elimination was complete by 96 h after dosing. Plasma protein binding was approximately 92%. Toceranib was metabolized to a single metabolite identified as toceranib N-oxide. It is likely that toceranib may undergo enterohepatic recirculation.
Acknowledgments
The authors wish to thank D Russell, J Guido, T Thamann, and K Mills for assistance in the structural elucidation of toceranib N-oxide; M Punler and R Hoey of Charles River Laboratories, Tranent, Scotland, for their assistance with the ADME study and protein binding determinations; and Roger Martin for his assistance with the in vitro metabolism.


