Winter and summer upwelling modes and their biological importance in the California Current Ecosystem
Abstract
Analysis of monthly coastal upwelling intensities revealed two seasonal and biologically relevant upwelling ‘modes’ in the California Current Ecosystem (CCE). The first mode reflected upwelling during the summer months and was characterized by low-frequency (multidecadal) processes, including significant (P<0.01) linear trends at some latitudes. In contrast, the second mode reflected wintertime upwelling and was defined by higher-frequency variability associated with the North Pacific High and El Niño Southern Oscillation events. These modes were compared with multidecadal time series of splitnose rockfish (Sebastes diploproa) otolith growth, yelloweye rockfish (S. ruberrimus) otolith growth, Chinook salmon (Oncorhynchus tshawytscha) scale growth, and indices of Cassin's auklet (Ptychoramphus aleuticus) and common murre (Uria aalge) reproduction in the central-northern CCE. In redundancy and correlation analyses, salmon growth and Cassin's auklet fledgling success associated with the summer upwelling mode while all other time series associated with the winter upwelling mode, indicating that CCE biology was differentially sensitive to these seasonal upwelling patterns. Thus, upwelling occurred in unrelated seasonal modes with contrasting trends, atmospheric forcing mechanisms, and impacts on the biology of the CCE, underscoring the importance of seasonality when evaluating ecosystem response to climate variability and change.
Introduction
By charging the photic zone with deep, nutrient-rich water, coastal upwelling supports some of the most productive and economically valuable marine ecosystems in the world. One of the most important of these is the California Current Ecosystem (CCE), spanning more than 2000 km along the west coast of North America. Here, the bottom-up influences of upwelling are critical to ecosystem structure and function and have been documented across a wide range of trophic levels including mesozooplankton (Roemmich & McGowan, 1995; Dorman et al., 2005; Hooff & Peterson, 2006), benthic crustaceans (Shanks & Roegner, 2007), demersal fish (Field et al., 2007; Black et al., 2008), pelagic fish (Schirripa & Colbert, 2006), seabirds (Miller & Sydeman, 2004; Schroeder et al., 2009), and mammals (Sydeman & Allen, 1999), among others.
Forced by seasonal variations in along-shore winds, CCE upwelling is generally lowest during the winter and increases to peak levels during the late spring and summer months (Bograd et al., 2009). This pattern has led to the general acceptance of a March through August ‘upwelling season’ (Garcia-Reyes & Largier, 2010), to which productivity of CCE communities traditionally has been associated (e.g., Wells et al., 2008). Yet upwelling during other times of the year may also strongly influence ecosystem dynamics, and an increasing number of studies have indicated that the winter may be particularly important. For example, climate in the winter months has been linked to year-class strength in an array of groundfish species (Hollowed & Wooster, 1992). Logerwell et al. (2003) noted the importance of wintertime climate to coho salmon (Oncorhynchus kisutch) marine survival along the Oregon coast. Farther south along the California coast, seabird reproductive success and Pacific rockfish (Sebastes spp.) otolith growth-increment chronologies were more closely related to ocean conditions in February and March than any other month of the year (Schroeder et al., 2009; Black et al., 2010).
The fact that some CCE biological processes relate to climate variability in the winter while others appear to relate to climate variability in the summer suggests that upwelling occurs in distinct seasonal ‘modes’ to which biological components of the CCE are differentially sensitive. To test this hypothesis, we (1) used principal components analysis (PCA) to describe the dominant seasonal structure (or modes) in 64-year records of monthly upwelling indices (UIs) between 33 and 45°N latitude and (2) verified biological relevance by relating these upwelling modes to a diverse array of multidecadal rockfish, salmon, and seabird biological time series. Given concerns about possible shifts in the location, strength, and timing of upwelling-favorable winds as a consequence of global warming (Bakun, 1990; Bakun et al., 2010; Perez et al., 2010), we also (3) investigated differences in the atmospheric mechanisms forcing seasonal upwelling modes and (4) tested for the presence of long-term trends. In so doing, we describe winter and summer upwelling modes that vary independently of one another, are biologically relevant, and underscore the importance of seasonality when assessing the impacts of climate variability and change.
Materials and methods
UIs and forcing mechanisms
The coastal UI represents the magnitude of the offshore component of Ekman transport in which positive values indicate upwelling while negative values indicate downwelling. Monthly UI values were obtained through NOAA at http://www.pfeg.noaa.gov/ for five stations in the CCE separated by 3° latitude (33°N, 119°W; 36°N, 122°W; 39°N, 125°W; 42°N, 125°W; and 45°N, 125°W), all of which spanned the 64-year period from 1946 through 2009 (Bakun, 1973; Schwing et al., 1996). UIs were arranged into a 60-month (five stations; 12 months each) × 64-year matrix. Each column was normalized to a mean of 0 and SD of 1, and the matrix was subjected to a PCA. In addition to this ‘coastwide’ analysis, the PCA was repeated at each of the five upwelling stations using 12-month × 64-year matrices. Of particular interest was the upwelling station at 39°N, the approximate location of the biological time series used in this study.
To explore forcing mechanisms, Spearman's rank correlation was used to relate seasonal upwelling modes to monthly values of gridded NCEP/NCAR Reanalysis sea level pressure (years 1948–2009), available through NOAA at http://www.esrl.noaa.gov/psd/data/reanalysis/reanalysis.shtml. Correlation and linear regression were also used to relate upwelling modes to two additional climate indicators. The first of these was an index of the North Pacific High (NPH), calculated as mean NCEP/NCAR Reanalysis sea level pressure between 20 to 45°N and 150 to 120°W. The second indicator was the Northern Oscillation Index (NOI), which reflected El Niño Southern Oscillation influences on the northeast Pacific and was calculated as the difference in sea level pressure anomalies between the NPH (35°N, 130°W) and Darwin, Australia (10°S, 130°E) (Schwing et al., 2002b).
Biological time series
Leading principal components from the upwelling data were compared to seven biological time series: (1) and (2) average annual egg-laying date for the planktivorous seabird, Cassin's auklet (Ptychoramphus aleuticus), and the omnivorous seabird, common murre (Uria aalge) (data from Schroeder et al., 2009), (3) and (4) annual breeding success (offspring per pair) for the auklet and the murre (data from Sydeman et al., 2009), (5) and (6) annual otolith-based growth chronologies for the planktivorous splitnose (Sebastes diploproa) and piscivorous yelloweye rockfish (S. ruberrimus) (data from Black et al., 2008, 2009, updated), and (7) a Chinook salmon (Oncorhynchus tshawytscha) chronology developed from scale growth-increment widths (data from Wells et al., 2007). These time series were chosen because they (1) overlapped temporally and spatially, (2) were multidecadal in length, (3) were exactly dated, (4) represented a range of contrasting biological responses across multiple trophic levels and habitats, and (5) captured a biological response specific to each calendar year in the time series.
For seabirds, timing of breeding and breeding success have been monitored at Southeast Farallon Island (∼48 km west of San Francisco Bay; 37.7°N, 123.0°W) by Point Reyes Bird Observatory under contract with the US Fish and Wildlife Service since 1971 (Ainley et al., 1995; Sydeman et al., 2001; Schroeder et al., 2009). Briefly, dates of egg laying (as a proxy for timing of breeding) and breeding success were noted for a focal sample of reproductive pairs (n=∼40 year−1 for auklets and n=∼200 year−1 for murres). Dates of egg laying, accurate to ±5 days, were averaged to estimate annual timing of breeding each year. As each of these species lays only one egg per clutch, breeding success was defined as the proportion of pairs successfully rearing a chick to independence (for auklets), or to ‘jumping’ stage (for murres). Reproductive success was therefore binary, fledged or failed (0 or 1) (Sydeman, 1999).
A yelloweye rockfish (Black et al., 2008) and a splitnose rockfish (Black et al., 2009) growth-increment chronology had been developed in earlier studies using standard dendrochronology (tree-ring analysis) techniques. Otoliths were obtained by commercial vessels, sport fishing vessels, and NOAA National Marine Fisheries Service surveys between approximately 35°N and 39°N. The yelloweye rockfish chronology spanned 1948 through 2003; however, the existing splitnose rockfish chronology was truncated at 1995 due to a limitation of more recent samples. In this study, splitnose rockfish otoliths collected between 2006 and 2008 were used to extend the chronology through 2006, maximizing overlap with other biological and physical time series.
For both rockfish species, otoliths were embedded in resin, mounted on a lapidary saw, and thin-sectioned through the dorsal–ventral axis to 0.4 mm in thickness. Otolith thin sections were polished with 2000-grit sandpaper and 10 μm lapping film to reveal the annual increments. Within each species, samples were visually crossdated to ensure that all annual growth increments were assigned the correct calendar year of formation. Universally applied in tree-ring studies, crossdating was based on the assumption that some aspect of climate limited growth and varied over time, inducing synchronous patterns in the growth-increment widths of individuals within the study region. Crossdating was accomplished by matching these synchronous growth patterns among otoliths, beginning at the outermost increment that formed at the known year of capture and proceeding toward the center. If an annual increment had been missed or falsely added, the synchronous growth pattern would be offset by a year relative to that in the other samples, and the point where the offset began indicated the location of the error. At no time was crossdating ‘forced’ on an otolith. Changes in dating were only made when the missed or falsely added increment was obvious upon reinspection of the specimen. Without crossdating, errors could have accumulated and diminished accuracy, especially in early portions of a chronology.
After visual crossdating, the dorsal half of the otolith was then photographed and the annual increment widths measured continuously from the margin to as close to the focus as possible using the program imagepro plus v. 6.0 (Black et al., 2008). Crossdating was statistically verified with the Dendrochronology Program Library program cofecha (Holmes, 1983; Grissino-Mayer, 2001). Each otolith measurement time series was then fit with a negative exponential function and divided by the values predicted, thereby removing age-related growth declines and standardizing each time series to a mean of 1. Within each species, these detrended time series were averaged with respect to calendar year to form the master chronology. A value >1 represented above-average growth while a value <1 represented below-average growth. All chronology development was conducted using the program ARSTAN (developed by Ed Cook and Paul Krusic; available at http://www.ldeo.columbia.edu/res/fac/trl/public/publicSoftware.html). The quality of each chronology was quantified using the expressed population signal (EPS) statistic, which described how well the sample mean represents the mean of the theoretical population from which it was drawn (Wigley et al., 1984). Although there is no significant threshold for this statistic, an EPS value of 0.85 or greater is considered adequate, and only those portions of the chronology that exceeded this value were retained. A total of 72 otoliths were used to develop the updated splitnose rockfish master chronology, which spanned a continuous 71-year interval from 1936 through 2006. Twenty-seven otoliths were used to develop the yelloweye rockfish master chronology, which spanned 1948–2003 (Black et al., 2008).
A Chinook salmon chronology was developed using scale growth-increment widths measured by Wells et al. (2007). Briefly, scales were collected from all returning females at Mill Creek, a tributary of Smith River in northern California, between 1981 and 2002 (n=613). Scales were cleaned and mounted between glass slides. Annual growth increments were measured from the origin along a line oriented at 20° relative to the maximum scale length (Wells et al., 2003, 2007). A portion of year 1 was spent in freshwater, though the majority of growth in this first increment would have been formed at sea, where the fish remained until returning to spawn in Mill Creek during the year of capture (Wells et al., 2007).
In the first step of chronology development, growth-increment widths were grouped according to fish age at the time of growth-increment formation. Only completely formed growth increments were retained. The oldest salmon were captured during the fifth year of life; therefore, growth increments were formed from ages 1 through a maximum of 4. Within each of these four classes, growth-increment widths were normalized to a mean of 0 and SD of 1. Finally, all normalized growth-increment widths (n=1729) were averaged with respect to calendar year of formation to generate the final salmon chronology. Only those calendar years for which there were at least 20 normalized increment widths were retained (1978–2001). As a check of consistency, a separate chronology was developed for each of the four age classes, and these four chronologies were correlated with one another. All correlations were positive and highly significant (P<0.01) with the only exceptions of year 1 vs. year 4 (r=0.40; P=0.08), indicating coherence in growth patterns across the four age classes.
All seven biological time series as well as the two upwelling principal components from 39°N were entered into redundancy analysis (RDA) to explore relationships between biology and climate. Next, the seven biological time series were entered into a PCA to establish their interrelationships in a procedure unconstrained by the upwelling modes. Before these analyses, all nine time series were normalized to a mean of 0 and SD of 1 over the shared 1978–2001 period. All time series were also checked to ensure that they did not contain significant (α<0.05) autocorrelation or linear trends over this 24-year common interval.
Biological time series were then correlated with (1) the two leading coastwide upwelling principal components (calculated for all five stations between 33 and 45°N), and then (2) the two leading upwelling principal components calculated at 39°N, the upwelling station nearest the biological time series. Spearman's rank correlations were used due to the nonlinear relationships between some variables. Correlations were not limited to the 1978–2001 common interval used in the RDA, but instead were performed over as many years as possible. Over these longer time periods, a significant (P<0.05) linear trend was present in the leading upwelling principal component at 39°N. To prevent spuriously high correlations, this trend was removed by fitting the time series with a linear regression and dividing the observed time series values by the predicted values.
Results
Upwelling modes
In the coastwide PCA, monthly UIs grouped with respect to season and showed a strong contrast between winter and summer months (Fig. 1). The leading two upwelling principal components (PC1coast and PC2coast) explained 16% and 10% of the total variance and did not contain significant (P<0.05) long-term trends, though the second principal component exhibited unusually positive values in 2007 and 2008 (Fig. 2a and b). Correlations with monthly UI data demonstrated that the principal components had highly seasonal signatures. PC1coast associated with the summer months (April through October; ‘summer mode’) while PC2coast associated with a narrower window during the winter months (January through March; ‘winter mode’) (Fig. 2c and d). Correlations with monthly UI were weakest in the northernmost latitudes of the study. The third (8.3% variance explained) and fourth (7.3% variance explained) principal components did not show a clear seasonality, did not consistently relate to biological time series (data not shown), and were therefore dropped from further analysis.
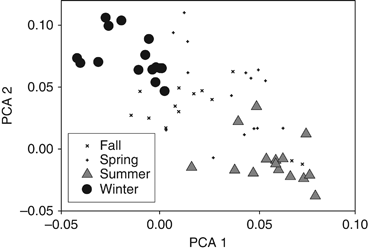
Principal components analysis scores for monthly upwelling intensity data in the California Current Ecosystem. The analysis included five locations between 33 and 45°N latitude, with a total of 60 variables (12 months per year, per site). Data were divided by season: winter (January –March), spring (April–June), summer (July–September), and fall (October–December).
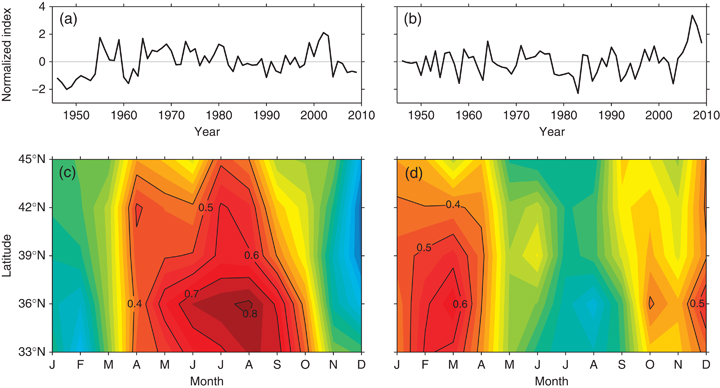
(a) The leading principal component (PC1) extracted from monthly upwelling intensity data in the California Current Ecosystem. The analysis included five locations between 33 and 45°N latitude, with a total of 60 variables (12 months per year, per site). (b) The second PC. (c) Spearman's correlations (loadings) between PC1 and the monthly upwelling intensity data. (d) Spearman's correlations between PC2 and monthly upwelling intensity data.
When PCA was repeated for each of the five upwelling stations, variance explained by the leading two components was considerably higher than in the full coastwide analysis (Table 1A, B). At all latitudes, the leading principal component correlated with summertime upwelling while the secondary component correlated with wintertime upwelling (Table 1A, B). For example, the leading principal component at 39°N (PC139N) closely tracked summer upwelling while the second component (PC239N) closely tracked winter upwelling, but not vice versa (Fig. 3). PC239N was characterized by high-frequency variability and unusually positive values in 2007 and 2008, as was observed in the coastwide analysis (2, 3). The apparently orthogonal relationship between wintertime and summertime upwelling was not an artifact of PCA. Mean wintertime (January, February, March) and mean summertime (June, July, August) upwelling were not significantly related and had correlation coefficients that closely approached zero at all latitudes (Table 1C).
| Latitude | EV* | % var† | Linear trends | Correlation (Sρ) | ||||
|---|---|---|---|---|---|---|---|---|
| R 2 | Slope | P | Winter | Summer | NOI (P) | |||
| (A) Upwelling PC1 | ||||||||
| 33°N | 4.08 | 34 | 0.00 | 0.00 | 0.74 | 0.06 | 0.95 | 0.07 (0.61) |
| 36°N | 3.61 | 30 | 0.02 | 0.01 | 0.33 | −0.11 | 0.95 | −0.04 (0.74) |
| 39°N | 3.03 | 25 | 0.30 | 0.03 | <0.001 | 0.10 | 0.92 | 0.05 (0.71) |
| 42°N | 2.88 | 24 | 0.19 | 0.02 | <0.001 | −0.02 | 0.93 | −0.01 (0.95) |
| 45°N | 1.74 | 15 | 0.01 | 0.01 | 0.48 | 0.36 | 0.73 | −0.08 (0.53) |
| (B) Upwelling PC2 | ||||||||
| 33°N | 2.22 | 19 | 0.02 | 0.01 | 0.31 | 0.77 | −0.15 | 0.52 (<0.001) |
| 36°N | 2.24 | 19 | 0.07 | 0.01 | 0.03 | 0.82 | −0.01 | 0.60 (<0.001) |
| 39°N | 1.71 | 14 | 0.00 | 0.00 | 0.72 | 0.92 | −0.14 | 0.62 (<0.001) |
| 42°N | 1.87 | 16 | 0.02 | −0.01 | 0.32 | 0.89 | 0.01 | 0.36 (<0.001) |
| 45°N | 1.68 | 14 | 0.06 | −0.01 | 0.06 | 0.75 | −0.41 | 0.19 (0.13) |
| Latitude | Sρ |
|---|---|
| (C) Winter, summer correlation | |
| 33°N | −0.02 |
| 36°N | −0.08 |
| 39°N | 0.02 |
| 42°N | −0.01 |
| 45°N | −0.01 |
- *Eigenvalue of the principal component.
- †Percent variance explained by the eigenvalue.
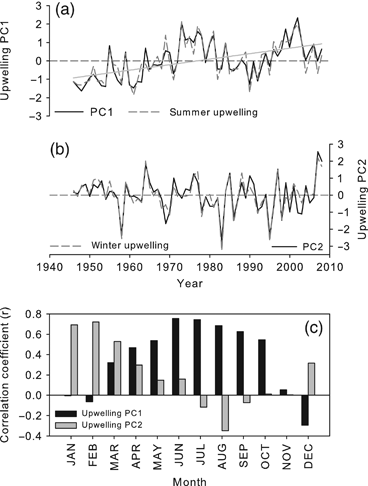
(a) The leading principal component (PC1) extracted from monthly averaged upwelling intensity data at 39°N. Mean summer (June–August) upwelling at 39°N latitude is superimposed, as is a linear regression fit to PC1 (R2=0.27). Upwelling data and upwelling principal components were normalized to a mean of 0 and SD of 1. (b) The second principal component (PC2) of upwelling at 39°N latitude. Normalized mean winter (January –March) upwelling intensity at 39°N is also shown. (c) Spearman's correlations (loadings) between the leading two principal components and monthly upwelling intensity data used to generate the principal components.
The analysis at 39°N also illustrated important latitude-specific differences in the modes. In particular, PC139N showed a strong linear increase (R2=0.27; P<0.001) as did the leading principal component at 42°N (P<0.001) (Table 1A). A weakly significant trend also occurred in the second (winter) upwelling component at 36°N, but was driven by anomalously positive values in 2007 and 2008 (Table 1B). The R2 of the regression dropped to 0.02 (P=0.32) if these 2 years were removed. No other upwelling mode contained a significant linear trend; this pattern was restricted to the summer mode in the central portion of the study region.
Atmospheric forcing
PC2coast strongly and positively correlated with wintertime (January, February, March) sea level pressure between western North America and Hawaii, the location of the NPH (Fig. 4a). Indeed, the relationship between NPH and wintertime upwelling at 39°N was particularly strong (R2=0.71, P<0.0001) (Fig. 4b). In addition to the NPH, PC2coast also correlated with sea level pressure in the southwestern Pacific (Fig. 4a). Given that the NOI was calculated as the difference between the NPH and sea level pressure in Darwin, Australia, it also related quite strongly to wintertime upwelling at 39°N (R2=0.71, P<0.0001) (Fig. 4b). The relationship between PC2coast and wintertime NOI was somewhat weaker, yet highly significant (linear regression R2=0.48, P<0.0001), comparable to the relationship between PC2coast and wintertime NPH (linear regression R2=0.48, P<0.0001). PC1coast (data not shown) and summertime upwelling at all latitudes (Table 1B) were not significantly (P<0.05) correlated to summertime NOI (data not shown), summertime NPH (data not shown), or annual NOI (Table 1B).
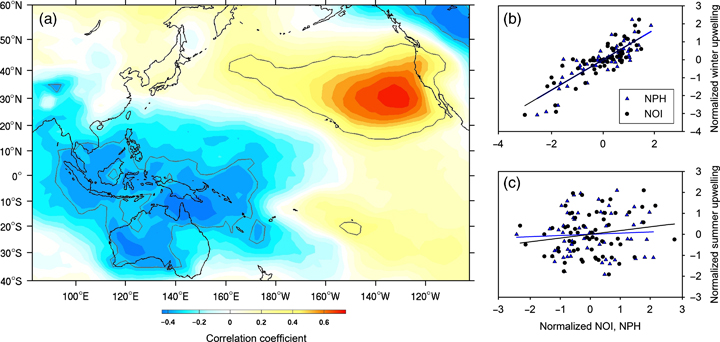
(a) Spearman's correlations between upwelling PC2 ‘winter mode’ calculated from the coastwide data set and mean wintertime (January–March) sea level pressure in the Pacific basin. Gray lines enclose regions in which correlations were significant (P<0.001). (b) The relationships between mean wintertime (January–March) upwelling at 39°N latitude and the North Pacific High (NPH). Superimposed is the relationship between winter upwelling at 39°N and the Northern Oscillation Index (NOI). (c) Relationships between summer (June–August) upwelling at 39°N latitude and the summertime NOI and NPH.
Biological relevance of upwelling modes
In a RDA of the biological time series and upwelling modes, the first axis explained 33% of the total variance and the second axis explained an additional 8%. This analysis indicated that auklet fledging success and the salmon growth-increment chronology were most closely related to PC139N (summer mode) while the other biological time series were most closely related with PC239N (winter mode) (Fig. 5a). A PCA unconstrained by environmental variables also separated auklet fledging success and the salmon growth-increment chronology from the other biological time series (Fig. 5b). The leading principal component explained 59% of the total variance and the second axis explained an additional 16%.
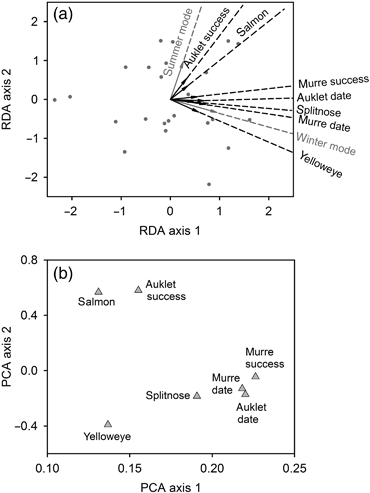
(a) Redundancy analysis biplot including the summer mode (leading principal component from monthly upwelling data) and the winter mode (the second principal component) at 39°N latitude as well as seven biological time series: a splitnose rockfish growth-increment chronology, a yelloweye rockfish growth-increment chronology, a Chinook salmon growth-increment chronology, and common murre and Cassin's auklet egg lay date and fledgling survivorship. Dotted lines are extensions of biological and physical variable vectors to enhance figure clarity. Gray dots are scores for each calendar year in the analysis: 1978–2001. (b) Scores from a principal components analysis of the seven biological time series over the 1978–2001 common interval.
Correlations between biological time series and upwelling principal components (coastwide and 39°N data sets) were consistent with the RDA results. All significant correlations involved the second principal component with the only exception of auklet reproductive success and the salmon chronology (Table 2). Although relationships were stronger and more consistent with UI data from 39°N, biological time series correlated with one or the other principal component, but not both. Correlations were such that high principal component values, which indicated above-average upwelling, were associated with early lay dates, high fledging success, and wide rockfish and salmon growth increments (Table 2).
| Biological time series | Span (years) | Coastwide | 39°N Latitude | ||||||
|---|---|---|---|---|---|---|---|---|---|
| PC1 | PC2 | PC1 | PC2 | ||||||
| Sρ | P | Sρ | P | Sρ | P | Sρ | P | ||
| Murre lay date | 1972:2006 | −0.16 | 0.37 | −0.12 | 0.49 | 0.07 | 0.66 | −0.44 | 0.007 |
| Auklet lay date | 1972:2006 | −0.31 | 0.07 | −0.36 | 0.03 | −0.21 | 0.23 | −0.52 | 0.001 |
| Murre success | 1972:2006 | 0.11 | 0.49 | 0.10 | 0.55 | −0.08 | 0.64 | 0.35 | 0.04 |
| Auklet success | 1972:2006 | 0.51 | 0.002 | −0.22 | 0.20 | 0.33 | 0.04 | −0.17 | 0.30 |
| Splitnose crn | 1946:2006 | 0.15 | 0.23 | 0.42 | 0.001 | 0.17 | 0.18 | 0.45 | 0.001 |
| Yelloweye crn | 1946:2003 | −0.04 | 0.77 | 0.21 | 0.12 | −0.07 | 0.58 | 0.34 | 0.01 |
| Salmon crn | 1978:2001 | 0.54 | 0.006 | 0.25 | 0.23 | 0.32 | 0.12 | 0.23 | 0.26 |
- Biological time series are mean annual lay date and fledgling success for common murre and Cassin's auklet, otolith growth-increment chronologies for yelloweye and splitnose rockfish, and a scale growth-increment chronology for Chinook salmon. Upwelling data are analyzed for two spatial scales: 39°N as well as coastwide, compiled between 33 and 45°N. The leading principal component (PC1) of upwelling data is ‘summer mode’ while the secondary (PC2) is ‘winter mode.’ Correlations significant at the P<0.05 level are given in bold.
Discussion
These analyses demonstrated that CCE upwelling contained two distinct and unrelated seasonal modes specific to the winter and the summer months. A particularly defining characteristic of the summer mode was that it exhibited significant linear increases in the central portion of the study region. This was consistent with previous reports of spring and summertime upwelling intensification in the same area of the CCE (Schwing & Mendelssohn, 1997), a pattern recently corroborated by long-term trends in buoy-based wind and SST data at 39°N (Garcia-Reyes & Largier, 2010). In comparison, the winter mode contained anomalously positive values in 2007 and 2008, which indicated unusually strong January through March upwelling in these 2 years. Yet, there was no evidence at any latitude of long-term, linear trends, underscoring the fact that intensification signals were restricted to the summer months.
Winter mode upwelling was closely tied to wintertime sea level pressure and ENSO activity, as indicated by strong relationships with the NOI and NPH. Consistent with this, winter-mode upwelling significantly correlated with wintertime sea surface temperatures not only along the western coast of the United States, but also across a broad extent of the tropical Pacific (Fig. S1). By contrast, summer mode upwelling did not correlate with summer (or even winter) sea level pressure or temperature variables used in this study. Instead, these summer upwelling processes may have been linked to much more local climate drivers, including fine-scale gradients in cross-shore pressure or temperature (Schwing et al., 2002a). The fact that winter upwelling correlated with synoptic-scale pressure and temperature variables while summer did not suggested that the two modes were forced by contrasting atmospheric mechanisms, which could account for such dramatic differences between winter and summer upwelling on high- and low-frequency domains.
A unique aspect of this study was that it integrated a diverse set of biological time series spanning a range of species, life histories, habitats, and trophic levels. Central to this comparative approach was the development of otolith and scale chronologies, which served as continuous, annually resolved proxies of fish growth. Indeed, past studies have demonstrated relationships between salmon body size and scale growth-increment width as well as relationships among rockfish otolith growth-increment width, indices of CCE productivity, and levels of fish visceral fat (Lenarz & Echeverria, 1986; Woodbury, 1999; Thompson & Hannah, 2010). In combination, these chronologies, seabird lay dates, and records of seabird fledgling success independently corroborated the importance of upwelling modes on the biology of the CCE, and did so over timescales that spanned multiple decades.
Of the seven biological time series considered in this study, the growth-increment chronology generated from Smith River Chinook salmon was one of the two that significantly related to the summer mode, consistent with Wells et al. (2008) who found that spring and summer upwelling was important to scale growth-increment width in this largely piscivorous species (Daly et al., 2009). Summer upwelling was also strongly related to auklet fledgling success and may have maintained a constant and/or adequate prey base for this planktivorous seabird across its extended reproductive season, which in some years can span from March through September (Abraham & Sydeman, 2004). Upwelling throughout the reproductive period could have facilitated a second reproductive attempt following a successful first attempt. Average reproductive success >1 chick pair−1 did occur in extremely favorable years (e.g., 2002) and may have played a critical role in driving the relationship between upwelling and seabird productivity (Abraham & Sydeman, 2006) (Fig. 6e). By contrast, the 2 years in which auklet fledgling success fell to zero (2005 and 2006) were not accompanied by unusually low levels of summer upwelling, indicating that other physical or biological factors must have contributed to these reproductive failures. Notably, no trends were apparent in these summer-sensitive biological time series despite significant increases in summer upwelling between 39 and 42°N. However, salmon and auklet fledgling success were most closely related to the coastwide summer upwelling mode, which itself lacked long-term trends. Moreover, the intervals spanned by summer-sensitive biological time series were too short to capture intensification signals; where they did occur, such monotonic increases were only evident over the full 64-year upwelling record.
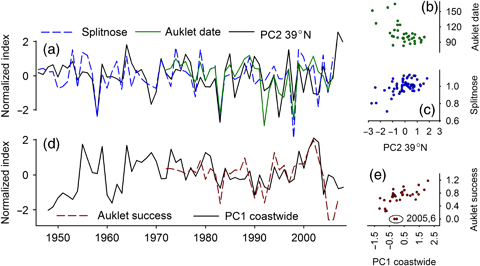
(a) Normalized time series of upwelling PC2 at 39°N (winter mode), the splitnose growth-increment chronology, and negative values of auklet lay date. Negative values of auklet lay date are shown to facilitate comparison. (b) Auklet lay date (day of year) and PC2 at 39°N, (c) the splitnose rockfish growth-increment chronology and PC2 at 39°N, and (d) and (e) auklet fledgling success and coastwide upwelling PC1. Fledgling success was 0 in 2005 and 2006.
In comparison to the summer mode, the subordinate winter mode was significantly correlated with a greater number of the biological time series included in this study. This result was consistent with Black et al. (2010) in which central CCE rockfish growth-increment chronologies and seabird lay dates related more strongly to February upwelling than indices of summer climate or the spring transition. A possible mechanism may be that the water column was weakly stratified in winter months, and that intermittent northerly winds favored by a strong NPH were sufficient to initiate upwelling during a time of the year it may not otherwise occur (Schroeder et al., 2009). Under such a scenario, these wintertime pulses could have lengthened the total growing season for rockfish and also allowed seabirds to improve prebreeding nutritional status, favoring early lay dates, high fledgling survival, and wide otolith growth increments. On broader spatial scales, this winter mode linked to the NPH may reflect a larger, coherent winter climate pattern across the northeastern Pacific region. For example, wintertime climate was associated with linkages in the growth patterns of rockfish, bivalves, and high-elevation trees from Alaska to southern California (Black et al., 2009). Even in the terrestrial ecosystem, almost a quarter (23) of the 122 tree-ring chronologies available for Oregon and California through the NOAA International Tree-Ring Data Bank (extending through at least 1990) significantly (P<0.01) correlated with wintertime NOI while only two significantly correlated with summertime NOI (data not shown).
In summary, upwelling in the CCE was characterized by two distinct seasonal modes to which biological time series were differentially sensitive. From a practical perspective these modes may afford some level of predictive power; upwelling from January through March should more closely correspond to winter-sensitive biological process while upwelling from June through August should more closely correspond to summer-sensitive biological processes. This could be relevant not only on interannual timescales, but also with respect to long-term trends associated with climate change. For example, summer upwelling has shown significant increases between 39 and 42°N and our results suggest that summer-sensitive biological processes would be most strongly affected, especially if these trends become more pronounced and occur across broader spatial scales. Likewise, frequent or severe El Niño events and related impacts on wintertime upwelling would more heavily impact winter-sensitive biological processes. The ecological impacts of any long-term changes in upwelling mean or variance have been a concern in the CCE. However, the results from this study suggest that the seasonality of climate response adds another layer of complexity, especially if one mode changes on a trajectory different from the other. The probability of such divergences between winter and summer modes and its effects on the system were beyond the scope of this study. Yet the results do demonstrate that both modes are integral to the physical and biological structure of the CCE, explain differences in patterns of biological time series from the region, and underscore the importance of considering seasonality when addressing the impacts of climate variability and change.
Acknowledgements
The seabird research was conducted and funded by PRBO Conservation Science on the Farallon National Wildlife Refuge, in collaboration with the US Fish and Wildlife Service. We thank PRBO and USFWS for data contributions to this project. Funding was provided by NOAA's Fisheries and the Environment (FATE) program and the California Ocean Protection Council and California Sea Grant under grant R/OPCENV-07 entitled ‘Tackling Climate Change and Ecological Complexity: Matches and Mismatches in the Seasonal Cycle of California's Marine Flora and Fauna’. Funding was also provided through the National Science Foundation under grant 0929017 entitled ‘Importance of winter upwelling to California Current ecosystem dynamics’. Special thanks to S. A. Thompson, J. Thayer and J. Largier for reviewing a draft of this manuscript. We also thank D. Pearson for providing the rockfish otoliths necessary to extend the splitnose rockfish growth-increment chronology.


