Impact of tropospheric ozone on the Euro-Mediterranean vegetation
Abstract
The impact of ozone (O3) on European vegetation is largely under-investigated, despite huge areas of Europe are exposed to high O3 levels and which are expected to increase in the next future. We studied the potential effects of O3 on photosynthesis and leaf area index (LAI) as well as the feedback between vegetation and atmospheric chemistry using a land surface model (ORCHIDEE) at high spatial resolution (30 km) coupled with a chemistry transport model (CHIMERE) for the whole year 2002. Our results show that the effect of tropospheric O3 on vegetation leads to a reduction in yearly gross primary production (GPP) of about 22% and a reduction in LAI of 15–20%. Larger impacts have been found during summer, when O3 reaches higher concentrations. During these months the maximum GPP decrease is up to 4 g C m−2 day−1, and the maximum LAI reduction is up to 0.7 m2 m−2. Since CHIMERE uses the LAI computed by ORCHIDEE to estimate the biogenic emissions, a LAI reduction may have severe implications on the simulated atmospheric chemistry. We found a large change in O3 precursors that however leads to small changes in tropospheric O3 concentration, while larger changes have been found for surface NO2 concentrations.
Introduction
Terrestrial ecosystem models (TEMs) have been extensively used to study the processes leading to either carbon loss or gain by land ecosystems (McGuire et al. 2001; Prentice et al. 2001). However, a factor that has received relatively little attention for its role in terrestrial carbon dynamics is tropospheric ozone (O3). Among common air pollutants, O3 is probably the most damaging to forest vegetation (Ollinger et al., 1997) frequently reaching high concentrations over large regions of the world.
When stomata are open O3 can gain access to the interior of leaves. Then it reacts with lipid and protein components of cell walls and plasma membranes, leading to formation of aldehydes, peroxides and assorted reactive oxygen species (Lindroth 2010). These products can then activate various transduction pathways for defence responses: stomatal closure, production of anti-oxidants such as ascorbate, phenolics (Lindroth 2010) and isoprenoids (Loreto et al., 2004), and programmed cell death (Fuhrer & Booker 2003; Valkama et al., 2007). Therefore, O3 can influence both ecosystem structure and functions (Heagle 1989; Heagle et al., 1999; Ashmore 2005; Muntifering et al., 2006).
Several studies have been performed in order to asses the impact of O3 on vegetation. These studies have been carried out using both models and field measurements.
Theoretical studies have been performed using several kinds of models of different complexity. Adams et al. (1989) used an integrated approach that incorporates atmospheric modeling, plant exposure–yield response studies, and economic assessment to estimate the value of crop yield lost due to atmospheric pollution in the United States. They found that over 90% of vegetation damage may be due to tropospheric O3 alone, and it could cause reductions in crop yield ranging from 0% to 30% (Adams et al., 1989; Ren et al., 2007).
In order to simulate the effects of ambient O3 on mature hardwood forests within the North-Eastern US, Ollinger et al. (1997) combined leaf-level O3 response data from independent O3 fumigation studies with a forest ecosystem model. They found a reduction in the net primary production (NPP) ranging from 3% to 16%. Felzer et al. (2004, 2005) incorporated the algorithms from Reich (1987) and Ollinger et al. (1997) for hardwoods, conifers, and crops into a biogeochemical model. Their study across the US indicated a 2.6–6.8% mean reduction in the annual NPP during the late 1980s and early 1990s. Martin et al. (2001) incorporated O3 effects on the Farquhar photosynthesis model (Farquhar et al., 1980). They found that O3 damage could reduce both protective scavenging detoxification system (Vcmax) (Farquhar et al., 1980) and light-saturated rate of electron transport (Jmax) (Farquhar et al., 1980) by the accumulated amounts of O3 above the threshold of damage entering the inner leaves (Ren et al., 2007).
In contrast, experimental studies are generally performed in situ or in laboratories by means of fumigation systems (e.g. Karnosky et al., 2001, 2007; Nunn et al., 2002, 2005; Werner & Fabian 2002; Matyssek et al., 2007, 2010a, b and therein reference). Free-air O3 fumigation studies on field-grown trees have been conducted for several years at some locations in Europe and the US (Karnosky et al., 2001, 2007; Matyssek et al., 2007; Oksanen et al., 2007). All these studies have also shown that enhanced O3 regimes have the capacity of counteracting the effects of elevated CO2 and of substantial reduction of the carbon sink strength of woody-plant systems (Matyssek et al., 2010a, b). Generally, pioneer tree species tend to be more susceptible to the O3 impact than climax species; however, the magnitude of the effect is strongly governed by the genotype, competing species life histories and ontogeny rather than by the tree species (Matyssek et al., 2010a).
Tropospheric O3 is the product of photochemical reactions of carbon monoxide (CO), methane (CH4), and other hydrocarbons in the presence of NOx (NO+NO2) (Sitch et al., 2007). Hydrocarbons are the product of fossil fuel emissions, solvent use, chemical manufacturing, and volatile organic compounds (BVOCs) emissions from vegetation (Niinemets & Penuelas 2008; Penuelas & Staudt 2010). The primary sources of NOx in the troposphere include fossil fuel combustion, as well as biomass burning, lightning, and microbial and geochemical processes in the soil (Mauzerall & Wang 2001). The production/destruction of O3 in the troposphere is therefore determined by the concentrations of NOx, CO, CH4, and nonmethane hydrocarbons (NMHCs) (Lui et al., 1987; Lin et al., 1988). O3 can also be transported into a region by local winds and downward from the stratosphere (Oltmans & Levy II 1994).
The global mean concentration of near surface O3 has been increasing during the last years and it is expected to increase significantly through the next century, although the magnitude of the increase depends on the particular emission scenario chosen (Streets & Waldhoff 2000; Prather et al., 2001; Sitch et al., 2007). The Royal Society (2008) assessed projected trends in the tropospheric O3 due to emissions and climate changes and implications for human health and vegetation. They found that mean O3 concentrations will likely increase over polluted land regions due to climatic changes, but would decline where strong precursor emission controls are put into place.
Both fossil fuel consumption and N-fertilizer application will highly contribute to total emissions of NOx and consequently result in increased atmospheric O3 concentration. The economic and social implications of widespread yield staple crops loss in regions with food supplies problems caused by rapidly increasing populations and productive land loss could be very serious (Ashmore & Marshall 1999).
In the northern hemisphere, at temperate latitudes, the contemporary daily O3 concentration range between 20 and 65 ppb (Akimoto, 2003; Vingarzan, 2004; Oltmans et al., 2006), with an average of about 40 ppb (Ehhalt et al., 2001, Wittig et al. 2009).
The IPCC projected an average global increase in background O3 concentration to approximately 68 ppb by 2050 and a further increase to 85 ppb by 2100 in the northern midlatitudes based on the A2 storyline from the Special Report on Emission Scenarios (SRES) (Ehhalt et al., 2001).
Therefore, approximately 50% of forests, grasslands and croplands might be exposed to high O3 levels by 2100 (Ren et al., 2007; Sitch et al., 2007; Wittig et al. 2009). On the other hand, the vegetation structure and activity has an impact on atmospheric chemistry through deposition of pollutants and emissions of volatile organic compounds (Guenther et al., 2006; Lathiere et al., 2006; Petroff et al., 2008). Hence, there is a strong coupling between O3 and vegetation: the first one impacts plant productivity that, in turn, can affect the atmospheric O3 concentration. Whereas the impact of atmospheric pollutants on plant productivity has been already evaluated (e.g. Ren et al., 2007), as well as the deposition of pollutants on the canopy (Petroff et al., 2008) and the role of vegetation in BVOC emissions (e.g. Guenther et al., 2006; Lathiere et al., 2006), the vegetation-atmosphere feedbacks are still under investigated.
There are several mechanisms that allow the O3–gross primary production (GPP) feedback to impact vegetation–atmosphere interactions. First, O3 stress leads to a change in stomatal conductance and can affect the dry deposition velocities, and hence the O3 concentrations in the canopy (Petroff et al., 2008), or, more generally, in the lower atmosphere. Second, a change in stomatal conductance induces changes in BVOC emissions, and it could increase or decrease the O3 concentration, depending on the NOx levels (Lathiere et al., 2006). Finally, a severe O3 stress induces a significant decrease in the GPP and, consequently, in the amount of carbon allocated in the biomass. In other words, it can lower the LAI that, in turn, affects both the BVOC emissions and the dry deposition.
All these O3–GPP feedbacks act modifying the O3 concentration in the planetary boundary layer (PBL), consequently modulating the amplitude of the O3 stress on the vegetation. Therefore, there is an urgent need to improve our knowledge on the adverse effects of O3 on terrestrial ecosystem production taking into account these potential feedbacks with atmospheric chemistry. In this work, we focus mainly on the feedbacks between GPP–LAI reduction and BVOCs emission to the overlying atmosphere, while deposition velocity changes are beyond the focus of this paper.
For such purpose, we coupled the land surface model ORCHIDEE (Krinner et al., 2005) with the chemistry transport model CHIMERE (Bessagnet et al., 2004) in order to improve our knowledge on the regional effects and related feedbacks of O3 on vegetation in the Euro-Mediterranean basin. Specifically, we attempt to quantify the GPP reduction related to the O3, and assess whether the LAI reduction related to the decreased carbon assimilation produces any significant changes in the atmospheric chemistry.
Materials and methods
Models description
The chemistry-transport model used in this work is CHIMERE (Bessagnet et al., 2004), in its version 2008b (http://www.lmd.polytechnique.fr/chimere/). CHIMERE is a three-dimensional model that simulates gas-phase chemistry (Schmidt et al., 2001), aerosol formation, transport and deposition (Bessagnet et al., 2004; Vautard et al., 2005) at regional scales.
Tropospheric photochemistry is represented using the MELCHIOR chemical mechanism (Lattuati, 1997) which describes more than 300 reactions of 80 species. The reduced mechanism MELCHIOR2, derived from MELCHIOR1, includes 44 species and about 120 reactions. Processes like chemistry, transport, vertical diffusion, photochemistry, dry deposition, in-cloud and below cloud scavenging and SO2 oxidation in clouds are included in the model. More details regarding the parameterizations of the above mentioned processes are described in Bessagnet et al. (2004) and references therein.
In this configuration CHIMERE has eight hybrid sigma pressure levels with the top at 500 hPa (about 5500 m). The model domain is projected on a normal Mercator grid covering almost all Europe (except northern Scandinavia and Iceland) and North Africa (Fig. 1). Several hourly meteorological fields required by CHIMERE, such as wind, temperature, cloud liquid water content, surface heat fluxes, cloud cover, and precipitation, are provided by the WRF model (Skamarock et al., 2005) at 30 km spatial resolution. Further details on the WRF set-up, as well as WRF validation, can be found in Anav et al. (2010).
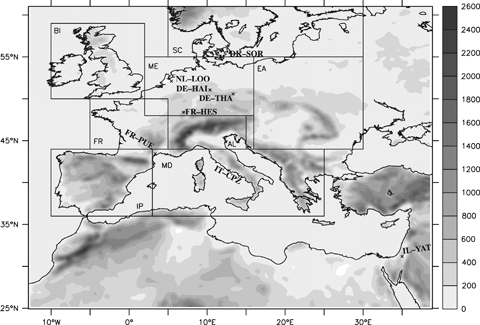
Model domain with the corresponding topography (units are in meters). The figure also shows the PRUDENCE sub-domains where some of the model diagnostics have been computed and the eight CARBOEUROPE sites used to validate the gross primary production.
The model requires hourly emissions for the main anthropogenic gas and aerosol species. For the European domain, the 1999 anthropogenic emissions data for NOx, CO, SO2, PM2.5 and PM10 are provided by EMEP (Vestreng, 2003). Hourly emissions of nitrogen oxides and eight biogenic VOC species (isoprene, α-pinene, β-pinene, myrcene, sabinene, limonene, δ3-carene, ocimene) are calculated using the MEGAN model (discussed below).
The land-surface model ORCHIDEE (ORganizing Carbon and Hydrology In Dynamic EcosystEms) is a SVAT model coupled to a biogeochemistry and a dynamic biogeography model (Krinner et al., 2005). ORCHIDEE simulates the fast feedbacks occurring between the vegetated land surface and the atmosphere, the terrestrial carbon cycle, and also changes in vegetation composition and distribution in response to climate change.
ORCHIDEE is based on three different modules (Krinner et al., 2005). The first module, called SECHIBA (Ducoudréet al., 1993), describes the fast processes such as exchanges of energy and water between the atmosphere and the biosphere, and the soil water budget. It has a 30 min time step. The phenology and carbon dynamics of the terrestrial biosphere are simulated by the STOMATE (Saclay Toulouse Orsay Model for the Analysis of Terrestrial Ecosystems) model (Krinner et al., 2005). STOMATE simulates at daily time step processes as photosynthesis, carbon allocation, litter decomposition, soil carbon dynamics, maintenance and growth respiration, and phenology. Finally the long-term processes (yearly time step), including vegetation dynamics, fires, sapling establishment, light competition, and tree mortality, are simulated according to the global vegetation model LPJ (Sitch et al., 2003).
 (1)
(1)| Vegetationtypes | α Coefficient | References |
|---|---|---|
| Crops | 3.9 × 10⁻⁶ | Reich (1987) |
| Coniferous trees | 0.7 × 10⁻⁶ | Reich (1987) |
| Deciduous trees (and other vegetation types) | 2.6 × 10⁻⁶ | Ollinger et al. (1997) |
 ). This monthly impact is computed from instantaneous O3 impact using the linear relaxation method used in ORCHIDEE to approximate long term variables (Krinner et al., 2005). Specifically, to reduce the computer memory requirements, short-term variables Xs (e.g., instantaneous O3 impact) are not kept in memory to sum them up to obtain long-term variables Xl (e.g., monthly O3 impact). Instead, long-term variables are updated at every time step (Δt) using a linear relaxation method:
 (2)
(2) (3)
(3) ) is defined as
 (4)
(4) (5)
(5) is the O3-related GPP, and GPP is the original photosynthesis calculated by ORCHIDEE.
In the following, a regional version of ORCHIDEE (Anav et al., 2010) is forced by hourly temperature, precipitation, specific humidity, wind speed, pressure, short wave and long wave incoming radiation provided by the WRF model. The model domain is projected on the same CHIMERE grid, with a spatial resolution of 30 km.
The vegetation distribution is prescribed (deactivated vegetation dynamics), while plant phenology and the carbon cycle are explicitly simulated. Therefore, the LAI will be affected by O3 exposure.
The coupling between CHIMERE and ORCHIDEE
The CHIMERE and ORCHIDEE models are coupled via the LAI and the surface O3 (Fig. 2); these variables are exchanged by the models at a daily time step.
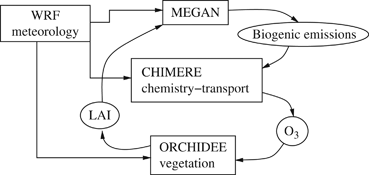
Flow chart of the CHIMERE-ORCHIDEE coupled model.
In order to account for the impact of O3 on vegetation, we used the parameterization of Felzer et al. (2004) (described above); the AOT40, required by ORCHIDEE, is directly computed from O3 concentration provided by CHIMERE model.
 (6)
(6)In the original CHIMERE version, the leaf area index (LAI) database is provided as a monthly mean product derived from MODIS observations, referred to base year 2000 (Bessagnet et al., 2009). In the coupled version CHIMERE uses the daily LAI values directly computed by ORCHIDEE to account for biogenic and NO emissions (Fig. 2).
These total ORCHIDEE daily LAI values are used in the MEGAN model to estimate the response of emissions to the temporal variations in leaf age and LAI. Four different PFTs are considered in MEGAN: broadleaf trees, needle leaf trees, shrublands and herbaceous. The emissions are calculated for each plant functional type (PFT) and then summed up to estimate the total emission for any given grid point (Guenther et al., 2006).
The LAI is not a fast-changing variable: specifically, it does not show any diurnal cycle; in the case of mature evergreen forests is almost constant year-round, while for deciduous forests it has a minimum value during winter and rises quickly with leaf-out. Therefore, the daily time step used to exchange data between the models is enough to compute biogenic and NO emissions. On the other hand, we use the hourly values of O3 computed during the CHIMERE simulation to account for the impact of O3 on vegetation.
Experimental set-up
For both models, three different simulations have been performed, covering the whole year 2002. The ORCHIDEE control run (henceforth ORC-CTL) does not account for any impact of O3 on vegetation. A short spin-up (10 years) was carried out in order to initialize the vegetation carbon and soil hydrology; this short spin-up is also enough to reach a stable LAI equilibrium.
In this ORCHIDEE set-up, the vegetation dynamic is deactivated (Krinner et al., 2005) and the vegetation distribution is prescribed according to the present land cover, while the carbon cycle is fully activated. Soil, litter, and vegetation carbon pools (including leaf mass and thus LAI) are prognostically calculated as a function of dynamic carbon allocation (Krinner et al., 2005).
The CHIMERE control simulation (henceforth CHI-CTL) uses the original MEGAN model to compute the emission of NO and biogenic VOCs from terrestrial ecosystems to the atmosphere. The LAI required in the MEGAN model is directly provided as monthly mean values from MODIS observations (Bessagnet et al., 2009).
A second CHIMERE simulation is one-way coupled to ORCHIDEE (henceforth CHI-CPL0); in this case, CHIMERE reads the LAI computed from the ORCHIDEE control run. This simulation does not account for any feedbacks owing to the inhibitory effect of O3 on photosynthesis, which might lead to changes in LAI, and thus changes in biogenic emissions [see Eqn (4)]. The expected model differences are exclusively due to the improvement from the monthly to the daily LAI.
Likewise, ORCHIDEE has been coupled one-way to CHIMERE (henceforth ORC-CPL0); in this simulation ORCHIDEE reads the O3 computed in the CHIMERE control simulation, but the resulting changes in LAI are not taken into account during the CHIMERE simulation.
Finally, a fully coupled simulation has been performed as shown in Fig. 2. In this case CHIMERE (hereafter CHI-CPL) reads the LAI from ORCHIDEE (henceforth ORC-CPL) that uses the O3 provided by CHIMERE to compute the impact on carbon assimilation.
Using both the control simulations along with the coupled simulations we evaluate the effect of the feedback between the models on vegetation and atmospheric chemistry changes.
Results
Impact of coupling on atmospheric chemistry
Since O3 drives many of the ORCHIDEE predictions, first of all we present a validation of the O3 simulated by CHIMERE against some measurements at four EMEP sites (http://www.emep.int) spread across Europe. The main features of the stations used in this study to validate CHIMERE are described in Table 2. The stations are located in rural or remote mountainous areas, away from local emission sources, and so are representative for the regional concentration field. Further details on the validation of O3 simulated by CHIMERE can be found in Honoréet al. (2008), Rouil et al. (2009), and Szopa et al. (2009).
| Station name | Country | Latitude | Longitude | Altitude (m) |
|---|---|---|---|---|
| Giordan Lighthouse | Malta | 36.07°N | 14.22°E | 160 |
| Jungfraujoch | Switzerland | 46.33°N | 7.59°E | 3578 |
| Krvavec | Slovenia | 46.18°N | 14.32°E | 32 |
| Monte Cimone | Italy | 44.18°N | 10.70°E | 2165 |
Figure 3 (left panels) shows the daily averages of surface O3 concentrations for the whole year 2002 as simulated by CHI-CTL and measured at sites. In general, the model is able to simulate the daily O3 concentration. In most of the sites the simulated O3 is in agreement with the observations, even though there can be large errors on some individual days.
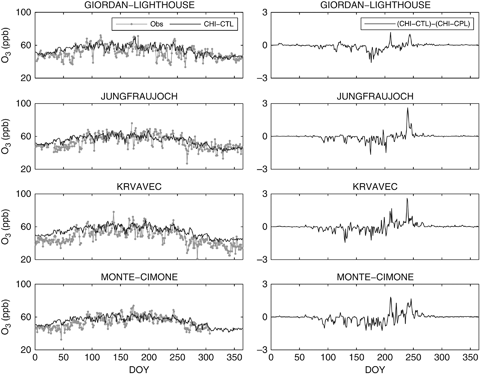
Observed and modelled (CHI-CTL) mean daily ozone concentration for different monitoring stations (left panels), and differences between CHIMERE uncoupled and coupled simulations (CHI-CTL–CHI-CPL) on the same sites (right panels).
Besides, Fig. 3 (right panels) points out that taking into account only the O3 influence on GPP in the LAI calculation does not result in any significant change in simulated surface O3 concentrations. Except few isolate daily episodes, the difference between CHI-CTL and CHI-CPL O3 is quite low. The largest changes occur during spring and summer owing to differences in the LAI between the monthly MODIS dataset and the daily ORCHIDEE LAI. Nevertheless, during winter and fall these differences in O3 concentration are close to zero (Fig. 3).
As we already stated, CHIMERE shows a reasonable agreement with the observed data for all the different stations. Besides, since the differences between CHI-CTL and CHI-CPL are weak (Fig. 3, right panels), the coupling does not improve model performance in the case of surface O3. The overall error (root mean square error) computed taking into account all the four sites is 7.05 ppb, while the overall correlation coefficient is 0.6.
These results suggest that changes in biogenic emissions due to the daily LAI directly provided by ORCHIDEE cause insignificant changes in surface O3 concentrations. Moreover, changes in biogenic emissions owing to the coupling with ORCHIDEE are notable in almost all the domain. Figure 4 shows the percentage of change in the isoprene and NO emissions as computed by the MEGAN model in the CHI-CPL and CHI-CTL simulations. Therefore, providing the ORCHIDEE LAI to CHIMERE leads to both positive and negative changes in biogenic emissions (Fig. 4). However, the effect of changes in BVOCs emissions on European O3 levels is not significant due to the low sensitivity of CHIMERE simulated O3 to BVOCs changes (Curci et al., 2009).
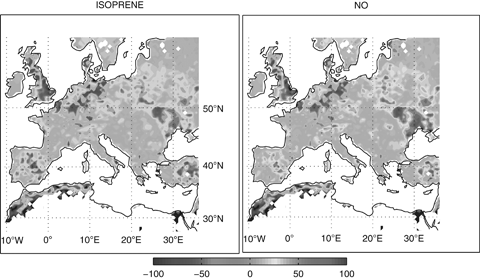
Relative change (%) between the mean annual isoprene (a) and NO (b) emissions as computed by MEGAN model in the CHI-CPL and CHI-CTL simulations.
Unlike O3, other species show significant differences between coupled and uncoupled simulations. Figure 5 shows the relative change between the mean annual NO2 concentrations simulated by CHI-CPL and CHI-CTL. Note that the NO2 relative changes are large (both positive and negative anomalies) and significant (Fig. 5). The area of maximum variations (Fig. 5) match the area of maximum differences in NO emissions (Fig. 4), which suggests that the changes in NO2 result mainly from changes in the NO emissions due to the different LAI.
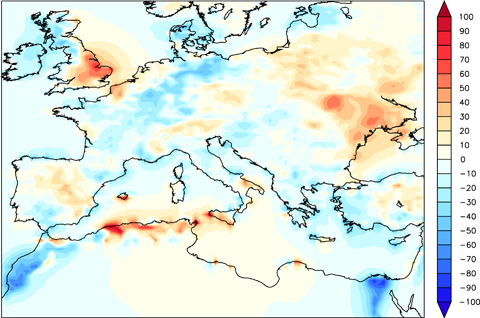
Relative change (%) between the mean annual NO2 concentrations simulated by CHI-CPL and CHI-CTL. Above±30% the differences become statistically significant (t-test, P<0.01).
Finally, it is noteworthy that the time series representing the daily variability of spatially-averaged biogenic emissions for the three different CHIMERE simulations show a similar behaviour (not shown). The coupling slightly modulates the amplitude of the biogenic emissions leaving unchanged the daily variability, which is mainly driven by the daily temperature [see Eqn (4)].
Impact of O3 on vegetation
The faster response to O3 exposure involves essentially changes in stomatal behaviour resulting in a photosynthesis reduction (Reich 1987; Wittig et al., 2007).
Figure 6 shows the simulated inhibitory effect of O3 on GPP, cumulated over the whole year 2002. Generally, accounting for the role of O3 in ORCHIDEE we have a significant reduction in GPP, except in North Africa, where the vegetation is absent. The mean reduction is about 200–300 g C m−2 yr−1 which roughly corresponds to 20–25% of the annual value. The largest decrease occurs in the Northern Alps and in Eastern Europe; in these areas the maximum GPP reduction is up 600 g C m−2 yr−1 ranging from 40% to 45% of the annual amount.
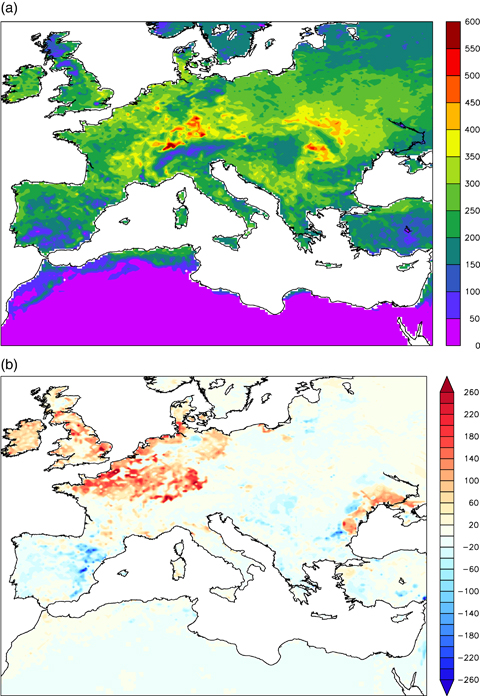
Difference between ORC-CTL and ORC-CPL annual gross primary production (a, g C m−2 yr−1) and ORC-CPL and ORC-CPL0 (b).
These maximum values found in the Northern Alps show larger effects of O3 on GPP compared with actual evidence from experimental data. Besides fumigation experiments have been performed at higher O3 concentrations (Wittig et al. 2009), which imply an inconsistency in these local areas with measurements. Since CHIMERE does not systematically overestimate surface O3 concentration (Fig. 3), this suggests that this strong impact might be related to high values of soil moisture that enhances the canopy conductance [see Eqn (1)]. Besides, the meteorological WRF forcing does not show an excess of precipitation (Anav et al., 2010), therefore we believe that there may be some issues related to the coarse parameterization of runoff and soil hydrology in ORCHIDEE.
Considering the impact of coupling on model results, the reduction of GPP is much more evident in the one-way coupled version than in the fully coupled version (Fig. 6b). Specifically, in Central-Western Europe the maximum GPP reduction in ORC-CPL0 is roughly 300 g C m−2 yr−1 more than in ORC-CPL. This behaviour is strictly related to the LAI used in the two different CHIMERE simulations that lead to differences in biogenic emissions and hence in the O3 concentration. Specifically, the biogenic emissions are generally lower in CHI-CPL than in CHI-CTL and the O3 concentration is higher in CHI-CTL (not shown), therefore the impact of O3 is larger in ORC-CPL0.
Considering the whole domain, the total European GPP simulated by ORC-CTL is 7.2 Pg C for the year 2002. The GPP computed in the ORC-CPL experiment is 5.9 Pg C, hence the overall reduction is 22.4%. According to Fig. 6a higher reduction of GPP have been found in ORC-CPL0; the overall GPP is 5.8 Pg C showing a decrease of 23.6%. Despite the differences in the domain definition, it is noteworthy that the absolute values computed in these three ORCHIDEE simulations agree with those found in Beer et al. (2007).
As mentioned previously, the maximum GPP decrease occurs in the Northern Alps and in Eastern Europe; in these regions the ground cover is mainly dominated by cropland (Fig. 7a). This pattern is not surprising since crops are more sensitive to O3 exposure than trees (Felzer et al., 2004) (as well as deciduous trees are more sensitive than coniferous trees: Reich 1987; Ren et al., 2007; Wittig et al. 2009, see also Table 1), and since the O3 concentration in these regions reaches higher levels (Fig. 7b) mainly during summer (discussed later). In fact, trees are known to possess a defence capacity (e.g., through antioxidant activity, Paoletti 2006), and to have a capacity of repairing injured tissues, while crops are much more vulnerable (Reich 1987). Moreover, because stomatal conductance is the most important regulator of O3 uptake under a given external concentration, this suggests that O3 effects on photosynthesis can be determined largely as a function of O3 uptake to internal leaf surfaces (Ollinger et al., 1997 and therein references). Hence, the phytotoxic action of O3 depends on the way it is absorbed by the leaves and therefore how it spreads in the mesophyll. Differences in the response per unit uptake between functional groups (e.g., deciduous vs. conifers) tend to be greater where leaf structure and plant growth strategy differ most (Reich 1987; Skärby et al., 1998). Evergreen leaves have lower stomatal conductance than deciduous leaves (Samuelson & Kelly 2001; Wittig et al. 2009), which results in a decrease in the O3 uptake and subsequent damage.
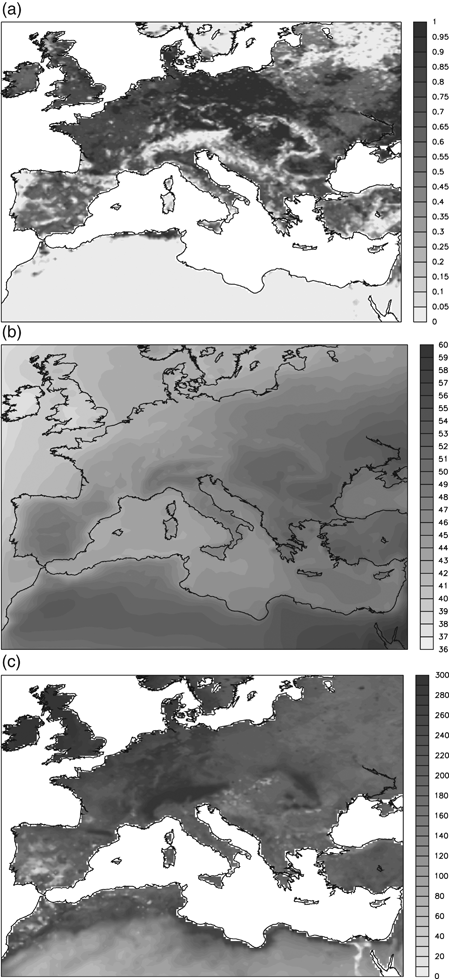
Fractional percentage coverage of ORCHIDEE C3 crops (a), maximum daily concentration of ozone (ppb) simulated by CHIMERE in the period 1 April–31 September (b), and mean ORCHIDEE soil moisture (mm) in the period 1 April–31 September (c).
A variable that strongly affects the canopy conductance is the soil moisture. Figure 7c shows the soil moisture simulated by ORCHIDEE. This figure points out that in the area where the maximum GPP reduction takes place the water available into the soil has the maximum values. Therefore, the vegetation does not experience a severe water stress, and consequently the plant stomata may be open for a long time during the day, so the O3 may easily diffuse into the leaves.
On the other hand, Mediterranean forests do not show a stong reduction in GPP (Fig. 6a). Busotti & Gerosa (2002) and Nali et al. (2004) have argued that the high O3 concentrations reported in Mediterranean forests represent a limited threat to evergreen trees and shrub species. This limited impact in Mediterranean forests is related to the high foliar concentrations of O3 defence compounds, and to the fact that summer peaks of O3 coincide with soil water deficits and stomatal closure, which may reduce the impact of O3 even on innately sensitive species (Ashmore 2005). The same behaviour, related to the high summer water stress, has been simulated by the model, and it explains the small impact of O3 on Mediterranean forests [see Eqn (1)].
The reduction in carbon assimilation leads also in a less amount of biomass stored and hence to a decrease of LAI (Fig. 8, see also Wittig et al. 2009). Note that the pattern of LAI shrinking matches the maximum GPP decrease. Specifically, the decrease in LAI is much more evident in ORC-CPL0 than in ORC-CPL, since the effect of O3 on GPP is higher in the ORC-CPL0 simulation (Fig. 6b). The ORC-CPL mean LAI reduction is about 15–20% with maximum values up to 40%; this mean value corresponds to those found by Wittig et al. (2009).
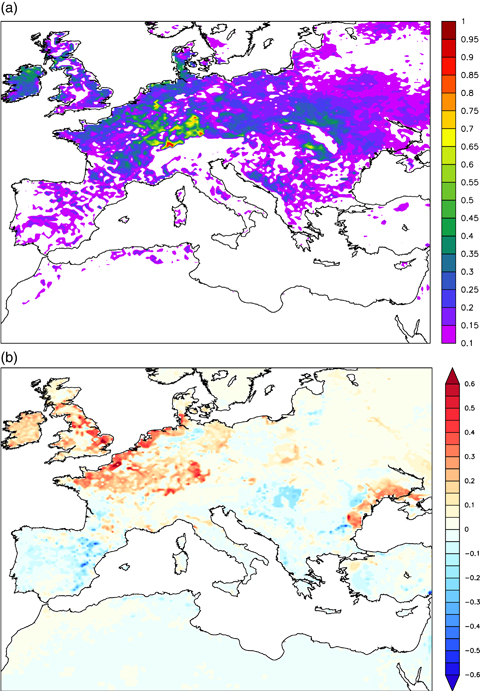
Difference between ORC-CTL and ORC-CPL annual mean leaf area index (upper panel) and ORC-CPL and ORC-CPL0 (lower panel).
In ORCHIDEE there is a balance between the leaf turnover and the new allocation to leaves depending on GPP. The turnover is not affected by O3, but the new allocation is affected by decreasing GPP. On the other hand, the allocation scheme for trees will tend to increase the fraction of assimilate going to the leaf in order to restore the maximum value of LAI. This is the reason why the LAI of trees does not change significantly. The allocation for grass does not have the same constraints, therefore the LAI does not return to its initial value.
Figure 9 shows the monthly LAI time series spatially averaged on the PRUDENCE sub-domains (Christensen & Christensen 2007). Generally the ORCHIDEE results agree with the MODIS observation for the year 2002. The larger differences occur in the Scandinavian subdomain (SC), where, during the winter months, the differences are relevant. However, this mismatch is mainly related to the snow covering the canopy of evergreen needleleaf forests during these months, which leads to underestimated LAI measurements. In the other subdomains there is a good general agreement between ORCHIDEE and MODIS data.
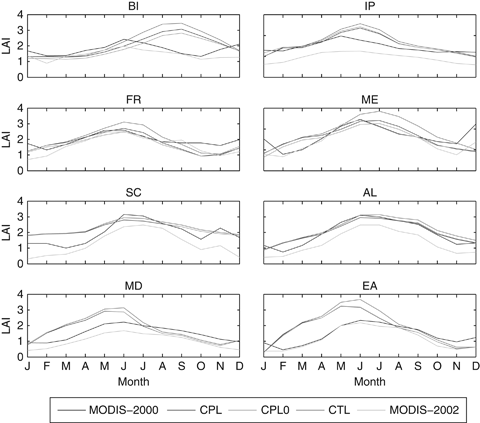
Comparison of spatially averaged monthly leaf area index (LAI) in the eight PRUDENCE subdomains for the year 2002 as simulated by ORCHIDEE standalone (CTL, blue line), ORCHIDEE coupled with CHIEMERE (CPL, red line), ORCHIDEE coupled one-way with CHIMERE (CPL0, green line), and MODIS measurements (MOD, gray line). Finally the CHI label (black line) refers to the LAI used in CHIMERE standalone version, and it represents the MODIS LAI measured for the year 2000.
The impact of O3 on model results is clearly visible also in terms of spatially averaged means. The two ORCHIDEE coupled simulations (ORC-CPL and ORC-CPL0) show a reduction in the LAI with respect to the control simulation (ORC-CTL) resulting from the decreased amount of assimilated carbon (Fig. 9). According to the GPP pattern (Fig. 6), the largest LAI decrease occurs in British Island (BI), France (FR), ME (Mid-Europe), and EA (Eastern-Europe). It is also noteworthy that the LAI reduction is greater in ORC-CPL0 than in ORC-CPL. This result is consistent with the differences of GPP between the two coupled simulations as described above.
In order to evaluate the effect of the coupling on model performances, we validate the ORCHIDEE simulations against the GPP measured in eight CARBOEUROPE (http://www.carboeurope.org/) sites spread across Europe (Fig. 1). These sites were chosen in order to represent the main European forest types (Table 3).
| Site name | Dominant species | PFT | LAI | Mean annualtemperature (°C) | Precipitation(mm yr−1) | Elevation (m) |
|---|---|---|---|---|---|---|
| Hainich | Fagus sylvatica | TBS | 6 | 7 | 750 | 445 |
| Hesse | Fagus sylvatica | TBS | 7.6 | 9.2 | 885 | 300 |
| Sorø | Fagus sylvatica | TBS | 4.8 | 8.1 | 510 | 40 |
| Loobos | Pinus sylvestris | TNE | 2.2 | 9.8 | 786 | 52 |
| Tharandt | Picea abies | TNE | 7.6 | 7.5 | 820 | 380 |
| Yatir | Pinus halepensis | TNE | 2.5 | 22 | 275 | 680 |
| Puechabon | Quercus ilex | TBE | 2.9 | 13.5 | 883 | 270 |
| Castelporziano | Quercus ilex | TBE | 3.5 | 15.6 | 781 | 3 |
- The PTF are: temperate broadleaved summergreen tree (TBS), temperate needleleaved evergreen tree (TNE) and temperate broadleaved evergreen tree (TBE).
Generally, all the simulations reproduce reasonably well the observations, despite a slight underestimation at some sites (Fig. 10). Besides, the phenological cycle is well captured in the sites where the predominant vegetation type is deciduous trees (DE-HAI, FR-HES and DK-SOR), despite the slight delay of a few days in the leaf-out and the beginning of the growing season in FR-HES and DK-SOR.

Validation of daily gross primary production (GPP) simulated by ORCHIDEE standalone (solid green line), ORCHIDEE coupled with CHIMERE (red dotted line), and ORCHIDEE coupled one-way with CHIMERE (blue dash-dot line) with respect to eddy covariance observations measured in eight CARBOEUROPE sites.
Owing to the high values of canopy conductance and O3 concentration, the impact of O3 on predicted GPP is much more evident in the summer months, where the GPP simulated by the two coupled experiments is systematically lower than ORC-CTL. Hence the introduction of the O3 in ORCHIDEE acts to further increase the model-data inconsistency, since ORC-CTL underestimates the GPP, at least in the deciduous sites.
One possible explanation to the increased model-data inconsistency is related to the ORCHIDEE parameters. Specifically, despite the fact that ORCHIDEE has not been calibrated on specific sites, photosynthesis parameters are estimated from A/Ci relationship based on in situ measurements (Wullschleger 1993) for plants exposed to ambient air O3 concentration. Hence, the estimated photosynthesis parameters are likely to be already affected by the O3 effect that would thus be taken into account twice.
We would note however that GPP measurements are affected by high uncertainties because GPP is not directly measured but is estimated from flux tower measurements of net ecosystem exchange (NEE) (Reichstein et al., 2005; Papale et al., 2006; Moffat et al., 2007; Desai et al., 2008; Lasslop et al., 2009). Therefore, the model-data inconsistency described above could be decreased taking into account the uncertainty associated to the observations.
In general, the correlation coefficient between the three ORCHIDEE simulations does not change; the overall correlation computed taking into account all the eight sites is 0.8. However, the coupling slightly improves model performance. More precisely, the RMSE of ORC-CTL is 2.7 g C m−2 day−1, while it is 2.6 g C m−2 day−1 for the coupled simulations. However, these differences are weak and not statistically significant.
Discussion
We have analyzed the regional feedbacks between O3 and vegetation at high spatial resolution over the Euro-Mediterranean basin by coupling a regional chemistry transport model with a land surface model. Taking into account the whole domain, our results indicate that the O3 reduces the GPP by about 22%. However, at some European locations the impact is much larger with a maximum GPP reduction of 600 g C m−2 yr−1 ranging from 40% to 45% of the annual amount.
Although the mean GPP reduction is close to the value found by Wittig et al. (2009) for northern hemisphere temperate and boreal forests, the impact of O3 could be overestimated due to high values of soil moisture during summer (Fig. 7c) and due to the photosynthesis parameters used in the Farquhar model (Farquhar et al., 1980) to compute GPP. Specifically, these parameters are estimated by in situ measurements, therefore they are likely to be already affected by the O3 effect that might be taken into account twice.
Figure 11a shows the CHI-CPL zonal mean of daily maximum surface O3 concentrations. It points out the seasonal variation of O3 with a broad summer maximum and a winter minimum. The maximum concentrations occur during summer (late June–August) with peaks of 66 ppb. The highest values take place mainly in central Europe (between 45°N and 50°N) as a result of large anthropogenic precursor emissions, and in North Africa during the whole summer (as a consequence of high temperatures), but with the absolute values in North Africa being lower than those in central Europe. The minimum values of O3 concentration were found during winter above 50°N owing to the mid-latitude baroclinic disturbances and low temperatures.
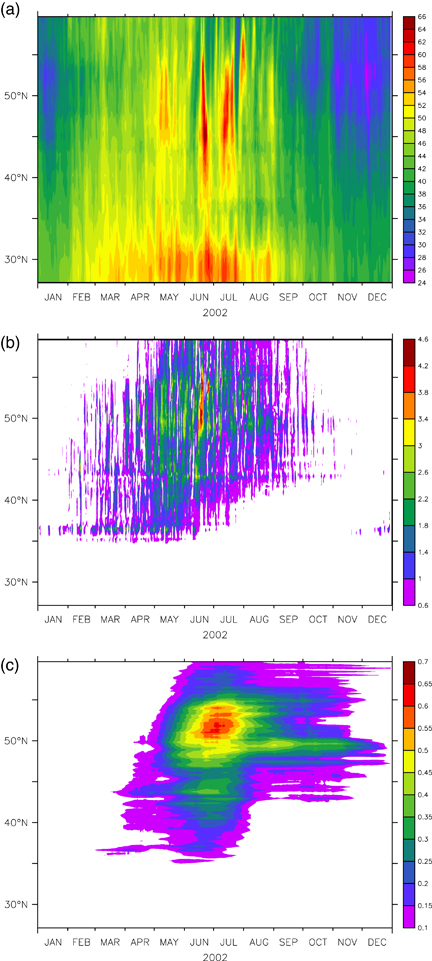
Latitude-time plots of simulated tropospheric zonal mean ozone (daily peak, ppb) from CHIMERE-CPL run (a), difference between ORC-CTL and ORC-CPL zonal mean gross primary production (g C m−2 day−1) (b), and difference between ORC-CTL and ORC-CPL zonal mean leaf area index. Data have been averaged between 10.4°W and 36.1°E.
As discussed above, the episodes of increased O3 occur over most parts of central Europe during summer. During these episodes, many of which last for several consecutive days (Fig. 11a), the O3 concentrations rise to several times the boundary layer background values over large areas of Europe. This phenomenon usually occurs under anticyclonic conditions coinciding with increased solar radiation, high temperatures and low wind speed (EEA 2007).
The daily impact of O3 on GPP is shown in Fig. 11b as the zonal mean difference between ORC-CTL and ORC-CPL. It is noteworthy that the maximum daily GPP reduction is about 4 g C m−2 and it takes place at the same latitude of the O3 peaks. Besides, the maximum GPP reduction occurs in summer, during the same days of the O3 peaks. During winter and autumn, the GPP reduction is generally weak. This is the result of two different processes. First during winter the O3 concentrations drop off the critical values of 40 ppb that may damage the vegetation (Fig. 11a). Second because of low air temperature and frozen soil, the deciduous forests loose their leaves leading to the GPP values being close to zero over large area of Europe. Afterwards, the GPP starts to increase in late March and reaches its peak in late June to early July. At this time O3 and its dissolution products cause a decline in photosynthetic efficiency (Fig. 11b) through both stomatal closure and loss of Rubisco activity.
Some studies suggest that O3-induced changes in physiological status begin with the loss of membrane integrity and the ensuing ability to transport chemical substances and to maintain ionic homeostasis (Heath & Taylor 1997; Skärby et al., 1998).
During July and August, when the other O3 peaks occur (Fig. 11a), the GPP does not show the same reduction that we found in June (Fig. 11b). The highest levels of O3 usually coincide with the time where European forests experience the greatest degree of water deficit, and their stomata are closed during the day or at least during the daily O3 peaks occurring in the afternoon (Ciais et al., 2005).
We also showed in Fig. 6 that the impact of GPP varies across Europe according to the dominant vegetation cover (Fig. 7a) and soil water availability (Fig. 7c). Several studies show that individual species vary considerably in their capacity to tolerate drought before closing the stomata (Paoletti 2006 and therein references). Deciduous trees usually close stomata at higher water stress than evergreen trees (Salleo & Lo Gullo 1990). Busotti & Gerosa (2002) suggested that the species with the greatest ability to maintain or reactivate gas exchange under conditions of water stress might be expected to be most affected by O3.
Since the Northern part of Africa is dominated by bare ground, the GPP anomaly below 35°N is zero (Fig. 11b). Also the Mediterranean forests do not show any relevant GPP reduction all year round compared with the northern Europe forests (Fig. 11b). This result agrees with previous studies performed on Mediterranean forests (e.g. Paoletti 2006).
Sclerophyll forests are the most typical plant ecosystems in the Mediterranean region and these trees are tolerant to O3 pollution because of their sclerophyllous leaves (Paoletti 2006). As shown by Busotti & Gerosa (2002), the foliar structure of Mediterranean evergreens is usually characterized by the presence of two to three layers of palisade mesophyll and a thinner layer of spongy tissue, little intercellular air space, thick cuticle and cell wall, high stomatal density and development of veins per leaf surface unit, and small stomatal size (Paoletti 2006). This is a strategy which limits the transpiration, but in doing so it also limits the absorption of CO2 and therefore of atmospheric pollutants.
In addition, some studies (Rinallo & Gellini 1989; Bauer et al., 1997) highlight that Mediterranean trees are less O3-sensitive than Northern European provenances, even without water limitation. At their southernmost distribution area, Fagus sylvatica (Bauer et al., 1997) and Abies alba (Rinallo & Gellini 1989) have more sclerophyllous leaves than the central European provenances. The typical Mediterranean conditions enhance sclerophylly, as plants grown in dry environments and under excessive light usually develop greater leaf thickness and mass (Gutschick 1999).
Obviously, land surface models are not able to distinguish the plants provenance, the stomatal size and density, as well as the number of layers of palisade mesophyll in the leaves. Besides, we did not apply a specific sensitivity coefficient α for Mediterranean vegetation. However, vegetation models can regulate the O3 concentration in the inner leaves through the canopy conductance and thus minimize the O3 stress [see Eqn (1)]. In addition, the prevailing weather conditions in the Mediterranean reduce stomatal conductance during summers, especially at midday (Tenhunen et al., 1987), so that the highest ambient O3 levels coincide with the time when natural Mediterranean vegetation experience the strongest water stress (Paoletti 2006). Avoidance related to low soil water availability (Fig. 7c) is therefore one likely reason of the discrepancy between high O3 levels and little effects in Mediterranean forests. For such reason our simulation results agree with those of previous experimental studies performed in Mediterranean ecosystems.
This result is also confirmed by GPP time series shown in Fig. 10 for the Mediterranean sites; note that in the IL-YAT semiarid forest the photosynthesis takes place mainly during winter (until DOY 120) when some rainfall events enhance the soil moisture. Similarly, during summer (around DOY 200) the GPP is suppressed in FR-PUE and IT-CPZ owing to the high water stress. During these days the O3 concentration reaches the yearly maximum values (Fig. 11a), however it marginally affects the photosynthesis due to the low values of canopy conductance [Eqn (1)].
Finally, the daily impact of O3 on LAI is shown in Fig. 11c as the zonal difference between ORC-CTL and ORC-CPL. It is noteworthy that after the high O3 stress occurring at the beginning of the summer there is a significant reduction in the LAI, with a maximum of 0.7 m−2 m−2 located at the same latitudes of the maximum GPP reduction.
A LAI reduction is expected since a decrease of photosynthesis lower the total amount of carbon that can enter to the leaves. Moreover, there is a negative feedback between LAI and photosynthesis, since a LAI decrease leads to a reduction of the total plant photosynthesis that, in turn, affects the LAI. This feedback, as well as the simulated long-term effect of O3 damage, explains the significant LAI decrease observed during the fall.
Although parameterizations of physiological processes in ORCHIDEE are relatively crude, we are able to simulate the decrease of carbohydrates throughout the plant as observed by Wittig et al. (2007, 2009).
Conclusions
Our results suggest that on short time scale O3 decreases the productivity of forests as well as the LAI. However, on longer time scale, O3 could give the coniferous forests an advantage with respect to the mixed deciduous forest, and it would potentially lead to changes in community composition. In addition, if O3 causes a large-scale decrease in the forest canopy conductance, there are major implications for regional hydrology, surface temperatures and regional climate (Wittig et al., 2007).
On the other hand, the LAI changes do significantly affect the biogenic emissions; however, due to the low sensitivity of CHIMERE to BVOCs changes, the O3 concentration differences between the coupled and uncoupled CHIMERE simulations are insignificant.
Another limitation of current approach is the relatively crude representation of O3 impact on vegetation. It is based on AOT40 and accounts only for the impact on photosynthesis but has no effect on allocation and senescence. Moreover the natural mechanism of detoxification of plants to O3 is not taken into account. This would probably reduce the impact of O3 on plants. We can expect that ongoing studies on feedbacks between vegetation and atmospheric chemistry will improve our estimation of large scale impact of O3 on vegetation in the near future.
Acknowledgements
The authors thank two anonymous reviewers for thoughtful comments which improved the manuscript. We also acknowledge the investigators and the teams managing the Hainich, Tharandt, Sorø, Loobos, Hesse, Yatir, Puechabon and Castelporziano eddy flux sites. This work was funded by CIRCE-EU project.


