The effect of light intensity on the growth of Brachymystax lenok (Pallas, 1773)
Abstract
A 35-day experiment was carried out to investigate the effect of light intensity on growth of Brachymystax lenok under different light intensities: 10, 70, 240 and 1000 lx. Fish(5.5 ± 0.24 g)used in the experiment were fed to satiation twice a day (08:00 hours, 14:00 hours).The photoperiod was 12L:12D (08:00–20:00 hours). The specific growth rate(SGR) of B. lenok under lower intensities(10 lx,70 lx)was significantly higher than the other groups(P < 0.05).No significant difference in feed intake was observed at different light intensities, but feed efficiency (FE) in wet weight at lower intensities (1070 lx) was higher than that at higher intensities(240,1000 lx) (P < 0.05).The final survival rate of juveniles varied from 86.33% to 93.66%,and there was no significant difference between experimental groups. The tested fish under higher light intensities (240 and 1000 lx) spent much more energy in respiration and excretion while depositing less energy for growth than those fish under lower light intensities. It is concluded that light intensity significantly affected growth and optimal light intensity for B. lenok juveniles was about 10–70 lx.
Introduction
Fish growth is an important physiological parameter of social interactions and is often influenced by genetic and environmental factors (Sloman & Armstrong 2002). For a long time, the influence of environmental factors on fish has been studied with respect to their effects on growth and survival(Noble, Mizusawa & Tabata 2005; Toshinao, Shuji, Mikio & Shugo 2005). Among them, light intensity is one important and directive factor that determines the development and growth of fish larvae and juveniles because most fish are visual feeders and need a minimal threshold light intensity to be able to develop and grow normally (Ounais-Guschemann 1989). A few species are able to develop and grow at very low intensities or, sometimes, in the absence of light. However, light that is too intense might be stressful or even lethal(Boeuf & Le Bail 1989).Stress may also cause an increase in metabolic rates of fish (Barton & Schreck 1987; De Silva & Anderson 1994).Consequently, stress responses are energy draining processes that may increase the energy expenditure of fish in culture, and reduce growth rates and feeding efficiency.
Lenok(Brachymystax lenok) is an important cold freshwater fish distributed in east Siberia,Mongolia,China and Korea(Yingzhe, Yan & Yiyu 2006).Belonging to the Salmonidae family, this carnivorous species is considered to be a promising new fish species for culturing in China. However, high mortality during juvenile development has hindered the industrialization and commercializ- ation of this species. This occurs at a body weight of 0.5–10 g when juveniles are characterized by parr mark. Artificial environments that are very different from the natural habitats of fish may negatively affect fish-feeding activity, survival and growth, especially if conditions are stressful to the fish(Knights 1985; De Silva & Anderson 1994; Xu, Xia, Yao, Li, Zhang & Mou 2007).For example, the survival rate of juvenile B. lenok was found to be significantly affected by stocking density, but not the specific growth rate or coefficients of variation (Zhang, Jia, Ji & Mou 2008).Other environmental factors that may influence fish performance in culture include light intensity (Brännäs et al., 2001). Thus, the effect of light intensity on growth of B. lenok may be important and different cultivation strategies may be required for different life history phases. However, there is no information about light intensity on juvenile B. lenok. The purpose of this study was to investigate the effect of light intensity on the growth and survival of Lenok, and to analyse its mechanisms by means of estimating energy budgets.
Materials and methods
Fish and rearing conditions
The experimental fish were obtained from Bohai Coldwater Fisheries Research Station of Heilongjiang River Fisheries Research Institute(Mudanjiang, Heilongjiang,P. R. China).Before the experiment, all the health-selected fish were acclimated in rearing tanks for 2 weeks. Fish were fed to apparent satiation twice daily (08:00 hours, 14:00 hours) during the acclimation with the experimental diet. The experimental diet for juvenile B. lenok was a commercial Salmonfood feed (TR2242;Vita care, Puerto Montt, Chile) with white fish meal, fish oil, soybean meal, corn, FeSO4, ZnSO4 7H2O, CuSO4·5H2O, MnSO4, Na2SeO3, Vitamin A, VitaminD3,Vitamin E, Vitamin K3, Vitamin C, Vitamin B1,Vitamin B2,Vitamin B6,Vitamin B12, niacin, folic acid, inositol, etc. The chemical composition of this diet was 9.15 ± 0.11% water, 47.48 ± 0.31% protein, 22.22 ± 0.28% lipid,6.84 ± 0.05% ash and gross energy content was 22.96 kJ g−1. Before the start of feeding the diet was mixed with a fixed proportion of water (water: Salmonfood feed = 1:2) and made into pellets (1.5 mm, in diameter). The experiment was carried out in a semi-recirculation system consisting of 12 circular polythene tanks. (70 cm in diameter, 20 cm in depth and water volume: 75 L).Freshwater used in the experiment was filtered using a sand filter. Flow rate of water to each tank was 0.3 × 10⁻³ s−1–0.4 × 10 m−3 s−1. During the experiment, dissolved oxygen was maintained above 6 mg L−1, pH was around 7.4, water temperature was 10 ± 1.0°C, and ammonia-N was less than 0.1 mg L−1.
Experimental design
The four illumination levels tested were 10, 70, 240 and 1000 lx, respectively. Light intensity was measured in lx at the water surface of each tank using a light metre (TES-1334A; Salmofood, Puerto Montt, Chile). The experiment on each light treatment was conducted in separate rooms set in an experimental room. To remove the effects of any background light on the experiment, each experimental tank was covered completely with a black twofold screen. Triplicates were set up for the experiment on each light treatment. Artificial light was provided by fluorescent lamp (20 W) over each tank, and the illumination intensity were adjusted through a combination of numbers of lamps and the distances between lamps and water surface. Before the experiment, fish were deprived of feed for 24 h. All size–selected fish about 5 g were pooled into a large fibreglass tank and 100 fish were randomly transferred into each tank. During the experiment, the fish were hand-fed to satiation twice a day (08:00 hours, 14:00 hours). Daily feed intake was recorded and uneaten feed was siphoned after feeding, dried and then weighed. Dead fish were removed and weighed. The growth experiment lasted for 35 days. At the end of the experiment, the fish in each tank were batch weighed after 24 h food deprivation and the survival was calculated.
Sampling and chemical analysis
Five fish samples were randomly taken (10 fish/each sample) at the beginning of the experiment from the original batch and five fish from each tank were randomly sampled at the end of the trial for the chemical analysis of initial and final body composition. Intact faeces were siphoned within 2.5 h after each meal. For the experimental diet, faeces and fish body, crude protein, lipid and energy content were analysed. Moisture content was determined by drying the sample in an oven at 105°C until a constant weight was obtained. Crude protein content was determined by the Kjeldahl method, and a conversion factor of 6.25 was used to convert total nitrogen to crude protein. Crude fat was determined by the Soxhlet extraction method (AOAC, 1990), and energy by bomb calorimeter (Parr 1281,USA). The concentration of Cr2O3 added to the diets to estimate the apparent digestibility was determined as described by Furukawa and Tsukahara (1966).
Determination of energy contents and estimation of energy budget


where CN is the nitrogen consumed from food; FN, the nitrogen lost in faeces; GN, the nitrogen deposited in fish body; 24.83, the energy content in excreted nitrogen per gram (kJ g−1). The nitrogen contents in the formulated feed, fish and faeces were determined by Kjeldahl method.
Calculation of data


Statistics
Statistical analysis was performed using spss11.0 statistical software. Data from each treatment were subjected to one-way anova. When overall differences were significant at the 0.05 level, Duncan's multiple range test was used to compare the mean values among treatments.
Results
Survival and growth
The final survival rate of juveniles varied from 86.33% to 93.66%.There was no significant difference between experimental groups (Table 1).The final wet body weight of tested B. lenok under different light intensities during the course of the experiment are shown in Table 1. The highest and lowest final wet body weight of the fish occurred under 10 and 1000 lx, respectively, and there existed a significant difference between them (P < 0.05). Specific growth rates (SGR) of the tested fish in terms of wet weight, protein and energy decreased with light intensity (Fig. 1). The lowest SGRw was observed under 1000 lx, which was 29.68%, 27.01% and 16.76% of those under10, 70 and 240 lx, respectively (P < 0.05).

| Treatments(lx) | Body wet weight(g) | Survival rate(%) | |
|---|---|---|---|
| Initial | Final | ||
| 10 | 5.50 ± 0.17 | 11.83 ± 0.14a | 93.66 ± 0.58 |
| 70 | 5.50 ± 0.10 | 11.52 ± 0.34a | 93.00 ± 1.00 |
| 240 | 5.53 ± 0.58 | 10.52 ± 0.39b | 86.33 ± 0.58 |
| 1000 | 5.52 ± 0.10 | 9.48 ± 0.45c | 90.67 ± 5.03 |
- Values with different superscripts in the same column are significantly different (P < 0.05).
Feed intake
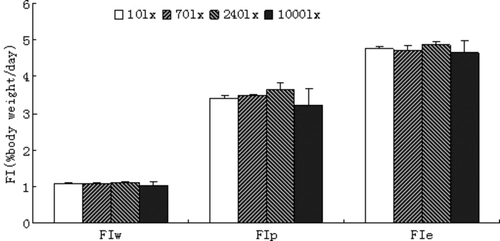
There were no significant differences among groups cultured under different light intensities (P > 0.05) (Fig. 2). FIw,FIp and FIe exhibited the same pattern.

Feed efficiency
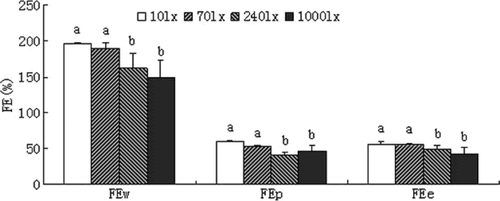
The feed efficiency in terms of wet weight (FEw), protein (FEp) and energy (FEe) significantly improved with decreased light intensity(Fig. 3). The values of feed efficiency were significantly higher at low light intensities (10 and 70 lx).

Apparent digestibility
The effect of light intensity on the apparent digestibility of juvenile B. lenok is depicted in Table 3. Within measured interval of the experiment, there were no significant differences in apparent digestibility of dry matter (ADd) and protein (ADp) and also no significant difference in apparent energy digestibility (ADe) among all groups.
Energy allocation
The patterns of energy allocation in the tested fish among the groups under different light intensities are shown in Table 2. The tested fish under higher light intensities (240 and 1000 lx)spent much more energy in respiration and excretion while depositing less energy for growth than those fish under lower light intensities.In contrast, the fish under the 10-and 70-lx light treatments deposited more energy for growth and spent less energy in respiration and excretion. The difference in energy allocation between them was significant (P < 0.05).
| Treatments(lx) | G/C | R/C | F/C | U/C |
|---|---|---|---|---|
| 10 | 55.24 ± 2.09a | 22.46 ± 2.06a | 20.17 ± 0.52a | 2.13 ± 0.03a |
| 70 | 53.23 ± 2.06a | 24.65 ± 1.98a | 19.67 ± 0.76a | 2.42 ± 0.08a |
| 240 | 46.75 ± 2.18b | 29.02 ± 1.73b | 20.10 ± 0.78a | 3.24 ± 0.45b |
| 1000 | 40.91 ± 2.57c | 32.23 ± 2.15b | 23.25 ± 0.67b | 3.60 ± 0.42b |
- Values (expressed as mean ± SD) with different superscripts in the same column are significantly different from each other (P < 0.05).
- G/C (%) = energy for growth/energy consumed in food.
- R/C (%) = energy for respiration/energy consumed in food.
- F/C (%) = energy for faeces/energy consumed in food.
- U/C (%) = energy for excretion/energy consumed in food.
| Treatments(lx) | 10 | 70 | 240 | 1000 |
|---|---|---|---|---|
| ADd | 72.33 ± 4.04 | 72.67 ± 5.86 | 71.00 ± 1.00 | 69.33 ± 4.01 |
| ADp | 82.14 ± 2.60 | 81.36 ± 4.00 | 80.33 ± 0.68 | 79.04 ± 2.76 |
| ADe | 78.54 ± 3.14 | 79.29 ± 4.44 | 78.25 ± 0.75 | 76.23 ± 3.13 |
Discussion
Most fishes are visual feeders and it seems that the effect of light intensity on growth and survival are species-specific (Puvanendran & Brown 2002).As revealed by Petersen and Gadomski (1994), models simulation suggested two potential responses predation rate to light intensity, the peaked and sigmoidal types. A peaked predation response with a decreasing feeding rate as light intensity decline corresponds with other observation that most fish stop feeding at low light levels(Ali 1959; Blaxter 1965). However,some species such as Phoxinux oxinux L. are capable of limited feeding in the dark(Blaxter 1965),which coincides with the sigmoidal response. In the present study, there was no significant difference in feed intake among groups cultured under different light intensities (P > 0.05),but slower feeding is required to ensure good intake. It revealed that juvenile B. lenok need a minimal threshold of light intensity to be able to grow normally. This could be relevant to its habits. Under natural conditions, lenoks live in mountain streams with thick vegetation at both sides, like feeding at dawn and dusk, and are commonly known as a crepuscular feeding fish. The better growth of B. lenok at low light intensity could be the result of long-term adaption to the natural enviroment.
In larvae, many studies have been dedicated to the influence of light intensity on growth, and only a few studies were concerned in juveniles. Exact conclusion should be based on the precise light levels rather than the higher or lower light intensity in previous reports because sometimes it could be quite different in different species(Han, Xie, Lei, Zhu & Yang 2005). Sea bass larvae were reported to show improved growth at very intense light levels in the range of 1400–3500 lx(Barahona-Fernandes 1979), while juvenile halibut can grow and develop at 1–10 lx (Hole & Pittman 1995).In the present study, growth of Bra- chymystax lenok was affected significantly by light intensity. The best growth was obtained at low light intensity (10–70 lx) than at others and the SGR of the tested fish declined in the order of 10 > 70 > 240 > 1000 lx. There was a significantly higher FCE for juveniles reared in 10 or 70 lx. Light intensity affects fish growth through a better food conversion efficiency rather than stimulated food intake (Boeuf & Le Bail 1989). As a crepuscular feeding fish, B. lenok is less active at suitable light intensity and more food energy could be used for growth(Chongzhi, Huaiming, Zhenbo & Pirong 2001; Trippel & Neil 2003) In general, for carnivorous fish species, faeces and nitrogenous excretion only account for a small portion of food energy and do not greatly inluence the proportion of food energy allocated to growth, so it is the metabolism that plays an important role in influencing the proportion of energy intake allocated to growth for usually a large portion of food energy is spent in it(Lihua, Haoru & Liangmin 2006). Light intensity can contribute to fish stress (Boeuf & Le Bail 1989; Papoutsoglou, Karakatsouli & Chiras 2005),which may affect their behaviour and cause an increase in metabolic rates in fish (Barton & Schreck 1987; De Silva & Anderson 1994). Both behavioural and physiological stress responses are energy draining processes that may increase the energy expenditure of fish in culture, and reduce growth rates(Strand, Alanärä, Staffan & Magnhagen 2007) In the present study, the tested fish under the 1000-lx light treatment spent much more energy in respiration and excretion while depositing less energy for growth than those under any other light intensities, indicating that a much higher metabolism impacting normal growth might occur as light intensity increases. Furthermore, active feeding could not be a major affecting factor and the slowest growth at 1000 lx was mainly due to a higher metabolism; In contrast, more energy under lower light treatments (10 and 70 lx) deposited for growth and less energy could be spent in respiration and excretion. So B. lenok juveniles under the lower light treatments used more energy for growth also contributing to a higher SGR.
Conclusion
In this study, only four illumination levels were used as experimental treatments. Both growth and feed conversion efficiency maximized at lower light intensities (10–70 lx), and considering the slower feeding at 10 lx, a light intensity of 70 lx could be thought of as the optimum growth illumination level of juvenile B. lenok at this growth stage for culturing.
Acknowledgments
This study was supported by Special Fund for Agro-scientific Research in the Public Interest (Grant no.201003055),the National Science and Technology Supporting Plan of the Eleven 5-Year(Grant no.2006BAD03B08), Key Project of Heilongjiang Provincial Science and Technology Department(Grant no.GA06B203-4) and The Central-Level Non-profit Scientific Research Institutes Special Funds(Grant no.2009HSYZX-YZ-03).


