IER3 (IEX-1) dysregulation serves as a potential prognostic factor in acute myeloid leukemia patients
Abstract
Introduction
Immediate early response 3 (IER3) has association with hematological malignancies’ risk and prognosis, such as myelodysplastic syndrome, while its relation to acute myeloid leukemia (AML) is not clear. This study aimed to explore the correlation of IER3 with AML risk, clinical characteristics, complete remission (CR), event-free survival (EFS), and overall survival (OS).
Methods
A total of 93 de novo AML patients were included in this study. In addition, 30 patients with non-hyperplasia hematologic malignancies requiring bone marrow testing (as disease controls) and 30 health donors (as health controls) were also recruited. Bone morrow samples of AML patients (before treatment), disease controls (before treatment), and health controls (at donation) were collected. IER3 in bone marrow mononuclear cells was detected by reverse transcription-quantitative polymerase chain reaction.
Results
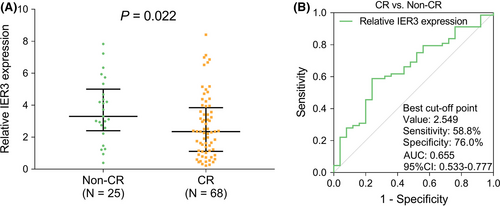
IER3 was increased in AML patients compared with disease controls and health donors (both P < .001), and receiver operating characteristic (ROC) curve showed that IER3 had certain capability of distinguishing AML patients from disease controls (area under curve (AUC): 0.735, 95% confidence interval (CI): 0.650-0.820), and health donors (AUC: 0.789, 95% CI: 0.712-0.866). Meanwhile, IER3 was correlated with FLT3-ITD mutation (P = .030) and poor NCCN risk stratification (P = .031) in AML patients. Moreover, IER3 had negative association with CR in AML patients (P = .022), and showed certain potential in discriminating CR patients from non-CR patients (AUC: 0.655, 95% CI: 0.533-0.777). Besides, IER3 was negatively associated with EFS (P = .033), but not OS (P = .083) in AML patients.
Conclusion
IER3 dysregulation serves as a potential prognostic factor in AML patients.
1 INTRODUCTION
Acute myeloid leukemia (AML) is a malignancy manifested by clonal growth of primitive hematopoietic stem cells or progenitor cells, whose incidence increases with age and the median age of AML patients is 70 years old.1-3 Presented with de novo, generally, AML is the most common type of acute leukemia in adults associated with high morbidity and mortality risk.4 A previous large-scale study shows that the overall survival (OS) rate of AML patients after 5 years ranges from 34% to 68%.5 Therefore, finding out biomarkers to predict the AML prognosis may further improve the management of AML patients.
Immediate early response 3 (IER3), formerly known as IEX-1, is an early response gene induced by a variety of stimuli, which is important for regulating apoptosis and cell growth in various cells and organs.6, 7 Moreover, IER3 is a transcriptional target gene of early growth response 2 gene (EGR2), which regulates the expression of myeloid cell leukemia 1 (Mcl-1).8 As an anti-apoptotic protein, Mcl-1 plays a vital role in promoting leukemic stem cell (LSC) survival in AML, and its overexpression is a prognostic marker in AML.9 In addition, IER3 also involves in the pathobiology of myelodysplastic syndrome (MDS). For instance, dysregulation of IER3 expression is associated with MDS progression.10 During MDS progression, reduced IER3 expression occurred with impaired apoptosis of leukemia cells with a higher possibility of AML development.7 Based on the above-mentioned information, we hypothesized that IER3 might be correlated with AML risk and prognosis. However, no relevant study has been performed previously.
In this study, we aimed to investigate the correlation of IER3 with AML risk and its clinical characteristics. Besides, we also aimed to explore the association of IER3 with AML prognosis, including treatment response, event-free survival (EFS) and OS.
2 MATERIALS AND METHODS
2.1 Subjects
This study had been approved by the institutional review board. From January 2016 to December 2019, a total of 93 de novo AML patients admitted to our hospital were consecutively included in this study. Eligible patients were recruited based on the following criteria: (a) newly diagnosed as AML rather than acute promyelocytic leukemia; (b) age older than 18 years; (c) willing to provide bone marrow (BM) for this study use, and (d) able to conduct regular follow-up. Patients who complicated with other hematologic malignancies or cancers, or had an exposure history of radiotherapy or chemotherapy, were not included in the study. In addition, 30 patients with non-hyperplasia hematologic malignancies requiring bone marrow testing were recruited as disease controls; meanwhile, 30 health donors were recruited as health controls. The disease controls comprised megaloblastic anemia patients, mild aplastic anemia patients, and iron-deficiency anemia patients. All disease controls were confirmed as nonmalignant anemia without hematologic malignancies by BM examination and other necessary tests. The health status of health donors was confirmed by a series of necessary examinations before BM donation. In particular, female subjects who were pregnant or breastfeeding were ineligible for enrollment. All subjects provided the written informed consents.
2.2 Clinical data and BM sample collection
Demographics, BM morphology classification, cytogenetics, genetic mutations, BM blast level, and white blood cell (WBC) level as well as risk status of AML patients were documented after diagnostic workup. The risk stratification was evaluated according to the NCCN Guidelines (Version 1.2015). BM samples of AML patients and disease controls were collected prior to the beginning of treatment. BM samples of health donors were collected on their donation procedure. After collection, BM samples were treated with Human bone marrow mononuclear separation kit (Beijing Solarbio Technology Co., Ltd.) and processed by gradient centrifugation to separate the BM mononuclear cells (BMMCs), which were then used for quantitative analysis of IER3 expression by the Reverse Transcription-quantitative Polymerase Chain Reaction (RT-qPCR) assay.
2.3 RT-qPCR assay
The BMMC was treated by TRIzol™ Reagent (Thermo Fisher Scientific) to extract total RNA, which was then submitted to perform reverse transcription using ReverTra Ace® qPCR RT Kit (Toyobo). Thereafter, qPCR was carried out on Applied Biosystems™ ProFlex™ PCR System (Thermo Fisher Scientific) with KOD SYBR® qPCR Mix kit (Toyobo). GAPDH was served as reference gene. The relative quantitative analysis of IER3 expression was conducted with the use of 2-ΔΔCt method.11 The primer sequences for IER3 were: forward: 5′-TCCTGTTTTGTCTCCCCTTACG-3′ and reverse: 5′-TCAGGATCTGGCAGAAGACGAT-3′.12 The primers sequences for GAPDH were: forward: 5′-TGACCACAGTCCATGCCATCAC-3′, and reverse: 5′-GCCTGCTTCACCACCTTCTTGA-3′.
2.4 Evaluation and follow-up
All AML patients received standard “3 + 7” induction therapy with the regimen of 3 days of an anthracycline and 7 days of cytarabine. Response evaluation was conducted on day 21 to day 28 after induction therapy. Complete remission (CR) was evaluated according to the AML guideline.13 CR patients were recorded for study analysis. Besides, surveillance and follow-up for AML patients were conducted as clinical practice. The deadline of follow-up for the current study was December 31, 2020, and the median follow-up was 35.0 months with 95% confidence interval (CI) of 29.4 to 40.6 months (estimated by reverse Kaplan–Meier method). EFS and OS were estimated based on follow-up information, according to the AML guideline.13
2.5 Statistical analysis
Data were reported using number (percentage), mean value with standard deviation (SD), or median with interquartile range (IQR). Difference expression analysis for IER3 between different groups was determined by Kruskal–Wallis test or Mann-Whitney U test. Correlation of IER3 with risk status was analyzed using spearman test. The receiver-operating characteristic (ROC) curve analysis was performed to estimate performance of IER3 in distinguishing different subjects. The expression of IER3 was classified as four quantiles in survival analysis: quantile 1 (Q1): IER3 expression within 0%-25% of total AML patients; quantile 2 (Q2): IER3 expression within 26%-50% of total AML patients; quantile 3 (Q3): IER3 expression within 51%-75% of total AML patients; quantile 4 (Q4): IER3 expression within 76%-100% of total AML patients. EFS and OS were elucidated using Kaplan–Meier curves and determined by Log-rank test among different quantile patients. P value <0.05 was considered as statistically significant. SPSS 22.0 (IBM Corp.) was employed for data analysis.
3 RESULTS
3.1 Characteristics of AML patients
A total of 93 de novo AML patients were admitted in this study. The characteristics of AML patients were summarized in Table S1. In detail, the mean age of AML patients was 58.3 ± 13.1 years, and there were 57 (61.3%) males and 36 (38.7%) females. Regarding FAB Classification, there were 5 (5.4%) AML patients with M1, 31 (33.3%) AML patients with M2, 24 (25.8%) AML patients with M4, and 33 (35.5%) AML patients with M5. Besides, the number of AML patients with normal karyotype, complex karyotype, clonal chromosomal anomaly and other cytogenetics were 46 (49.5%), 13 (14.0%), 7 (7.5%) and 34 (36.6), respectively. As for the risk stratification according to NCCN guideline, there were 18 (19.4%) AML patients having better risk, 45 (48.4%) AML patients having intermediate-risk and 30 (32.3%) AML patients having poor risk (Table S1).
3.2 IER3 expression in AML patients, disease controls, and health donors
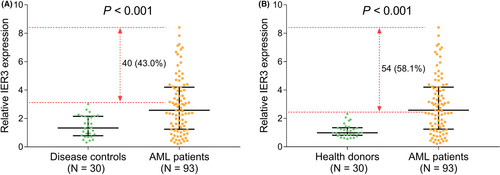
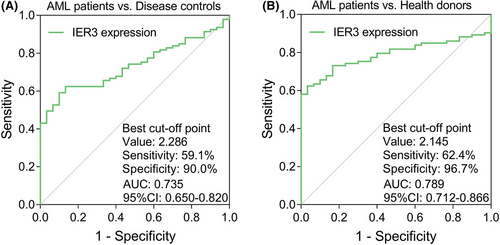
IER3 expression was higher in the AML patients (N = 93) than in the disease controls (N = 30) (P < .001), besides, IER3 expression in 40 (43.0%) AML patients was above the highest IER3 expression in the disease controls (Figure 1A). Meanwhile, IER3 expression in the AML patients was also elevated than that in the health donors (N = 30) (P < .001); additionally, 54 (58.1%) AML patients possessed higher IER3 expression than the highest IER3 expression of the health donors (Figure 1B). The ROC curve exhibited that IER3 expression had certain potential in discriminating AML patients from disease controls with AUC of 0.735 (95%CI: 0.650-0.820). Additionally, IER3 expression at the best cut-off point (defined as the point at which the value of the sum of sensitivity and specificity was maximized) was 2.286; and the sensitivity and specificity of the best cut-off point were 59.1% and 90.0%, respectively (Figure 2A). Moreover, the ROC curve showed that IER3 expression had certain ability of distinguishing AML patients from health donors with AUC of 0.789 (95%CI: 0.712-0.866). Besides, IER3 expression was 2.145 at the best cut-off point; and the sensitivity and specificity of the best cut-off point were 62.4% and 96.7%, respectively (Figure 2B).
3.3 Association of IER3 expression with FAB Classification, cytogenetics, genetic mutations, and NCCN risk stratification in AML patients
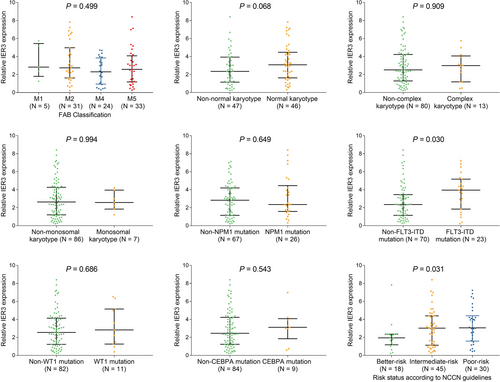
IER3 expression was positively correlated with FLT3-ITD mutation (P = .030), and associated with poor NCCN risk stratification (P = .031); however, no association was found in IER3 expression with FAB classification, cytogenetics or other genetic mutations (all P > .05) (Figure 3A-H).
3.4 Association of IER3 expression with treatment response in AML patients
IER3 expression had negative association with CR (P = .022) (Figure 4A). As shown by the ROC curve, IER3 expression achieved certain potential in discriminating CR patients from Non-CR patients with AUC of 0.655 (95%CI: 0.533-0.777). Besides, the sensitivity and specificity at the best cut-off point were 58.8% and 76.0%, with IER3 expression at the best cut-off point of 2.549 (Figure 4B).
3.5 Association of IER3 expression with EFS and OS in AML patients
EFS and OS were the key prognosis indications in AML patients, which were accessed in our study as well; then, we found that IER3 expression was associated with lower EFS (P = .033) (Figure 5A). However, no correlation was observed between IER3 expression and OS (P = .083) (Figure 5B). Moreover, according to multivariate Cox's regression analysis, higher IER3 expression was independently correlated with unsatisfactory EFS (P = .005, HR =73.983), but not OS (Table S2). Furthermore, high IER3 expression was correlated with poor CR (P = .029) and associated with EFS to some extent in the poor risk subgroup (P = .054) (Table S3). However, more large-scale studies were needed to validate the possibility of IER3 as a part of risk stratification.

4 DISCUSSION
Finding more biomarkers to predict the prognostic value for disease risk may improve the management of patients and achieve the following purposes: firstly, explore the correlation of the new biomarker with prognosis and further provide potential reference for its adding into the existing risk stratification; secondly, provide basis for further experiments. Therefore, this study was performed to explore the association of IER3 with AML risk and prognosis.
As to IER3 expression in the myeloid malignancies, a previous study shows that IER3 expression increases in advanced MDS patients.14 In line with previous studies with myeloid malignancy, our study found that IER3 expression was increased in the AML patients compared with disease controls and health donors. Meanwhile, we also observed that IER3 expression was correlated with AML risk. The reason could be that higher IER3 expression might suppress apoptosis and cause uncontrolled proliferation of neoplastic cells leading to AML.10, 15
Regarding the correlation of IER3 expression with clinical characteristics of leukemia disease, as shown by a previous study, dysregulated IERS has relation with karyotypes in MDS patients.10 According to our study, positive correlation was discovered in IER3 expression with FLT3-ITD mutation in AML patients. However, no association of IER3 with FAB classification, cytogenetics, or other key mutations in AML patients was found. Due to the small sample size, we did not explore the correlation of IER3 with trilineage dysplasia in AML patients. Meanwhile, we did not investigate the association of trilineage dysplasia with prognosis in these AML patients. As for the correlation of IER3 with NCCN risk stratification, as far as we know, there was no study conducted before to explore the correlation between them. In this study, we found that IER3 expression was associated with poor NCCN risk stratification in AML patients. A possible explanation might be that on the basis of our above data, IER3 expression was related to FLT3-ITD mutation, and FLT3-ITD is a part of NCCN risk stratification. Therefore, IER3 expression was associated with poor NCCN risk stratification.
In terms of the correlation of IER3 expression with prognosis in patients with myeloid malignancies, an interesting study shows that dysregulated IER3 expression is associated with decreased treatment-free survival (TFS) and progression-free survival (PFS); meanwhile, it has independent prognostic value in both OS and TFS in MDS patients.16 Our study found that higher IER3 expression was negatively associated with CR and EFS in AML patients, suggesting a worse prognosis. Possible reasons could be that (1) increased IER3 was correlated with poor NCCN risk stratification (above mentioned), and thus, it might bring in worse treatment response; (2) higher IER3 expression was associated with lower CR, which might result in a worse EFS; (3) along with a cell cycle arrest, improved IER3 might cause lower anti-cancer-drug-induced apoptosis,17 and thus, it might further negatively impact drug sensitivity and result in a poor EFS. In addition, our data showed that no correlation was observed between IER3 expression and OS, implying that IER3 might affect relapse rather than survival of AML patients. Moreover, the OS curve appeared to be quite favorable in our study. According to a latest review published in 2020, the 5-year survival of adult AML patients ranges from 34% to 68%, which is based on with or without measurable residual disease.5 In our study, we found that the 5-year OS rate was lightly over 50%. Our data were within the range of the 5-year survival data in the above review.
Although a lot of findings were discovered, there were still some limitations in this study. Firstly, this was a study with a small sample size, which might cause low statistical power. Secondly, our study did not investigate the underlying regulatory mechanism of IER3 in AML progression, and further cellular or animal experiments might be needed. Thirdly, as we included de novo AML patients, the association of IER3 with clinical characteristics and prognosis of relapsed AML patients was not accessed. Fourthly, we did not enroll AML patients with trilineage dysplasia; thus, further study might be performed on this kind of patients.
In conclusion, IER3 correlates with higher AML risk, FLT3-ITD mutation, and unfavorable NCCN risk stratification. In addition, IER3 has negative association with CR and EFS in AML patients. These findings imply IER3 may serve as a potential biomarker for evaluating the prognosis of patients with AML, thus, improving the management of AML patients.
ACKNOWLEDGMENTS
None.
CONFLICT OF INTEREST
No potential conflict of interest was reported by the authors.
AUTHOR CONTRIBUTIONS
S Ke and X Zhang made substantial contributions to the design of the present study. Data acquisition and interpretation were performed by S Ke, X Zhang, X Xiang Y Lu, and H An. All authors approved the final version of the manuscript. All authors agree to be accountable for all aspects of the work in ensuring that questions related to the accuracy or integrity of the work are appropriately investigated and resolved.
Open Research
DATA AVAILABILITY STATEMENT
The data that support the findings of this study are available from the corresponding author upon reasonable request.


