The effect of erythrocyte lysing reagents on enumeration of leukocyte subpopulations compared with a no-lyse-no-wash protocol
Abstract
Introduction
Standard protocols in flow cytometry (FCM) require lysis of erythrocytes, which may induce an unwanted loss of leukocytes as bystander effect.
Methods
In the present study, we investigated the influence of 6 laboratory protocols using 4 different lysing reagents, FACS® Lysing Solution (FacsL), QUICKLYSIS® (QuickL), IOTest® 3 Lysing Solution (NH4Cl), VersaLyse® (VersaL), and VersaLyse® with added fixative (VersaFix) on the relative quantity of leukocyte subsets identified by CD3, CD4, CD8, CD19, CD14, CD16, CD56, and CD45, applying a no-lyse-no-wash (NoL) protocol as reference. In addition, we compared the efficiency of red blood cell (RBC) lysis.
Results
Peripheral blood samples from 52 individuals were analyzed. NoL was suitable as reference method, but led to less clear-cut gating of lymphocyte and monocyte populations due to a wider distribution of light scatter. Best completeness of RBC lysis with remaining erythrocytes below 10% was achieved using NH4Cl and VersaL. We observed a loss of 11% of monocytes after QuickL. Lymphocyte counts were 19% lower after FacsL. Cell subsets within the lymphocyte compartment were rather similar between the different methods with the exception of lower B-cell counts (−8%) and higher NK-cell counts (+11%) after FacsL. NH4Cl and VersaL were in good accordance with the NoL method and also with the mean values of all methods.
Conclusion
Our data show that the lysing reagents tested lead to specific deviations in the quantitation of leukocyte subsets and show different efficiency of erythrocyte lysis.
1 INTRODUCTION
The accurate enumeration of leukocyte subsets is of clinical relevance. As an example, CD4 counts are of interest for HIV patients due to the appropriate start of medical intervention.1 Immunophenotyping by FCM has been reported to be essential in this regard, and therefore, FCM analysis has become an integral part in this field of hematologic diagnostics.
A number of different strategies for sample preparation can be incorporated in the staining procedure before readout in the cytometer. Whereas cell separation using Ficoll is still frequently used for qualitative analysis of blood cells, almost all protocols for quantitative determination of blood cell subsets require a lysing step before analysis in order to remove erythrocytes. Although it is known that the lysing procedure may lead to distinct loss of cells as it is described previously for CD4+ cells,2 CD34+ counts,3-5 and total leukocyte counts.5 Further effects like alteration in morphology, light scatter properties, antigenic epitopes of leukocytes and thus definition of subpopulations have also been described.6 Theoretically, the only way to avoid these undesirable effects is to completely eliminate lysing steps by applying no-lyse-no-wash protocols.7-9 However, due to the very high load of flow cytometer fluidics with unlysed erythrocytes, other problems may arise with the latter approach.
In the present study, we systematically compared completeness of RBC lysis and effects of different lysis reagents on major leukocyte population counts as well as lymphocyte subpopulations. We investigated the influence of four lysing reagents and six different strategies in total (five lyse-no-wash strategies and one no-lyse-no-wash-strategy) on the enumeration of leukocyte subsets. We analyzed more leukocyte subsets compared to earlier studies, using antibodies against CD3, CD4, CD8, CD19, CD14, CD16, CD56, and CD45. We analyzed if different leukocyte subsets show different sensitivities to different lysing reagents, which has to be considered for each individual case when specific subsets are of interest. Moreover, we tested if a no-lyse-no-wash protocol may be a feasible alternative to lyse-no-wash protocols.
2 MATERIALS AND METHODS
2.1 Samples and reagents
We obtained 52 blood samples as part of the routine diagnostics in our department from February to May 2015. Whole blood was collected into EDTA containing tubes and processed within 4 hours of acquisition. Only samples with 2-10 × 106 leukocytes/µL and a roughly physiological distribution of leukocyte populations were included in this analysis (granulocytes: 40%-80% of all leukocytes; lymphocytes: 20%-50% of leukocytes; monocytes: 3%-15% of leukocytes), because systematic comparisons would not be possible if populations were completely missing in pathological samples. For control purposes, we routinely prepared one blood smear per sample for microscopic analysis.
Five lysing reagents were studied. FACS® Lysing Solution (FacsL) (proprietary, BD, contains fixative), QUICKLYSIS™ (QuickL) (contents not reported, Cytognos), IOTest® 3 Solution (NH4Cl) (IMMUNOTECH SAS, Beckman Coulter, ammonium chloride based), VersaLyse™ Lysing Solution (VersaL) (IMMUNOTECH SAS, Beckman Coulter, enzymatic lysis), and VersaLyse™ Lysing Solution with added fixative (IOTest® 3 10X* Fixative Solution, IMMUNOTECH SAS, Beckman Coulter) (VersaFix). Five aliquots per sample were analyzed by lyse-no-wash protocols using the reagents described above and one by a no-lyse-no-wash protocol (NoL). The following antibodies were used: CD16-FITC, CD56-PE, CD3-ECD, CD4-PC7, CD19-APC, CD14-APC700, CD8-PB, and CD45-KO (Beckman Coulter).
2.2 Sample preparation
Antibody staining was performed in one batch, which was thereupon divided for the different lysis procedures. For this, 210 µL of blood was incubated for 20 minutes with CD16-FITC (8 µL), CD56-PE (8 µL), CD3-ECD (8 µL), CD4-PC7 (4 µL), CD19-APC (4 µL), CD14-APC700 (8 µL), CD8-PB (8 µL), and CD45-KO (10 µL).
Thereupon, the 6 aliquots of stained sample were distributed into different tubes and processed according to manufacturers' instructions as described below. All procedures were carried out at room temperature.
NoL: 10 µL stained sample was diluted with 600 µL phosphate-buffered saline (PBS). QuickL: 25 µL stained sample was mixed with 500 µL QUICKLYSIS™ and incubated for 10 minutes. NH4Cl: 25 µL stained sample was mixed with 500 µL of IOTest® 3 Solution and incubated for 10 minutes. FacsL: An aliquot of 50 µL stained sample was mixed with 500 µL diluted FACS™ Lysing Solution (50 µL FACS™ Lysing Solution and 450 µL deionized water) and incubated for 15 minutes. VersaL: 50 µL stained sample was mixed with 500 µL of VersaLyse™ Lysing Solution and incubated for 20 minutes. VersaFix: 50 µL of stained sample was mixed with 500 µL VersaLyse™ Lysing Solution containing 12.5 µL IOTest® 3 10X* Fixative Solution and incubated for 20 minutes.
2.3 Data acquisition
Data acquisition was performed using Beckman Coulter Navios flow cytometer equipped with Navios software. Instrument settings and compensation were set up using normal stained and unstained blood samples and remained unchanged (with minimal adjustments if necessary) during the study period. 30 000 leukocyte events per tube were acquired at high speed (lysed samples) or medium speed (unlysed samples). Forward Scatter (FS) and Side Scatter (SS) were adapted during sample acquisition to aim for optimal discrimination of cell populations after different lysis procedures. Fluorescence sensitivities remained fixed. For lysed samples, the acquisition threshold was set on FS to exclude most of the debris but to include all leukocytes, especially lymphocytes. The acquisition threshold was set on CD45 for the acquisition of unlysed samples to exclude erythrocytes.
2.4 Data analysis and gating
Data analysis was performed using Kaluza software (Beckman Coulter). FS and SS were used as untransformed linear values; fluorescence channels were transformed to a logical scale. The gating strategy used for identifying different cells is summarized in Table 1 and shown in Figure 1.
| Cell class | Color codea | Gating strategy |
|---|---|---|
| Leukocytesb (Leuko) | FS/SS AND SS/CD45 AND Time | |
| Neutrophils | Green | CD16++/CD45+ |
| Granulocytes | Bluec | SS/CD45+ |
| Mono CD14 | Dark brown | CD14/CD45 |
| Monocytes | Light brown | CD4 dim/CD3− AND SS/CD45++ |
| T cells | CD3/CD45++ AND SS/CD3 | |
| T-CD56+ | Dark violet | CD3+/CD56+ |
| T-killer (Tk) | Dark blue | CD8/CD3 AND T cells |
| T-helper (Th) | Light blue | CD4/CD3 AND T cells |
| T-double-negative (Tdn) | Yellow | T cells AND NOT (CD4/CD3 OR CD8/CD3) |
| NK cells | Light violet | (CD16+/CD45++ OR CD56+/CD45++) AND NOT (CD3/CD45++ OR Mono CD14) |
| B cells | Red | CD19/CD3− |
| Lymphocytes | T cells OR B cells OR NK cells |
- a (see Figure 1). If several color codes apply, the color listed first is assigned to a cell.
- b Starting population for all other definitions.
- c Mainly eolosinophils, since neutrophils are already color-coded in green.
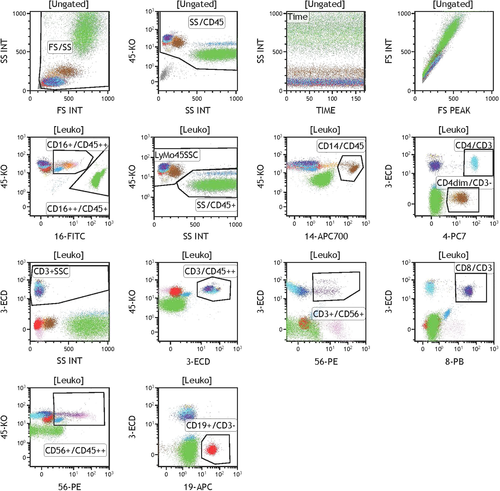
We set three gates, FS/SS, TIME/SS, and SS/CD45, to include all leukocytes (“Leuko”) but exclude erythrocytes and debris. The "Time" gate was set to ensure a uniform measurement and was adjusted if cell counts decreased toward the end of the acquisition. All following gates were based on Leuko. Gates were slightly adjusted in individual samples to fit to the respective populations despite slight differences in staining intensity.
Monocytes were defined in 2 different ways, Monocytes and Mono CD14. The first definition relies on CD3, CD4, CD45, and SS. The second, stricter gating strategy ignores the minor subpopulation of CD14 negative monocytes, but is less prone to technical errors such as overlap with the granulocyte gate or B-cell gate. Gating strategies for all populations are depicted in Figure 1.
The NoL method caused a partial shift of lymphocytes into areas of higher SS. Therefore, we include also lymphocytes with high SS in these samples. The FS INT/FS PEAK dot plot served as quality control to rule out the existence of significant numbers of doublets.
2.5 Analysis of population sizes
Completeness of RBC lysis was calculated as a fraction of Leuko events of all events collected excluding FS low events by an acquisition threshold as described above. We calculated population sizes as fractions of all leukocytes as defined above. We performed control calculations to make sure that any cells are neither omitted nor double-counted and to have an internal quality control for our gating strategy: Granulocytes + Mono CD14 + Lymphocytes = Leukocytes; B cells + T cells + NK cells = Lymphocytes; T-helper (Th) + Cytotoxic T (Tc) + double negative T (Tdn) = T cells. We accepted deviations of less than 1% for lymphocytes and T cells and less than 2% for Leuko control calculations. If variations exceeded this limit, we re-checked and adjusted gates if necessary. The so-called "Bermuda triangle" or “blast region,” defined as CD45 dim/SS low, containing no positively defined cells (ie, blasts and basophils) was part of the Leuko gate. This was specifically checked if the internal control calculation for leukocytes was below 98%.
Considering the leukocyte event counts of 30 000, we defined a lower limit of 0.2% (ie, a minimal cell count of at least 60 cells) for any subpopulation to be included in our comparisons. Populations below this size were not used for the comparison of lysis procedures. This criterion was only relevant in a few samples for the following lymphocyte subsets: B cells, T-CD56+, and Tdn.
Since population percentages showed a wide variation in different individuals, population sizes were analyzed as relative values compared to the reference size for this population. For example if the NoL preparation contained 12% T cells, this was defined as reference = one. Our predefined reference was the NoL method under the assumption that this method would provide results closest to "true" values in vivo. Since the definition of population size was problematic in some samples using the NoL method due to the shift of FS and/or SS, we used the mean value of all methods as additional reference for the “true” population size.
2.6 Statistical analysis
Since most distributions could not be regarded Gaussian as determined by the D'Agostino & Pearson omnibus normality test, we used the Wilcoxon Signed Rank test of significant differences between each data set and the reference of 1. Differences with P-values below .001 were interpreted as highly significant and less than .01 as significant. For the comparison of lysis efficiency, we used the Kruskal-Wallis test with post-test correction (Dunn's multiple comparison test). We used GraphPad Prism 8.3 software (GraphPad Software).
3 RESULTS
We tried to eliminate possible technical gating ambiguity by setting robust gates. Nevertheless, separation of some populations caused problems, mainly after NoL regarding the FS and SS plot, that is, the NoL method led to an unexpectedly wide distribution of FS and SS (Figure S1). For a large part, this may be due to transient doublet formation in the erythrocyte-rich cell suspension, because FS and SS decreased after application of a doublet discrimination gate. Therefore, we include also lymphocytes with high SS signals in measurements of no-lyse samples. Since this might interfere with our attempt to use NoL as reference, we always checked the mean of all methods as a second reference method. However, as predefined in our analysis plan, all primary results below refer to the NoL method as a reference. Results using the methods mean led to similar results (see below).
SS differed between preparations and was increased in FacsL treated samples. This phenomenon was very prominent for eosinophil granulocytes (granulocytes after subtraction of neutrophils, that is, SS high/CD16-cells with CD45 slightly above the neutrophil population). These cells are shifted above the upper SS measurement range in the FacsL preparations and thus seem to be missing from the plots including SS (Figure S1), but are displayed in other plots as separate population with high background staining (eg, CD3/CD8 plot in Figure 1).
Two measurements had to be discarded from the analysis because of failed preparation or individual cell count abnormalities. We decided to include 12 samples only very slightly deviating from our physiological distribution preconditions defined above.
Control calculations “Sum of Leuko" were below 98% in 5 measurements. In all 5 cases, missing cells clustered in the CD45 dim/SS low “Bermuda region,” thus are probably basophils and/or blast cells and biologically plausible.
3.1 Completeness of RBC lysis
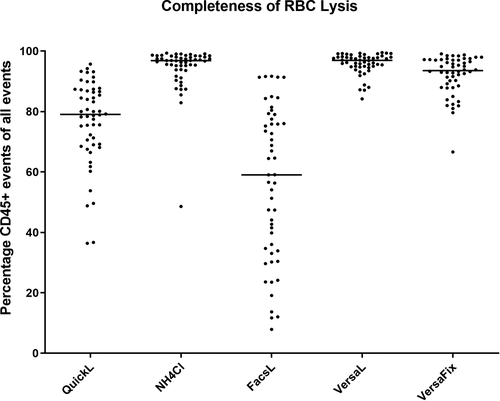
Lysing efficiency was significantly different between the lysis methods (P < .0001). Most efficient lysis of RBC was achieved by VersaL (median Leuko 96.92% of all events) and NH4Cl (96.85%), closely followed by VersaFix (93.55%). In contrast, we observed less reliable RBC lysis with QuickL (79.05%) and FacsL (59.06%), both of the latter methods significantly inferior compared to each of the first three methods (P < .0001 for all comparisons, Figure 2).
3.2 Major leukocyte populations
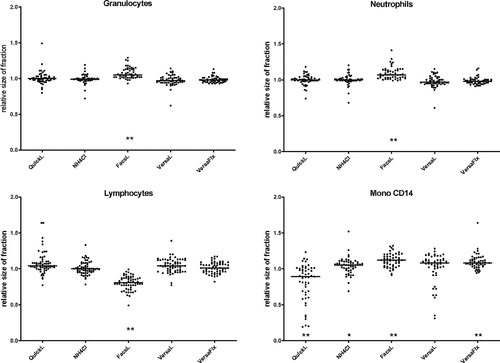
Influence of the lysing strategy upon enumeration of leukocyte population sizes was variable in different samples with a broad overlap and a few outliers. However, some differences were clearly significant. Figure 3 shows the relative population sizes as a percentage of Leuko. The relative number of granulocytes was significantly higher after lysis with FacsL leading to an overestimation of 5% compared to unlysed samples (P < .0001). Similar results were found for neutrophils (+7%). Monocyte results were similar using the definition either including or omitting CD14. In the following, only results using CD14 are shown. Monocytes counts were underestimated using QuickL (−11%, P < .0001), whereas comparable percentages (all above NoL, thus even larger difference to QuickL) were measured using FacsL, VersaL, and VersaFix. The total lymphocyte population was considerably underestimated (−19%, P < .0001) using FacsL. Similar results were found if the mean of all settings instead of NoL was used as a reference (see Figure S2), with the exception of the monocyte fraction, which was measured somewhat smaller with NoL compared to the average of all methods.
3.3 Lymphocyte subpopulations
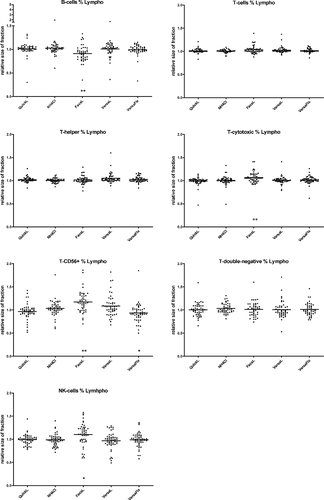
Figure 4 shows the relative size of all lymphocyte subsets (B, T, Tc, Th, Tdn, T-CD56+, and NK) as a percentage of all lymphocytes. For B cells, T-CD56+, and Tdn, we observed very low absolute cell counts in some samples, which led to partial exclusion of the measurements of 9 different samples (B cells: 5 samples, T-CD56+: 3 samples, and Tdn: 4 samples). B-cell counts showed significantly lower values after FacsL (−8%, P = .0002). For T-CD56+ and NK cells, we obtained significantly higher values after FacsL (+15%, P < .0001; +11%, P = .006). After VersaFix, we noted 8% lower values within the T-CD56+ compartment (P = .0019). The other lymphocyte subpopulations as fraction of total lymphocytes were measured with only small differences between lysis strategies. Again, similar results were obtained using the mean of all methods as reference (Figure S3).
4 DISCUSSION
Flow-cytometric quantitation of leukocyte subsets has become an essential instrument in the clinical evaluation of immunological diseases, for example, for the monitoring of CD4 cell counts in patients with HIV infections. The optimal point to start antiretroviral therapy and control of therapy requires exact flow-cytometric determination.1 Other examples are the determination of CD34 counts before stem cell harvest2 or immune deficiency after cytostatic chemotherapy or stem cell transplantation with a special focus on B cells and T-helper cells. For all steps of sample preparation, unwanted losses of leukocytes have to be taken into account. This is especially critical if losses are unevenly distributed across different cell populations. This was described in several publications before.2-5 Washing steps after staining and lysis may increase cell losses. Thus, "no wash" procedures are preferentially used in protocols for quantitation of cell populations, although this may not absolutely necessary, at least with some reagents.10 However, almost all well-established protocols require an erythrocyte lysing step during sample preparation, which still may lead to lysis-induced cell loss. Therefore, some authors suggest no-lyse protocols in order to avoid inaccurate counts.7-9 The aim of this study was to expand investigations of effects of lyses reagents on more different leukocyte subsets using lysis reagents that are frequently used nowadays. In addition, we compared the completeness of RBC lysis.
We found best results in completeness of RBC lysis after treatment with NH4Cl and VersaL, closely followed by VersaFix. In contrast, significantly inferior results with high variability were observed with QuickL or FacsL.
In contrast, Bossuyt et al defined debris after setting a very low forward scatter acquisition threshold, which resulted in very high amounts of debris using NH4Cl and most other reagents.11 However, this strategy is in contrast to common everyday practice to set the forward scatter threshold just sufficiently below the size of the smallest cells expected to be acquired.
Regarding the main leukocyte populations, we found that granulocyte and neutrophil percentages were higher after FacsL compared to unlysed samples. We observed slightly higher numbers of monocytes compared to NoL with all reagents except QuickL. Using the latter, we obtained lower monocyte counts compared to NoL (−11%). The lymphocyte fraction was estimated 19% lower after FacsL. Thus, we observed meaningful differences between major cell populations. In contrast, differences within the lymphocyte compartment were not very pronounced. However, with FacsL, we counted larger fractions of T-CD56+-cells and NK cells and lower fractions of B cells.
Only few publications report data that can be compared directly to the results presented here. Many reports deal only with progenitor cells or blasts,3-5, 7, 9, 10, 12 others describe only effects of lysing reagents that were not part of our study and/or are no longer commonly used.2-5, 9, 13, 14
Different counts of leukocyte subsets after different lysing procedures can either be the result of real differences in cell losses during the procedure or due to shifts in scatter properties or staining intensities leading to different gating and thus only mimicking differences in the composition of cell subsets. As others did before,6, 11, 13, 15 we also observed modifications in scatter properties after different lysis treatments. Most of these differences could be compensated by adjustments of FS and SS detector sensitivities. Nevertheless, positions of main populations remained slightly different. FacsL resulted in inferior discrimination of granulocytes from monocytes in SS/CD45 plots, but better discrimination of monocytes from lymphocytes. It was described by others that FacsL and ammonium chloride-based lysing reagent yielded the best discrimination via scatter prosperities in the FS/SS plot using Becton Dickinson cytometers.15 In our hands, there was no clear "winner" reagent in this regard, using a Beckman Coulter Navios cytometer and SS/CD45 as the major orientation gate. Classification of monocytes was easier and less ambiguous if CD14 positivity was included in the definition of these cells at the price of losing the CD14−/CD16+ subset, but nevertheless including the main monocyte populations, which are CD14++CD16− and CD14+CD16+.16 This led to slightly smaller differences in our reagent comparisons regarding the monocyte fraction. However, overall differences were very similar if CD14 was not included in the definition of the monocyte population.
Unambiguous gating was more difficult with the NoL method due to a less reliable definition of lymphocytes as SS low. Nevertheless, we obtained very similar results using either NoL or the mean of all results as reference for single measurements. Thus, we think that real differences in cell losses are responsible for disparities of subset counts rather than the influence of scatter properties leading to "pseudo-differences" by aberrant gating.
We used a dual platform (2-PF) analysis for counting leukocyte subsets taking the percentage of leukocyte subsets from the FCM and leukocyte counts from a hematological counter (HC) in parallel. Greve et al showed a decrease of absolute Leuko counts after all lysis reagents detected by a one-platform (1-PF) determination using a volumetric system.5
Such a loss of leukocytes evenly distributed across all populations would go undetected because the 2-PF method calculates the absolute number of subsets from their percentage of the CD45 expressing cells. However, we consider an additional homogeneous loss of all populations in our experiments as quite unlikely for two reasons: Firstly, results of lysis reagents overall led to quite similar results, and secondly, one of the reagents (NH4Cl) is routinely used in our laboratory in a single platform assay for counting CD34+ cells, with beads as reference. In these tests, CD45+ events are always compared to Leuko counts from a routine hematology analyzer leading to very similar results (not shown in detail).
Regarding the different lysis reagents side by side, we observed a significant loss of lymphocytes with FacsL, which was most pronounced for B cells and was accompanied by a quite unreliable lysis of erythrocytes. Bossuyt et al found the lowest percentage of lymphoid cells after FacsL, although no substantial differences were found for major lymphocyte subsets, that is, T cells, B cells, and NK cells.11 Other studies found an almost 10% decrease of absolute CD4-cells after FacsL2, 8 detected by a volumetric system. A prior, very small study13 found small losses of lymphocytes after FacsL compared to a NoL method.
RBC lysis was suboptimal with QuickL, which also led to a loss of monocytes. Results of the other reagents were quite comparable. In one study,15 decreased absolute monocyte counts were observed after QuickL similar to our data, although no reduced absolute lymphocyte counts were found after FacsL. However, no sample-wise comparisons but only comparisons of population means are provided in that report not leading to a very clear picture. Formaldehyde-based fixative was discussed to be one reason of the reduced cell counts10, 14, 17, 18 after FacsL in some reports. However, VersaFix also contains formaldehyde-based fixative and does not induce a loss of lymphocytes in accordance with prior studies.4 Thus, we cannot assign the selective cell loss to this specific reagent.
The only practical way to completely avoid lysis-dependent cell loss is to use no-lyse-protocols as it was already described.7-9, 13 Our findings show that a NoL method with a CD45 detection threshold is feasible. A dedicated nuclear stain as described by others5, 7, 9 is not necessary if CD45 is included in the antibody panel and if nucleated red blood cell precursors or non-hematopoietic cells are not of interest or not present in the samples. NoL leads to cell counts that come very close to three of our lysis strategies, NH4Cl, VersaL, and VersaFix. Since large numbers of erythrocytes are still present in the sample, it has to be diluted and acquisition time is considerably prolonged. Furthermore, light scatter properties are changed which complicates cell discrimination in the FS and SS channels. To cope with this phenomenon, we applied a gating strategy including a very wide distribution of SS signals in our study. Application of an FS peak vs. integral gate to exclude doublets is undesirable, because this would also lead to a loss of stained cells, that is, leukocyte-erythrocyte doublets. Taken together, the NoL method as a reference confirmed the results from three of the lysis methods tested, but we would not recommend this strategy as a routine procedure in everyday practice. This holds true especially, if antibody panels are to be used, which strongly depend on the analysis of FS and/or SS for gating purposes.
In summary, our data show that the lysing reagents tested lead to specific deviations in the quantitation of leukocyte subsets and show different efficiency of erythrocyte lysis. Thus, intra-individual follow-up measurements should preferably be performed with the same antibodies, lysis procedure, and instrument settings. Three strategies (NH4Cl, VersaL, and VersaFix) using two different reagents are in good accordance with each other and with a NoL reference method. Quantitation of subpopulations within the lymphocyte compartment is quite similar among all methods. NoL is a feasible alternative to lysis strategies, but entails other disadvantages due to slower acquisition and altered FS and SS signals.
ACKNOWLEDGEMENTS
The author would like to thank the technicians of the hematologic laboratory of Medizinische Klinik 5, University Hospital Erlangen, for their excellent assistance with measurements and data collection. We thank Cytognos for providing a sample of QUICKLYSIS™ for study purposes. The present work was performed in fulfillment of the requirements of obtaining the degree “Dr med.” for KP
CONFLICT OF INTEREST
The authors declare no potential conflict of interest.
Open Research
DATA AVAILABILITY STATEMENT
Raw data are available on request due to privacy/ethical restrictions.


