Simultaneous Bulk-Rock Elemental and Boron Isotope Ratio Measurement Using LA-ICP-MS on Silicate Micro-Particulate Pellets
Abstract
We have established a method for the simultaneous measurement of element abundances and boron isotopic compositions of bulk-rock silicate samples by laser ablation coupled to two different ICP-MS instruments. Fifteen silicate reference materials were prepared as micro-particulate pressed powder pellets (MP) for analysis. Approximately 1/5th of the ablated material was transported to a single-collector ICP-MS for elemental measurement, while 4/5ths were sent to a multi-collector ICP-MS for boron isotope ratio measurement. Compositions of different milling materials (agate, zirconium oxide, tungsten carbide, sintered corundum and silicon nitride) were measured for the evaluation of potential contamination during sample preparation. Determined element mass fractions are in agreement with literature values within ±20%. For boron isotope ratios, the matrix-dependent background elevation across the m/z from 9.9 to 11, and the effect of ablation mass was quantified. Measured δ11B values of most reference materials are consistent with literature values within ±1‰. The intermediate measurement precision is ±0.3‰ for JB-2 with 30 μg g−1 B and ±0.4‰ for JA-2 with 21 μg g−1 B. A publically available, web-based streamlit app was developed for data processing (https://zenodo.org/doi/10.5281/zenodo.11150471). This paves the way for combined, accurate and precise elemental and boron isotope ratio measurements of geological materials.
The two stable isotopes of the element boron, 10B and 11B, differ in their relative atomic masses by approximately 10%. Consequently, boron isotopes strongly fractionate during geological processes and have been widely employed in both low and high-temperature geochemistry. Examples include seawater pH and atmospheric pCO2 reconstruction (e.g., Hemming and Hanson 1992, Hönisch and Hemming 2005, Fietzke et al. 2015, Anagnostou et al. 2016, Jurikova et al. 2019), evaporation and condensation process in weathering environment studies (e.g., Xiao et al. 2007, Gaillardet and Lemarchand 2018), fluid-mineral interaction in subduction zones (e.g., Ishikawa and Nakamura 1993, Rosner et al. 2003, Marschall et al. 2006, 2009, De Hoog and Savov 2018, Xiong et al. 2022, Xu et al. 2022), and cosmochemistry (e.g., Chaussidon and Robert 1995, McKeegan et al. 2000, Liu and Chaussidon 2018, Bekaert et al. 2021, Liu et al. 2023).
A variety of analytical methods have been developed for boron isotope measurements in natural rocks (see Marschall and Forster 2018). Analysis of bulk samples using thermal-ionisation mass spectrometry (TIMS) and multi-collector plasma-mass spectrometry (MC-ICP-MS) has been routinely performed in several studies (e.g., McMullen et al. 1961, Zeininger and Heumann 1983, Lécuyer et al. 2002, Tonarini et al. 2009, Farmer et al. 2016, Forster et al. 2018, Zhu et al. 2021). These analytical approaches provide accurate and highly precise B isotopic ratios of geological samples. However, complex and laborious sample preparation is required (Rae et al. 2011), and boron contamination during preparation is a serious challenge, especially for low-B samples (Kubota et al. 2021). The applications of secondary-ion mass spectrometry (SIMS) and laser ablation (LA)-MC-ICP-MS increased the spatial resolution of measurements, and boron contamination during sample preparation can be minimised (Chaussidon et al. 1997, Le Roux et al. 2004, Marschall and Ludwig 2004, Marschall and Devulder et al. 2015, Monteleone 2015, Fietzke and Wall 2022). Recently, laser ablation ICP-MS has also been employed for the determination of trace element mass fractions in bulk rocks using pellets of pressed sample powder as the laser target (Garbe-Schönberg and Müller 2014, Peters and Pettke 2017, Jochum et al. 2019). The laser ablation split-stream technique provides a powerful tool for the simultaneous coupling of more than one ICP-MS instrument to the laser sampling cell and thus for making elemental and isotopic measurements on the same sample volume (Kylander-Clark et al. 2013, Fisher et al. 2014).
This study establishes simultaneous bulk-rock elemental and boron isotope ratio measurement using LA-ICP-MS on silicate micro-particulate pellets.. Sample powders with micrometre-sized particles were pressed into micro-particulate pressed powder pellets (MP) for analysis. MP of different reference materials was prepared, and bulk-rock major and trace elemental and boron isotopic compositions were measured (quasi-)simultaneously. For B isotopes, the matrix-dependent elevation in the mass spectrometer background signal needs to be corrected. In particular, the ablation mass discrepancy between reference material and unknowns needs to be considered. The accuracy, precision and reproducibility of our method are evaluated. Although the split-stream approach is not crucial for the analyses of MP, it helps to establish the method and sets the stage for a future application on chemically and isotopically zoned mineral and rock samples.
Micro-pellet preparation
Reference materials
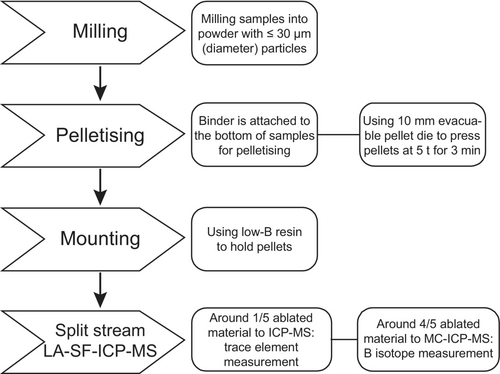
We utilised fifteen geological powder reference materials encompassing a variety of silicate rocks for our study. This included two ultramafic rocks (PCC-1 and JP-1), eight mafic rocks (B5, JB-2, BHVO-1, BHVO-2, BCR-1, BCR-2, BIR-1 and W-2), four intermediate and felsic magmatic rocks (JA-2, B6, JG-2 and JG-1a) and one sedimentary rock (B8). These materials were processed into micro-particulate pressed powder pellets (MP) for analysis (see Figure 1). We note that some of these reference materials are no longer available to the community as the suppliers' stock has been exhausted; yet, those materials were still included in this study to enable a comparison with previously published studies. In addition to these powder materials, our analysis included basaltic glass reference materials (GSC-1G, GSD-1G), carbonate nano-particulate pressed powder pellets (MACS-3 and JCp-1), and apatite crystal (Durango apatite). All reference materials are listed in Table 1.
| Sample ID | Sample type | Locality | Provider | |
|---|---|---|---|---|
| 1 | PCC-1 | Peridotite powder* | Austin Creek, California, USA | USGS |
| 2 | JP-1 | Peridotite powder | Horoman peridotite, Horoman, Hokkaido, Japan | GSJ |
| 3 | B5 | Basalt powder | Etna volcano, Sicily, Italy | IGG |
| 4 | JB-2 | Basalt powder | Oshima volcano, Oshima island, Tokyo, Japan | GSJ |
| 5 | BHVO-1 | Basalt powder | Kilauea caldera, Hawaii, USA | USGS |
| 6 | BHVO-2 | Basalt powder | Kilauea caldera, Hawaii, USA | USGS |
| 7 | BCR-1 | Basalt powder | Columbia River Group, Bridal Veil Flow Quarry, Washington, USA | USGS |
| 8 | BCR-2 | Basalt powder | Columbia River Group, Bridal Veil Flow Quarry, Washington, USA | USGS |
| 9 | BIR-1 | Basalt powder | 12 km east of Reykjavik, Iceland | USGS |
| 10 | W-2 | Diabase powder | Bull Run Quarry, Fairfax county, Virginia, USA | USGS |
| 11 | JA-2 | Andesite powder | Goshikidai sanukitoid, Sakaide, Kanagawa, Japan | GSJ |
| 12 | JG-1a | Granodiorite powder | Sori granodiorite, Azuma-mura, Gunma, Japan | GSJ |
| 13 | JG-2 | Granite powder | Naegi granite, Hirukawa-mura, Gifu, Japan | GSJ |
| 14 | B6 | Obsidian powder | Lipari Island, Aeolian Archipelago, Italy | IGG |
| 15 | B8 | Clay powder | Pliocene clay, Montelupo, Tuscany, Italy | IGG |
| 16 | GSC-1G | Basalt glass | Box 25046, MS 963, Denver, Colorado 80225, USA | USGS |
| 17 | GSD-1G | Basalt glass | Box 25046, MS 963, Denver, Colorado 80225, USA | USGS |
| 18 | Durango apatite | Apatite crystal | Penascos De La Industria, Cerro de Mercado, Durango, Mexico | Dr. David Chew |
| 19 | MACS-3 | Carbonate nano-pellet | Box 25046, MS 963, Denver, CO 80225, USA | USGS |
| 20 | JCp-1 | Coral nano-pellet | A recent Porites sp. coral from Ishigaki Island | Dr. Dieter Garbe-Schönberg |
- * Strongly serpentinised and partially replaced by carbonate.
Micro-pellet preparation
Standard sample preparation techniques (e.g., vibrating disk mill or ball mill) produce micrometre-sized (≤ 30 μm grain diameter) fine material of geological samples. Utilising a planetary micro mill (Fritsch Pulverisette 7) allows to produce nanometre-sized powder. However, this method poses the risk to contaminate the sample with abraded material from the milling balls or the use of water during milling (Kubota et al. 2021). We analysed five different materials available as milling balls from Fritsch to determine their chemical composition and to evaluate their potential as a source of contamination: agate (99.9% SiO2), zirconium oxide (94.2–95.2% ZrO2), tungsten carbide (88% WC sintered with 12% Co), sintered corundum (99.651% Al2O3) and silicon nitride (91% Si3N4 and 9% (Al,Y)2O3).
Contamination from milling balls depends on various factors, including milling duration, the mass ratio of sample material to milling balls, element mass fractions in both, and the abrasion resistance of the milling materials. To optimise our method for the analysis of small sample aliquots (≤ 1 g total material available), we are evaluating the contamination effect specifically for small sample sizes. The milling procedure used was as described by Garbe-Schönberg and Müller (2014) and high-purity water with less than 40 pg g−1 B was used. The results are shown and discussed in the next chapter, but they were not satisfactory. Therefore, we utilise powders with a micrometre-range grain size obtained from the regular rock milling process combined with slow milling by pestle and mortar.
The maximum grain size of the powder is typically ≤ 25 μm. The sample powder is placed into a 10 mm diameter evacuable pellet die and affixed with a binder on the rear side. BOREOX is used as a binder, a non-toxic organic material produced by FLUXANS XRF Application Solutions. Individual pellets are formed using approximately 100–200 mg of sample powder, pressed at 50 kN (5 tonnes) for 3 min. The binder serves as mechanical support for the sample powder on the bottom of the pellet, and is not sampled during laser-ablation. It was observed that the binder penetrated approximately one third of a millimetre into the sample (approximate thickness of the pellet is 1 mm). However, initially this led to mechanical weakness of the pellets and the formation of cracks between the sample powder and the part of the pellet that contained the binder. The pellets were, therefore, further reinforced by embedding them in epoxy resin (Figure 1).
Method
Split stream LA-SF-ICP-MS
Simultaneous measurements of major and trace elements, as well as boron isotope ratios were conducted using a split-stream LA-SF-ICP-MS set-up at the Frankfurt Isotope and Element Research Centre (FIERCE) at Goethe Universität Frankfurt. A RESOLution LR 193 nm ArF laser ablation system (formerly Resonetics LLC) was coupled to an Element XR ICP-MS (Thermo Scientific) for elemental measurement, while boron isotope ratio measurement was performed using a Neptune Plus MC-ICP-MS (Thermo Scientific) (Table 2).
| Laser ablation system: RESOlution LR (S-155 cell) | |
| Beam | UV 193 nm (ArF excimer) |
| Beam diameter | 90/130/285 μm circle, or 235 μm square |
| Repetition rate | 10–14 Hz |
| Energy density (fluence) | 2–3 J cm−2 |
| Ablation time | 25 s |
| Background | 20 s |
| Transport tubing | Nylon-6 |
| He gas flow | ~ 800 ml min−1 (optimised daily) |
| N2 gas flow | ~ 8 ml min−1 (optimised daily) |
| ICP-MS: Element XR | |
| Sample/skimmer cone | Ni Jet / H |
| RF power | ~ 1300 W (optimised daily) |
| Ar auxiliary gas | 0.73 l min−1 |
| Ar sample gas | ~ 1 l min−1 |
| Ar cooling gas | 16 l min−1 |
| Sample/skimmer cone | Ni Jet / H |
| Detection mode | Counting, Analogue or Faraday |
| Mass resolution | Low mode (around 400) |
| Oxide molecular | 238U16O/238U < 0.5% |
| MC-ICP-MS: Neptune Plus | |
| Sample/skimmer cone | Ni Jet / X |
| RF powder | ~ 1350 W (optimised daily) |
| Ar auxiliary gas | 0.71 l min−1 |
| Ar sample gas | ~ 1 l min−1 |
| Ar cool gas | 16 l min−1 |
| Mass resolution | Low mode (around 400) |
| Cup configuration |
10B, 11B on L3, H4 9.94, 10.05, 10.87, 10.93 on L4, L2, H2, H3 |
| Amplifiers | 1013 Ω on L4, L3, L2 and H4, 1011 Ω on H2 and H3 |
The RESOlution LR was equipped with the large, two-volume Laurin Technic S-155 ablation cell. Ablation took place in a He atmosphere to which Ar and N2 sample gases were admixed in the upper funnel. The large laser beam size was predominantly used employing a 285 μm diameter circle or a 235 μm wide square for most samples. Smaller (circular) spots were used for shale B8 (130 μm diameter) and for obsidian B6 (90 μm diameter) to account for their higher boron contents considering that the maximum signal using a 1013 Ω amplifier is approximately 490 mV. Ablation with the laser was performed at a frequency of 10 to 14 Hz and a fluence of about 2.5 J cm−2, resulting in a mean drill speed of approximately 0.7 μm s−1. The ablated material was directed to the mass spectrometers using a glass Y-connector and Nylon-6 tubing with inner diameters of 1.7 and 2.5 mm were connected to Element XR and Neptune Plus, respectively. The flowing of fluid should follow Hagen-Poiseuille law, which means the volumetric flow rate is to the fourth power of the radius, and proportional to the length of pipe. Before the mass spectrometers were connected together, they were each individually connected to the laser and their signal was optimised by the lenses and the gas flows. Based on this, the sensitivity for each mass spectrometer was calculated. During split stream analysis, the exact gas flow parameters (Ar, N, He) were adjusted by using three independent Ar gas flow controllers. The proportion of the splitting (4/5 to 1/5) was estimated from the comparison of 11B signal intensities before and after splitting of the Neptune Plus and the Element XR, respectively.
While He and Ar gas flow were kept constant, N2 flow, RF power and electronic lenses of the mass spectrometers were optimised during the ablation of NIST SRM 612 glass with a 90 μm spot line scan at 6 Hz laser pulse frequency, 3 J cm−2 fluence and 3 μm s−1 scan speed. The tuning was optimised daily to achieve maximum B signal at low oxide formation and low Ar4+ production in the Neptune Plus. All analyses were run in automatic mode in sequences of up to 500 analyses following a standard-sample-standard bracketing procedure, involving duplicate measurements of a reference material after every fifty analyses. Each spot analysis took 45 s, with 0.25 s integration time, 25 s of ablation, and 20 s of gas blank analysis. Pre-ablation (2 s) followed by 20 s wash out was conducted to minimise potential surface boron contamination.
The Element XR equipped with a Jet interface was also tuned during the ablation of NIST SRM 612 glass with a 60 μm spot line scan at 6 Hz laser pulse frequency, 3 J cm−2 fluence and 3 μm s−1 scan speed for high signal-to-background ratio, minimal Th to U fractionation (Th/U ≈ 1), and low oxide production (238U16O/238U < 0.5%) to ensure optimal conditions for analysis. Major element isotopes including 23Na, 25Mg, 27Al, 29Si, 44Ca, 49Ti, 55Mn, and numerous trace element isotopes (7Li, 11B, 45Sc, 51V, 59Co, 62Ni, 63Cu, 66Zn, 69Ga, 72Ge, 75As, 85Rb, 88Sr, 89Y, 90Zr, 93Nb, 115In, 118Sn, 121Sb, 133Cs, 138Ba, 139La, 140Ce, 141Pr, 146Nd, 147Sm, 151Eu, 157Gd, 159Tb, 161Dy, 165Ho, 167Er, 169Tm, 173Yb, 175Lu, 178Hf, 181Ta, 205Tl, 208Pb, 209Bi, 232Th, 238U) were measured in this study. For measurements of isotope mass fractions, signal recording was performed in triple detector mode (Faraday, analogue and counting mode) calibrated individually for each detector.
The data-reduction process for major and trace elements was conducted offline using the LADR program by Norris Scientific. After background subtraction, intra-sequence instrumental drift was corrected utilising regressed functions calculated from the basaltic reference glasses GSC-1G, BHVO-2G or BCR-2G (Table S3 and Table S4). Following this correction, signal intensities of the measured elements underwent normalisation using an internal reference isotope. Various isotopes were used as internal reference for elemental data correction, chosen based on their compositions. For instance, 29Si served as the internal reference isotope for MP of mafic reference materials, agate and silicon nitride, whereas 91Zr was used for zirconium oxide, 58Co for tungsten carbide, and 27Al for sintered corundum.
In the first step, the gas blank is subtracted from all measured intensities on the different Faraday cups. Then, the bulge effect on 10B and 11B is corrected. Subsequently, the isotope ratio is calculated from the background- and bulge-corrected 10B and 11B intensities. Scattering of the data points caused by strong signal fluctuation, e.g., due to non-uniform material ablation (start/end of ablation, porosity, etc.) is automatically filtered out using the 2s outlier test based on the 11B/10B ratio.
11B signal intensities of the reference materials dropped by 10–20% within 500 spots of one measurement session. Instrumental drift correction over ca. 10 h of analyses was carried out based on isotope ratios obtained from the reference material. Specifically, the B5 MP served as the reference material for MP, whereas NIST SRM 612 glass was utilised as the reference material for measurements of milling balls (agate, sintered corundum, and silicon nitride).
A data reduction routine for boron isotope measurements
All data were processed automatically using an in-house Macro-based Microsoft Excel program. To make boron isotope data processing reproducible, standardised and more accessible to a wider community, a Python program was developed, and implemented into a web-based Streamlit app, which can be accessed at https://boron-reduction.streamlit.app/. The code was documented in Zenodo (https://zenodo.org/doi/10.5281/zenodo.11150471), which can be further modified and reused under MIT licence. In addition, a comprehensive documentation on how the program works and how to use it is available on www.geoplatform.de (go to Mass Spectrometry, and on the sidebar select B isotopes). The online tool allows users to upload their data and perform boron isotope data reduction according to the process described above. All results for reference materials and samples can be evaluated on the platform, and processed results can directly be downloaded. We hope that this case study will help the transition from isolated local data processing solutions towards open and reproducible research software following FAIR (Findable, Accessible, Interoperable, Reproducible) principles for mass spectrometer laboratories.
Results and discussion
Milling materials
Contamination during the preparation of geological samples is a critical factor for the quality of geochemical analyses, especially for B isotope measurement in low B-content basalts. During MP preparation we used high-purity water with less than 40 pg g−1 B for cleaning all materials and during the grinding process in the Fritsch mill. The epoxy resin used for mount preparation also contained very little B, i.e. < 0.1 μg g−1. The B content of the binder (BOREOX) was estimated to be very low at approximately 0.5 μg g−1 (signal intensities are listed in Table S6). The geometry of the MP and the shallow ablation depth (around 14–19 μm in depth) also render it unlikely that the binder was co-ablated with the sample powder. Therefore, only the material of the grinding balls remained as a possible source of sample contamination. The five types of milling balls were polished and analysed (Figure 2, Table S2).

Zirconium oxide exhibits the lowest B contents (0.29 ± 0.03 μg g−1), but also the highest mass fractions for most other trace elements, and a negative Eu anomaly (Eu/Eu* = 0.1) (Figure 2). In particular, Th, U and Hf (130, 286, and 17,130 μg g−1, respectively) are highly enriched in zirconium oxide. In contrast, agate and silicon nitride show substantially lower levels of most trace elements, yet their B contents (42 and 159 μg g−1, respectively) are notably higher. Agate also exhibits a positive Ce anomaly (Ce/Ce* = 196). Tungsten carbide and sintered corundum have low B contents (1.5 ± 0.2 and 0.63 ± 0.15 μg g−1, respectively). Notably, tungsten carbide displays an enrichment in transition metals, such as Co (12% m/m), Ni (2606 μg g−1), V (452 μg g−1) and Cu (20 μg g−1). δ11B values for sintered corundum, silicon nitride and agate are -0.8 ± 1.2‰, +0.1 ± 0.4‰ and +4.8 ± 0.6‰, respectively (Table S7).
The effect of contamination of different milling-ball materials on the B isotope composition of a normal Mid-Oceanic Ridge Basalt (N-MORB) as the target sample ([B] = 1.19 μg g−1, δ11B = -7.1‰, Marschall et al. 2017) was evaluated through mass balance (Figure 3). Even a relatively small addition of 2% by mass of milling ball material can significantly alter the boron isotopic composition of the N-MORB rock powder (Figure 3). These modifications vary with the boron content and B isotopic composition of the sample. Tungsten carbide and sintered corundum, with low boron contents, represent potentially ideal materials for boron studies. However, the enrichment of transition metals in tungsten carbide is problematic, since many of these are trace elements of geochemical interest.
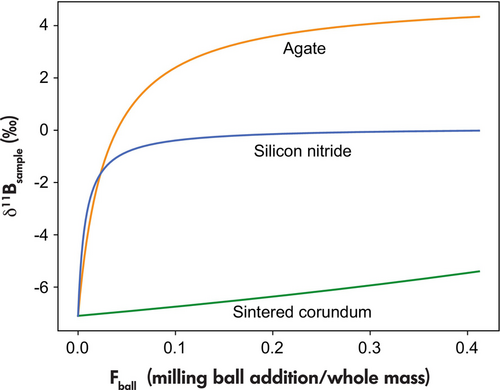
Sintered corundum has very low trace element contents including B. Yet, the potential level of contamination also depends on the abrasion behaviour of the milling ball materials. Our experiments show that sintered corundum has a much lower abrasion resistance compared with agate. Milling was performed over 1 h at 900 rotations/minute in the Fritsch Mill and the abrasion was estimated by weighing milling beads and sample material before and after the milling procedure. At 1 and 3 g sample quantities, the abrasion of the sintered corundum was up to 0.4 g and 0.15 g respectively. Thus, the contamination by sintered corundum beads is approximately a factor of eight times larger at 1 g relative to the 3 g sample material. It thus appears that sintered corundum is the most suitable grinding material for the preparation of samples with quantities of ≥ 3 g.
Agate shows a more than ten times lower abrasion; yet, we have ruled it out as a possible grinding material for the preparation of nano-pellets due to its high B content and rather contrasting isotope composition compared with MORB. Already 3% contamination from the agate would contribute 50% of the B in a rock powder prepared from a sample with a B mass fraction equivalent to N-MORB (Figure 3; F = 0.03 is equivalent to 3% milling-ball addition). Based on these results, the preparation of nano-pellets using a Fritsch mill is unsuitable for combined element and B isotope measurement for samples with low B contents and small sample quantities (i.e., much less than 3 g of sample powder).
Major and trace elements
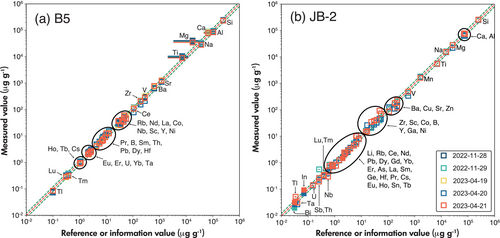
The mass fractions of major and trace elements listed for each element are mean values of 15 to 20 spot analyses on the MP (with 2SE uncertainties: Table S5). JB-2, BHVO-1, BHVO-2, BCR-1, BCR-2, BIR-1, JA-2, and W-2 are reference materials with well-documented trace element abundances. Since B5 is used as the reference material for B isotope data correction, its trace elements were listed as well; yet the major and trace element composition of B5 is not well documented in the literature. Figure S1 provides the measured element mass fractions of these eight reference rock powders compared with their reference or information values compiled in the GeoReM database (Jochum et al. 2005). For most elements and reference materials, our results agree with the reference and information values within a range of ±20%. A few elements in some reference materials fall outside of this range, but in most cases, this still correlates with the variability of values previously reported in the literature (Figure S2). However, there are some exceptions, where the values we measured lie outside ±20% of the rather consistent literature values. These are outlined in Table 3. For example, we consistently underestimated the Ti contents of BCR-1, BCR-2 and W-2, while the Mg contents of BHVO-2 and BCR-2 are too high. In addition, the B, As, Sb and Bi mass fractions in some reference materials show considerable offsets from their reference or information values, with deviations of -58% to +111%.
| Samples | Ti | Mg | B | V | As | Sb | Ta | Bi |
|---|---|---|---|---|---|---|---|---|
| JB-2 | -25% | +58% | -25% | |||||
| BHVO-1 | +111% | -36% | ||||||
| BHVO-2 | +28% | +87% | ||||||
| BCR-1 | −37% | +63% | -32% | |||||
| BCR-2 | -41% | +39% | ||||||
| BIR-1 | -74% | |||||||
| W-2 | -36% | |||||||
| JA-2 | -25% |
Commonly, major elements are very well determined for most reference materials by combining different methods (XRF, solution ICP-OES). So, the literature values for these elements should be considered very robust, and the observed offset likely is caused by analytical inaccuracy or sampling bias in our set-up for these elements in these particular samples. Underestimation of Ti (BCR-1, BCR-2, and W-2) and overestimation of Mg (BCR-1, BCR-2) could be caused by polyatomic compound interferences (e.g., 36Ar13C+, 36Ar12CH+). However, since the offsets are only observed in some samples and not in others, it seems more likely that it is caused by the heterogeneity of the MP, i.e., the variability in the grain sizes of the different fragments.
Generally, trace element determinations show a repeatability of 5–10% in the different reference samples during one measurement session. In the case of W-2, however, several elements (Cu, Zr, Hf, Sn, Sb, Th, and U; Figure S2 (i)) display high intermediate variability, reaching up to ±20%, which also points to heterogeneity of the MP, related to particle size distributions.
The elements B, As, Se, In, Sb, Te, Tl and Bi are summarised here as geochemically volatile. They are volatile in the laboratory environment (such as acid digestion and evaporation) and occur at very low mass fractions in most silicate rocks. There are typically a very limited number of studies that report mass fraction data for these elements. Yet, they are valuable tracers of fluid–rock interaction processes and are thus of growing interest to geochemists (e.g., Noll et al. 1996, Deschamps et al. 2010, Xu et al. 2022). To date, published values have large uncertainties and are typically labelled as information values rather than as reference values in GeoReM (e.g., Peters and Pettke 2017). We thus suggest that mass fractions of these elements from our study provide a valuable contribution and support the quality of the existing databases for these reference materials.
To report the (long-term) intermediate measurement precision of our measurements we normalised the mean values of each day to reference or information values for B5 and JB-2 (Figure 4, Table S5). Our observations for most elements reveal consistency, maintaining an intermediate precision level within the range of ± 5–10%. Exceptions are the HFSE elements, such as Zr and Nb in some measurement sessions, which again are best explained by some heterogeneity of the MP. All in all, some heterogeneity of some elements in the MP was observed, which was difficult to avoid without extended wet-milling (e.g., Garbe-Schönberg and Müller 2014). However, the wet-milling process was avoided in order to reduce potential B contamination.
B isotopes
The bulge effect between m/z 9 and 11 has been reported in previous studies (Sadekov et al. 2019, Standish et al. 2019, Evans et al. 2021, Fietzke and Anagnostou 2023), and identified as a possible source for inaccuracy of B isotope ratio determination via LA-MC-ICP-MS. It is reported that the baseline signal intensity is elevated close to 10Ar4+ and 10B+. During the ablation of sample material, there is a further broad bulging around the m/z range 9 to 11, also with a maximum near m/z = 10. This was explained by scattered ions of Ca and Ar (Sadekov et al. 2019). This bulge effect can be reduced by plasma tuning, but it cannot be eliminated entirely (e.g., RF power and Ar flow, Fietzke and Anagnostou 2023). For corrections of the bulge effect, different approaches were proposed. First, the B/Ca ratio is connected with the intensity of the bulge effect, which was used for bulge effect correction (Standish et al. 2019, Evans et al. 2021). Second, the off-peak baseline can be measured (at ~ 9.95 and 11.04 mass), and finally, the on-peak contributions from the elevated baseline were calculated using estimated factors (Sadekov et al. 2019).
A mass scan from our study between m/z = 9.82 and 11.2 confirms that the bulge predominantly peaks near the 40Ar4+ and 10B peaks, diminishing in intensity towards lower and higher m/z values (Figure 5, Table S12). Notably, this baseline elevation exclusively affects the Faraday collectors due to scattered ions of possibly Ar, Ca, but also other ions. The full-sized SEM behind the Faraday cup L5 has a background at 9.90–9.95 of less than 20 cps, and is thus not elevated at all. However, the CDD-type (compact discrete dynode) ion counters, which are located directly left and right of the L5 cup, show a background level above 5000 cps at the same mass range.
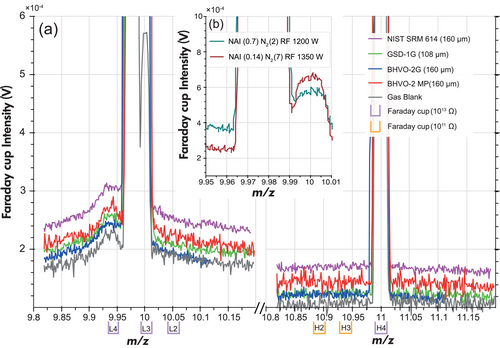
On the Faraday cups, the extent of the bulge varies with spot size (ablation volume) and depends on sample matrix and chemical composition, e.g., it is higher during the ablation of SiO2-rich glass (NIST SRM 614) compared with glasses with a basaltic composition (Figure 5a), both with similar Ca contents. Hence, during ablation of silicate samples the bulge effect cannot be solely explained by some Ca interference. We also observed that the intensity of the bulge shrinks with higher RF power and higher N2 gas flow, resulting in a lower NAI (normalised argon index). The NAI is defined as NAI = 2 × 38Ar/40Ar2 and quantifies the balance between Ar ionisation and Ar2 cluster ion formation (Fietzke and Frische 2016, Figure 5b). Therefore, the ICP setting has a significant influence on the bulge effect, and it is recommended to work with higher RF power and lower Ar sample gas. The latter is achieved through the addition of more N2.
The baseline elevation on 10B is two to three times more intense than on 11B, i.e., the bulge is much more prominent on 10B. For precise background measurements before and during ablation we use cups L4 and L2 equipped with 1013 Ω amplifiers to detect the m/z ~ 9.94 and m/z ~ 10.05 signals. As only four 1013 Ω amplifiers are installed, Faraday cups H2 and H3 equipped with 1011 Ω amplifiers were used to detect m/z ~ 10.87 and m/z ~ 10.93 signals as monitors of the bulge on 11B. Tau correction factor were determined for each 1013 Ω resistor. Since the shape of the bulge is scanned precisely using Faraday cups equipped with 1013 Ω amplifiers, we have confidence to quantify the bulge effect and collect reliable data.
The accuracy of B isotope measurements depends on the laser beam size and was corrected by the regressed equations between δ11B values and signal intensities on NIST SRM 612 (Martin et al. 2015). We systematically tested this dependency (Figure 6), which we did not report in previous studies (e.g., Evans et al. 2021). Reference materials (GSC-1G basaltic glass, Durango apatite, and JCp-1 and MACS-3 calcite nano-pellets) were measured using different beam sizes from 50 to 193 μm diameter (Table S11). Their ablation mass is calculated as ablation mass = ablation area × depth × density. The depth of the ablation craters was measured using a Keyence VHX-6000 digital microscope. Since the density of JCp-1 cannot be directly measured, 25 ± 5% porosity was assumed for density calculation. Absolute and relative ablated masses were calculated and are shown in Figure S3 and Figure 6 (Table S11).
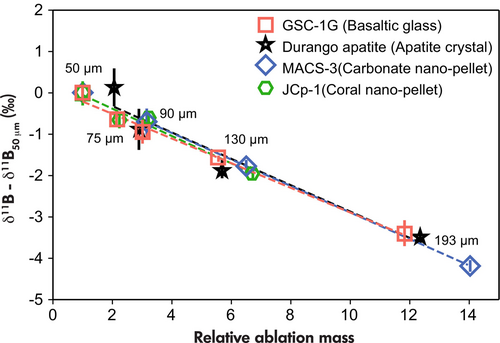
Measured 11B/10B ratios decrease with larger ablation mass (Figure S3). Notably, the apparent δ11B values of individual reference materials exhibit a common and consistent linear relationship with relative ablation mass (Figure 6). This observed dependency appears to remain consistent across various sample matrices. The magnitude of this effect is such that δ11B values not corrected for this effect are approximately 0.5 to 0.7‰ lower when the ablation volume doubles (Figure 6). It is, therefore, recommended to observe the ablation mass discrepancy between reference material and unknowns. Adjusting the laser parameters (e.g., spot size, repetition rate, energy) to obtain similar ablation masses between reference materials and unknowns can help to minimise this effect (e.g., Devulder et al. 2015), and inaccuracy might be introduced by a change in material porosity.
The B isotope measurement results obtained in this study (Table S8, Table S9 and Table S10) consider the bulge effect as well as the ablation-mass dependency, and are displayed in Table 4 alongside published values. Among the fifteen samples analysed, eleven had been previously assessed for their B isotopic composition using a variety of analytical methods. Published B isotope results for reference materials achieved higher consistency over time, especially the ones published since 2010 (Table S1), and data published earlier arguably have to be evaluated with more caution (see Gonfiantini et al. 2003, Aggarwal et al. 2009).
| Sample ID | B (μg g−1) | δ11B (‰) | Range of literature δ11B (‰) | Literature δ11B (‰) | Ref. N | |
|---|---|---|---|---|---|---|
| 1 | PCC-1 | 2.9 ± 0.2 [15] | -0.5 ± 0.9 [15] | +8.2 ± 0.3 | +8.2 ± 0.3 | 1 |
| 2 | JP-1 | 3.1 ± 0.1 [15] | +3.8 ± 1.1 [15] | — | — | — |
| 3 | B5 | 11.2 ± 0.1 [99] | -4.0 ± 0.1 [99] | -6.1 to -0.9 | -4.3 ± 2.3 | 20 |
| 4 | JB-2 | 30.0 ± 0.8 [49] | +7.0 ± 0.3 [69] | +6.8 to +7.9 | +7.0 ± 0.6 | 10 |
| 5 | BHVO-1 | 6.8 ± 0.1 [15] | +3.5 ± 0.3 [15] | — | — | — |
| 6 | BHVO-2 | 5.5 ± 0.1 [12] | -3.8 ± 0.4 [12] | -3.2 to -0.5* | -1.2 ± 1.8 | 6 |
| 7 | BCR-1 | 8.3 ± 0.1 [15] | +1.7 ± 0.3 [15] | — | — | — |
| 8 | BCR-2 | 7.3 ± 0.1 [12] | -6.0 ± 0.4 [12] | -5.9 to -4.4* | -5.2 ± 1.3 | 6 |
| 9 | BIR-1 | 0.5 ± 0.0 [50] | -5.5 ± 0.8 [50] | -1.1 ± 2.0 | -1.1 ± 2.0 | 1 |
| 10 | W-2 | 10.6 ± 0.7 [15] | +8.7 ± 0.8 [15] | +8.1 to +12.2 | +9.0 ± 4.1 | 2 |
| 11 | JA-2 | 21.3 ± 0.5 [38] | -9.0 ± 0.4 [58] | -9.3 to -7.7 | -8.7 ± 1.3 | 3 |
| 12 | JG-1a | 7.6 ± 0.6 [14] | -12.3 ± 0.3 [15] | — | — | — |
| 13 | JG-2 | 4.7 ± 0.3 [15] | -11.8 ± 1.0 [15] | -12.2 to -11.9 | -12.2 ± 0.4 | 2 |
| 14 | B6 | 197.6 ± 1.2 [15] | -2.6 ± 0.3 [15] | -6.4 to -0.5 | -2.6 ± 2.8 | 16 |
| 15 | B8 | 105.7 ± 2.6 [14] | -5.4 ± 0.3 [15] | -7.8 to -4.3 | -5.2 ± 1.8 | 15 |
- Numbers in square brackets in “B (μg g−1)” and “δ11B (‰)” columns are the number of spot analyses.
- Results of Β values from this study are mean values, with two times standard error uncertainties (2s/√n).
- Results of δ11B values from this study are weighted mean values (weighted by the reported uncertainties), and uncertainties are two times the standard errors of the weighted mean (2s/√n).
- Listed literature values are minimum, maximum and mean with two times standard deviations (2s), reflecting the variability of the reported values. Note that the uncertainties reported by individual studies are smaller. Data given in Table S1.
For samples JA-1a, JP-1, BHVO-1 and BCR-1 no B isotope data are available in the literature, and data for these reference materials are provided here for the first time (Table 4). For reference materials that have been frequently analysed in the past, such as B5, JB-2, BHVO-2, BCR-2, W-2, JA-2, JG-2, B6 and B8, our results show boron isotope ratios that are indistinguishable from the weighted mean values calculated from published results. For BIR-1, only one published study is available (reporting δ11B values ranging from -5.0‰ to -1.1‰), which is displayed in comparison with our measured value for BIR-1. Samples PCC-1 and BIR-1 display deviations (8.7‰ and 4.4‰ lower than literature values, respectively) from the values published by a single respective study. All available B isotope data determined here and reported in the literature are plotted in Figure 7. A summary of literature values is listed in Table S1.
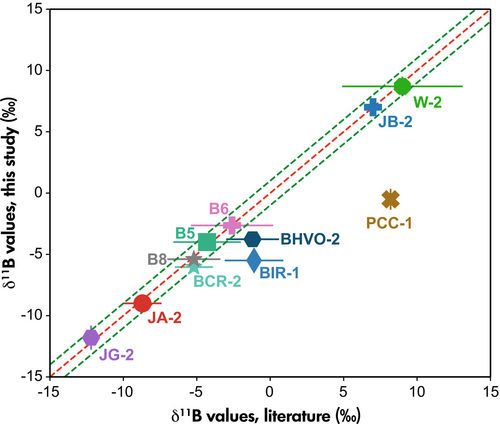
PCC-1 is a partially serpentinised harzburgite with approximately 32% serpentine (lizardite and chrysotile), along with traces of talc and carbonate. Reported B mass fractions of PCC-1 vary by almost one order of magnitude, ranging from 1.4 to 12.8 μg g−1 (Gladney and Roelandts 1987, Govindaraju 1994). It is therefore unsuited as a reference material for boron studies. With an 8.7‰ difference between the δ11B value from this study and the one published δ11B value available for PCC-1 (Zhu et al. 2021), the B isotopic homogeneity of PCC-1 remains suspicious. BIR-1 is a reference material with low B content (approximately 1 μg g−1), introducing inherently larger uncertainties. A mismatch of δ11B values between BIR-1 measured from this study and the published value for BIR-1G could be caused by an aliquot difference of BIR-1 and BIR-1G. In summary, our method demonstrates satisfactory accuracy for most reference materials comparable to solution-based methods (Figure 7).
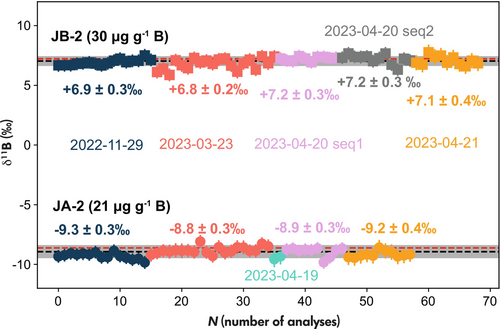
The intermediate measurement precision of B isotopic measurements was assessed through the values obtained for JB-2 and JA-2 across multiple sessions over a six-month period (Figure 8, Table S9 and Table S10). The weighted mean of different sessions for JB-2 is +7.0 ± 0.3‰ and -9.0 ±0.4‰ for JA-2. Our observations indicate the absence of long-term drift in standardised δ11B values and demonstrate an intermediate precision of ±0.3‰ for JB-2 with 30 μg g−1 B and ±0.4‰ for JA-2 with 21 μg g−1 B.
The choice of milling material during pellet preparation is crucial. Whereas most mass fraction measurements and B isotope ratios determined in this study align with literature values, it is noteworthy that MP is slightly less homogeneous than glasses and nano-particulate pellets. However, for geological samples in many cases this restriction is not crucial and is offset by the ability to analyse samples for which a limited quantity of powder is available. Moreover, the approach of measuring both B isotope ratios and elemental compositions simultaneously offers a future application on chemically and isotopically zoned mineral and rock samples.
Acknowledgements
We thank Dr. Richard Albert for his support with the in-house Macro-based Microsoft Excel program, and PhD student Miguel Bernecker for helpful suggestions during the development of our web-based Streamlit app. We also thank the editor Dr. Regina Mertz-Kraus, Ed Williams, and the two reviewers for their helpful and very constructive comments. FIERCE is financially supported by the Wilhelm and Else Heraeus Foundation and by the Deutsche Forschungsgemeinschaft (DFG: INST 161/921-1 FUGG, INST 161/923-1 FUGG and INST 161/1073-1 FUGG), which is gratefully acknowledged. This is FIERCE contribution No. 164. There are no conflicts of interest to declare. Open Access funding enabled and organized by Projekt DEAL.
Scientific editing by Regina Mertz-Kraus.
Open Research
Data availability statement
The data that support the findings of this study are available within the article and supplementary materials.


