Are strong fire–vegetation feedbacks needed to explain the spatial distribution of tropical tree cover?
Abstract
Aim
The spatial pattern of tropical fire-induced tree mortality is partly determined by climate, but feedbacks of tree cover on fire are also important. We re-examine some recent observations proposed as evidence for very strong tree-cover feedbacks on fire, sufficient to allow savanna and forest to be alternative stable states over large areas of the tropics. Two pieces of previously reported observational evidence are examined: (1) the trimodal statistical distribution of tropical tree fraction, and (2) the fact that different tree fractional cover is found at different locations in the tropics with similar rainfall.
Location
Global tropics.
Methods
For point (1) above we analyse the statistical distribution of tree fraction predicted by the logistic equation of tree growth and self-competition, with spatially varying mortality rates. For (2), the relationship between mean annual rainfall and mean net primary productivity (NPP) in a climate model is examined.
Results
(1) A trimodal distribution of tree cover does not necessarily require tree-cover feedback on fire. It can arise from a combination of two factors: nonlinearities in vegetation dynamics and climate-driven spatial variation in mortality (the intermediate fire–productivity hypothesis). (2) Different locations in the tropics can have identical rainfall but significantly different NPP, even with no feedback of tree cover on fire.
Main conclusions
Our results show that strong tree-cover feedback on fire is not necessary to explain observations (1) and (2). However, it is still possible that strong fire–vegetation feedback is the primary explanation – our results do not rule this out. We simply demonstrate the possibility of an alternative hypothesis (of strong climate control). In reality, it is likely that both tree-cover feedback and climate contribute. It is challenging to separate these two effects cleanly. More work is needed to quantify their separate effects. We show that plots of mortality versus productivity are useful tools for understanding spatial variations in tree cover.
Introduction
Fire constrains the current areal extent of tropical forest (Bond et al., 2005; Sankaran et al., 2005), partly by killing trees (e.g. Pinard et al., 1999). Tropical forest trees suffer fire-induced mortality, largely through heating of the vascular cambium (Michaletz & Johnson, 2007) killing above-ground biomass, which may or may not lead to whole-plant mortality (Hoffmann et al., 2012). The future extent of the forest may then be affected by change in fire activity, from two contrasting anthropogenic influences: global climate change and regional land-use change (Coe et al., 2013).
Some clues on future change are available from the current spatial pattern of fire-driven tropical tree mortality (in particular, the decrease in fire from mesic savanna through to tropical forest interiors). Fire behaviour is affected through a series of ‘switches’, depending on fuel connectivity, biomass and moisture (Bradstock, 2010). The current pattern arises partly through two main controls on fire (Archibald et al., 2009): climate and tree cover (other factors such as distance to roads, topography, grazing and the fire tolerance of particular species also play important roles). Wind can also affect the rate of spread (and hence tree mortality), although slow-moving tropical forest fires have high tree mortality rates due to the long heating time involved (Cochrane, 2003).
Climate affects the biomass, type, spatial connectivity and moisture content of grass or leaf-litter fuels (Cochrane, 2003; Krawchuk & Moritz, 2011; Granzow-de la Cerda et al., 2012; Pausas & Ribeiro, 2013; Bowman et al., 2014). In the dry tropics (regions of low vegetation productivity), lack of rainfall limits the biomass or connectivity of grass fuel. In mesic savanna and forest (regions of high productivity), however, the spread of fire is restricted by the moisture content of the fuel (through a limited fuel-drying season). Peak fire, then, tends to occur in regions with intermediate levels of vegetation productivity (van der Werf et al., 2008; Krawchuk & Moritz, 2011; Prentice et al., 2011): the ‘intermediate fire–productivity’ hypothesis (Pausas & Ribeiro, 2013; Bowman et al., 2014). This represents a nonlinear, ‘humped’ large-scale relationship between fire and productivity (see e.g. Fig. 1). This is also seen in the response of fire to climate variability (van der Werf et al., 2008). In dry regions, more rain (especially during the growing season) tends to enhance fire (e.g. in arid central Australia; Murphy et al., 2013). In wet regions, more rain (especially a shorter drying season) reduces fire (e.g. in the Amazon; Brando et al., 2014). At intermediate locations, neither biomass nor fuel moisture is limiting, so the fire–rainfall correlation is weaker.
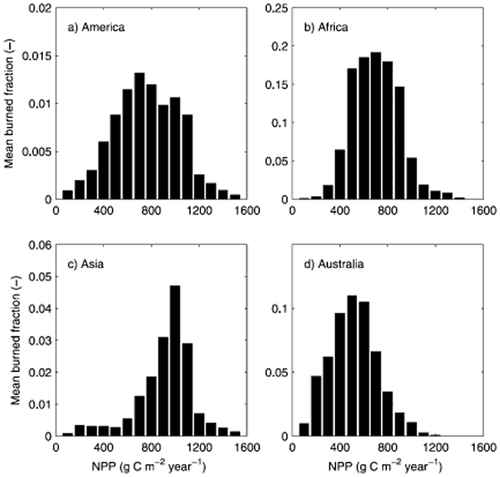
Evidence for the intermediate fire–productivity hypothesis. Mean burned fraction as a function of net primary productivity (NPP), reconstructed from satellite observations. Reproduced with permission from van der Werf et al. (2008).
Tree cover itself also limits the biomass of grass fuels and how dry they are. A closed canopy can suppress light-sensitive C4 grass fuels and maintain higher humidity (Pueyo et al., 2010; Staver et al., 2011a). Both of these effects suppress fire and hence permit greater vegetation growth (positive feedbacks). Many studies have established compelling evidence for important feedback of tree cover on fire activity local to the forest boundary (Cochrane, 2003; Ray et al., 2005; Dantas et al., 2013; Silverio et al., 2013). A sufficiently strong feedback of tree cover on fire can permit high or intermediate tree cover to be alternative stable states for the same climate conditions (Staver et al., 2011a; Moncrieff et al., 2014); mosaic patterns of tree cover are strongly suggestive of this possibility, at least over smaller spatial scales (Bond & Parr, 2010). Thus, the ‘humped’ relationship between fire and productivity (Fig. 1) could partly be controlled by feedback of tree cover on fire.
Separating the influences of climate and tree cover on fire is not straightforward. First, their spatial patterns are partly degenerate: along a rainfall gradient from mesic savanna to forest, increasing rainfall leads to both increased tree cover and increased fuel moisture, both of which suppress fire. For example, Archibald et al. (2009) showed a relatively abrupt decrease in area burned above 40% tree cover in South Africa, apparently suggestive of strong feedback of tree cover on fire. However, their analysis of the main controls over the study region predominantly highlighted environmental factors, such as climate (length of the dry season and annual rainfall) and grazing, rather than tree cover. Uncertainty about how to quantify environmental controls on fire and tree cover is another problem. Neither tree productivity nor the different forms of mortality (both drought and fire-related) are simple functions of rainfall, and many environmental factors contribute (Lehmann et al., 2014). Hence, only approximate estimates are possible (e.g. Murphy & Bowman, 2012). Finally, global observations of fire-induced vegetation mortality are not available. Fire counts or area burned tend to be inferred from observations, but the tree mortality per area burned is not constant (Hoffmann et al., 2012).
It has recently been suggested (Hirota et al., 2011; Staver et al., 2011b; Moncrieff et al., 2014) that feedback of tree cover on fire is strong enough to permit forest and savanna to be alternative stable states across large areas of the tropics. This been inferred over Africa using both observations (Hirota et al., 2011; Staver et al., 2011b) and a model (Moncrieff et al., 2014), albeit for quite different parts of the continent. One key piece of observational evidence here is that the statistical distribution of tree cover in the tropics is trimodal (with peaks at low, intermediate and high tree cover). It has been suggested (Hirota et al., 2011) that this is strong evidence for alternative stable states – an artificial effect of satellite data processing is another possibility (Hanan et al., 2014), although it has been suggested that this may not be a major issue (Staver & Hansen, 2015). A second piece of observed evidence is that both intermediate and high (or intermediate and low) tree cover is found for similar levels of precipitation (Hirota et al., 2011). If the chosen precipitation indices were sufficiently accurate measures of the climate control on tree growth, this would represent evidence for alternative stable states (for given climate conditions).
A key question is whether tree-cover feedback is strong enough to dominate fire behaviour over large spatial scales. For sufficiently high or low rainfall, forest cover is expected to be determined by climate. In the vicinity of the forest boundary, tree-cover feedback can dominate, allowing forest and savanna to be alternative stable states. The spatial scale over which alternative stable states are possible is uncertain, but depends partly on the strength of the feedback of tree cover on fire.
The present study revisits the evidence that feedback of tree cover on fire is strong enough to permit forest and savanna to be alternative stable states across large areas of the tropics, in a similar spirit to the work of Hanan et al. (2014). We ask: are these results only consistent with strong large-scale tree-cover feedback? Could they also be consistent with strong climate control? This is done via a simple model of vegetation competition. We first discuss the basic vegetation competition equation used. We then examine the role of two nonlinear effects that occur even without feedback of tree cover on fire: in the equilibrium solution of the logistic vegetation equation and in the climate-driven intermediate fire–productivity hypothesis. Then, the role of uncertainty in quantifying environmental controls on tree cover is discussed.
Methods
Our study analyses the commonly used logistic equation, which corresponds to the Lotka–Volterra equations reduced to a single dominant fire-sensitive tree species (Mallet, 2012). This section describes how the equilibrium behaviour of this equation may be visualized on plots of mortality versus productivity (or spreading rate) and the two nonlinearities in this equilibrium.
The logistic vegetation equation
 (1)
(1) (2)
(2)If β < m, the equilibrium solution is T = 0, which is stable for this case. Consequently, the stable equilibrium solution (see Fig. 2) of the logistic equation (equation 1) is a nonlinear function of β in two ways. First, there is a jump in the slope at β = m where T goes from the T = 0 regime to the positive T regime. Second, as β grows further, the slope gradually decreases because the self-competition term in equation 1 introduces a T2 dependence.
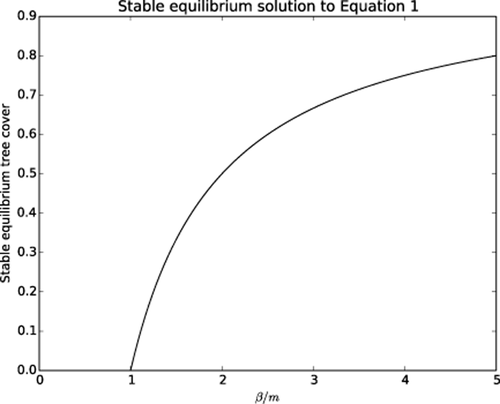
The stable equilibrium solution of equation 1, as a function of the productivity coefficient (β) divided by the mortality coefficient (m).
 (3)
(3)This means that if we plot the mortality coefficient m against the productivity coefficient β (both coefficients will in general vary spatially) then isopleths of constant Teq are straight lines passing through the origin (see the straight black lines in Fig. 3a). The isopleth Teq = 0 follows the line m = β.
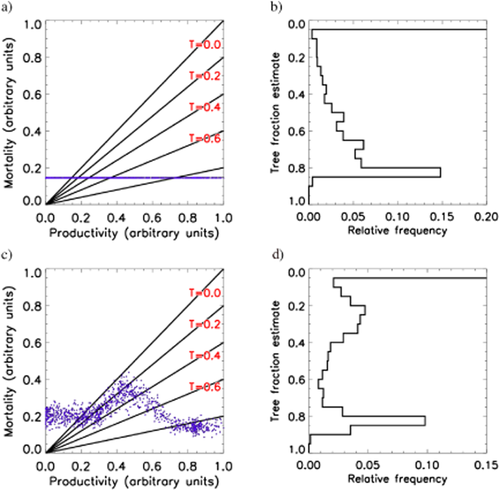
Simple model. Prescribed mortality profile (blue/dark grey dots, left column) and statistical distribution (right column) for two different mortality profiles (top and bottom rows). Left column: y-axis, mortality coefficient; x-axis, productivity coefficient. Each dot represents one location; the straight black lines are contours of equilibrium tree cover, derived from the equilibrium solution of the logistic equation (see Methods). Right column: statistical distribution of equilibrium tree cover corresponding to the mortality profile in the left column.
Optimization procedure: the relationship between mortality and productivity coefficients that gives a trimodal distribution
This section details the optimization procedure outlined in the Results section. The aim of this optimization is to determine a large-scale relationship between m, the mortality coefficient, and β, the productivity coefficient (expressing m as a function of β). This procedure determines the best relationship (yielding a trimodal distribution of the vegetation cover) via a series of iterations. The details are included for completeness. This method contains some subjective choices, but is sufficient for our aim: to show that feedback of tree cover on fire is not the only explanation for the trimodal distribution of tree cover.
For each iteration, a ‘large-scale’ relationship between mortality and productivity coefficients was chosen randomly as follows. Eight values of β were chosen, equally spaced over the range from minimum to maximum β (0 to 1). For each of these eight β values, a value of m was chosen randomly, in the interval from 0 to 0.5 (up to half the maximum value of β). Linear interpolation between the above eight values of β is used to obtain the ‘large-scale’ value of m at any intermediate value of β. Therefore, for each tropical location, a ‘large-scale’ value of m is obtained, based on the specific value of β for that location.
Having obtained a ‘large-scale’ value of m for a given location in the tropics, some ‘small-scale’ random noise is added. This was drawn from a normal distribution, with standard deviation equal to 15% of the ‘large-scale’ value of m. This was chosen to give a plausible level of noise in Fig. 3(c).
 (4)
(4)These steps are repeated multiple times, with the top-scoring model chosen.
Tropical precipitation and primary productivity from HadGEM2-ES
For this study we make use of two quantities from a pre-industrial control simulation of the HadGEM2-ES climate model (Collins et al., 2011; Martin et al., 2011): mean annual rainfall and the net primary productivity (NPP) of broadleaf trees. These quantities are both taken as climate means over tropical land from 20° S to 20° N.
In HadGEM2-ES, spatial variation in NPP is primarily controlled by climate (soil moisture, leaf humidity deficit and temperature), the atmospheric CO2 concentration (fixed in our study) and solar insolation (Cox, 2001). Soil depth is constant. There is some spatial variation in soil quality, with limited effect on NPP. In HadGEM2-ES, broad-leaf tree cover in the tropics is determined by NPP (Cox, 2001). However, the tree cover calculated by the dynamic vegetation scheme in HadGEM2-ES is not used directly in the present study because the mortality coefficient m is fixed in that model: our study investigates the effect of varying m.
Results
A trimodal tree-cover distribution from climate control
Here we show that a trimodal statistical distribution of tropical tree fraction (similar to that observed; Hirota et al., 2011) can arise without feedback of tree cover on fire. This comes from two sources of nonlinearity: in the stable equilibrium solution of equation 1 and in the intermediate fire–productivity hypothesis. We are not arguing that tree-cover feedback is unimportant, just exploring an illustrative extreme case.
Bimodal behaviour with a fixed mortality coefficient: nonlinearity arising from equation 1
We start with the simple case of fixed mortality rate (i.e. m in equation 1 is constant, as in HadGEM2-ES, and some other models; Boulton et al., 2013; Cox, 2001). We show that a bimodal distribution in tree cover can arise directly from the two nonlinearities inherent in the solution for the vegetation equilibrium (Fig. 2).
A statistical distribution of equilibrium tropical tree fraction is calculated from values of the productivity (β) and mortality (m) coefficients for each tropical location. For productivity, we take the spatial pattern of broadleaf tree productivity from HadGEM2-ES, and scale it to fall between 0 and 1 (only the ratio between mortality and productivity is important for this study; see Methods). The same fixed mortality coefficient (m) is imposed everywhere (the particular value chosen is unimportant for our qualitative argument). Equilibrium tree fraction is then calculated for each tropical location, using equation 1. The resulting spatial pattern of equilibrium tree fraction has a bimodal statistical distribution (Fig. 3b), with ‘treeless’ and ‘forest’ modes (there are few locations with intermediate tree fraction).
This result is understood by plotting mortality against productivity – where isopleths of tree fraction appear as straight lines through the origin (see Methods). Figure 3(a) shows that the bimodal distribution occurs (Boulton et al., 2013) due to the two nonlinearities in the vegetation equilibrium solution (see Methods). The first nonlinearity is the restriction that tree fraction is not less than zero. Therefore, all locations where the productivity coefficient is less than the mortality coefficient have zero equilibrium tree cover. There are many such locations, which causes the ‘treeless’ mode in Fig. 3(b). The second nonlinearity arises from self-competition. This means that at high productivity further increases in productivity have little effect on tree cover. Therefore there are many tropical locations with tree cover around 0.8 (Fig. 3b).
Trimodal behaviour with spatially varying mortality: the intermediate fire–productivity hypothesis
We now include the effects of climate-driven spatial variation in mortality. We show that this (combined with the nonlinearities in vegetation competition discussed above) could contribute to the observed (Hirota et al., 2011) trimodal distribution of tropical tree fraction.
Global observations of fire-driven and other forms of mortality are not available to drive our analysis. Area burned is observed, but we cannot assume that tree mortality per area burned is constant (Hoffmann et al., 2012). Instead, we turn the question around: if mortality were purely determined by the environment (i.e. with no tree-cover feedback), can we choose the spatial variation in mortality to produce a trimodal statistical distribution in equilibrium tree cover? The key factor here that controls the statistical distribution of equilibrium tree fraction is the relationship between mortality and productivity, as it is their ratio that determines the tree cover (in this simple model; see Methods).
We test this using a simple optimization procedure. The aim is to identify what kind of relationship between mortality and productivity coefficients could produce a trimodal distribution of tree cover. The productivity coefficient (β) for each location in the tropics is defined as in the fixed-mortality test above. Broadly (details are given in Methods), the optimization chooses the mortality coefficient m for each β. A series of iterations are performed. For each iteration, a ‘large-scale’ relationship between mortality and productivity coefficients is chosen randomly. Then, some ‘small-scale’ random noise is added to obtain the value of m at each location (because mortality is not perfectly related to productivity). Given these values of productivity and mortality coefficients, equilibrium tree fraction is calculated for each grid cell. The resulting statistical distribution of tree fraction is approximately scored according to whether or not it is trimodal. These steps are repeated multiple times. The relationship between mortality and productivity for the top-scoring model is shown in Fig. 3(c), and the corresponding distribution of tree fraction in Fig. 3(d).
This shows that a trimodal distribution, similar to that observed, can arise (Fig. 3d) simply from spatial variation in climate, with no feedback of tree cover on fire. That is, the simple logistic equation of tree growth and self-competition (equation 1) alone can support a trimodal distribution: we did not need to include fire–vegetation feedbacks to obtain this. Further, the type of relationship between mortality and productivity that generates a trimodal distribution (Fig. 3c) is plausible, as it qualitatively matches the intermediate fire–productivity hypothesis (Fig. 1). It is important to note that we did not require Fig. 3(c) to look qualitatively like Fig. 1: this result emerged independently from our analysis.
The trimodal distribution (Fig. 3d) can be understood from Fig. 3(c). The ‘savanna’ mode corresponds to the set of points lying along the T = 0.2 contour in Fig. 3(c). In this zone, both productivity and mortality are increasing (along a rainfall gradient from dry through to mesic savanna). Although both show large changes, their ratio (and hence the equilibrium tree fraction; see Methods) remains roughly constant. Hence, a large range of different locations with quite different climates can have similar equilibrium tree fractions. This is consistent with observational evidence (Sankaran 2005) that in dry savannas, coexistence of trees and grass is stable and limited by rainfall. The trough in the trimodal distribution near T = 0.6 corresponds to the zone where mortality decreases with increasing productivity (from mesic savanna towards rain forest). Here the mortality/productivity ratio decreases rapidly with increasing productivity, so equilibrium tree fraction increases rapidly and there are few locations with T ∼ 0.6.
Hence, the nonlinear ‘humped’ relationship between fire-induced mortality and productivity (the ‘intermediate fire–productivity hypothesis’; Bowman et al., 2014; Pausas & Ribeiro, 2013), combined with nonlinearities in the vegetation equilibrium curve can produce a trimodal distribution of tree fraction, without the need for strong feedback of tree cover on fire. Our results do not prove that climate dominates over tree-cover feedback: this is simply presented as one contribution to the observed trimodal distribution. The quantitative details of this picture are of course sensitive to the interplay between noise and curvature in the relationship between mortality and productivity (likewise, tree-cover feedback is sensitive to details of how the vegetation feedback on fire varies with tree cover).
Uncertainty in the environmental drivers of tree fraction
Here we discuss the observation that both intermediate and high (or intermediate and low) tree cover may be found at different locations in the tropics with similar measures of rainfall (Hirota et al., 2011; Staver et al., 2011b). We emphasize the point (also made qualitatively by Murphy & Bowman, 2012; van Nes et al., 2014) that we do not have a precise measure of environmental control on tree cover. Hence, even if tree cover was completely determined by environmental conditions (including rainfall) we would still find sets of locations with differing tree cover but (for example) the same mean annual precipitation.
We illustrate this point in Fig. 4, first using results from HadGEM2-ES (Fig. 4a). Our analysis follows that of Hirota et al. (2011) (their Fig. 1b), but for a highly idealized case: if tree cover is perfectly determined by the NPP of broadleaf trees as calculated by HadGEM2-ES (i.e. with no feedback of tree cover on fire). To do this, each grid-cell in HadGEM2-ES is assigned a label (either ‘forest’, ‘savanna’ or ‘treeless’), depending only on the NPP of broadleaf trees for that location. Locations with NPP greater than the 79th percentile of tropical NPP were labelled ‘forest’. Hence, 21% of the tropics was labelled ‘forest’. This percentile was estimated from the proportion in the ‘forest’ mode in Fig. 1(b) of Hirota et al. (2011). Similarly, locations with NPP less than the 21st percentile were labelled ‘treeless’ and the rest ‘savanna’.
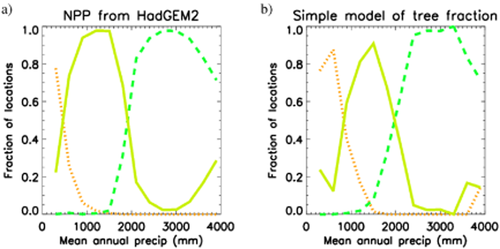
Illustration of how uncertainty in environmental drivers of tree fraction can lead to both intermediate and low tree cover being found at different locations with similar annual mean rainfall. Fraction of tropical locations with (orange/dots) ‘treeless’, (yellow/solid line) ‘savanna’ and (green/dashes) ‘forest’ labels, for given levels of mean annual precipitation. Precipitation for each location is from HadGEM2-ES. The choice of ‘treeless’, ‘savanna’ or ‘forest’ label for each location is based on (a) annual mean net primary productivity from HadGEM2-ES or (b) the simple model of tree fraction in Fig. 3(c) (see details in the text).
As in the observed result (Hirota et al., 2011), Fig. 4(a) shows locations with the same mean annual precipitation but different ‘tree cover’ labels. In our idealized analysis this happens purely because mean annual precipitation is not a perfect predictor of broadleaf NPP (due to spatial variations in seasonal precipitation cycles, temperature, solar irradiance and soil type). The overlap between ‘savanna’ and ‘forest’ and ‘treeless’ and ‘savanna’ curves is significant, albeit less extensive than in the observations of Hirota et al. (2011). Weaker overlap in Fig. 4(a) is expected because the idealized case in Fig. 4 neglects key uncertainties.
One issue neglected in Fig. 4(a) is scatter in the relationship between tree mortality (including both fire and drought mortality) and mean annual precipitation. We therefore repeated this analysis, using exactly the same method (and the same rainfall data as in Fig. 4a) but with tree fraction calculated by the simple model (as in Fig. 3c) used in place of NPP from HadGEM2. This introduces additional scatter (through scatter in the relationship between tree mortality and precipitation; see Fig. 3c). Consequently, the overlap between the ‘forest’, ‘savanna’ and ‘treeless’ curves is increased (see Fig. 4b), and is similar to the observations of Hirota et al. (2011). Other factors could increase this overlap further, such as drought mortality, variable disturbances, soil quality and depth, different tree species and observational error.
Our results do not rule out feedback of tree cover on fire as driving the results of Hirota et al. (2011); they simply present a quantitatively plausible alternative. More detailed measures of climate, including rainfall seasonality, have been included in other studies (Staver et al., 2011b; Murphy & Bowman, 2012). However, no matter how sophisticated the measure of the environmental control on tree cover is, some error will remain. It is in principle not possible to rule out the hypothesis that this error is the reason for finding different levels of tree cover at the same measure of ‘climate’ (Murphy & Bowman, 2012, discuss this ‘chicken and egg’ problem).
Discussion
This study shows that some observations previously presented as evidence for large-scale alternative stable states (Hirota et al., 2011; Staver et al., 2011b) may in fact arise without strong feedback of tree cover on fire. They may instead be caused by nonlinearities in the equilibrium solution for spread of vegetation and in the relationship between tree mortality and productivity (if this relationship is driven by rainfall gradients), along with uncertainties in the environmental controls on tree cover. These nonlinearities arise from fundamental processes, although they are challenging to quantify. While not ruling out tree-cover feedbacks as driving the aforementioned observations, we show that the evidence for them doing so is not as strong as previously thought (in a similar spirit to the study of Hanan et al., 2014). Plenty of evidence exists for feedbacks of tree cover on fire being important, supporting alternative stable states in the vicinity of forest boundaries. However, it is harder to determine the relative roles of climate and influences of tree cover on fire-induced mortality over larger spatial scales.
It is important to understand and quantify these different influences more accurately, to both project and monitor the effects of anthropogenic influence on tropical tree cover. For example, it is unclear to what extent the nonlinear relationship in Fig. 1 is driven by climate (rainfall) gradients as opposed to vegetation feedbacks. It has been suggested that a way forward is to tune DGVMs to observed data (Murphy & Bowman, 2012). Any approach must be based on understanding which aspects discriminate between the influences of climate and tree cover (and other uncertainties). We showed that some aspects of nonlinear vegetation competition and varying mortality may be understood via plots of mortality against productivity (e.g. Fig. 3a,c).
The most obvious discriminant between the influences of climate and tree cover is via internal variability (e.g. van der Werf et al., 2008), as variability in tree cover (particularly re-growth) has a long time-scale. It would also be valuable to apply the analysis of Archibald et al. (2009) including that behind their Fig. 3(b), to other regions, along with further analysis of climate drivers. While observations of productivity are improving, another key gap is global monitoring of tree mortality rates: in particular its interannual variability, including the relationship with both productivity and fire variability. This is important, since the extent of tropical forests is thought to be limited by fire (Bond et al., 2005). The response to extreme dry years would give a clearer idea of forest sustainability under potential future drought. Satellite retrievals are possible (Flores et al., 2014), but represent a large data-processing challenge. It would also seem valuable to monitor the correlation between ‘fire danger potential’ and fire explored by van der Werf et al. (2008): this is currently low in the moist forest interior but could alter with future climate change. Improved monitoring of forest biomass (e.g. the Biomass satellite) will also provide a valuable tool for monitoring forest sustainability.
Potential effects of competition from grasses
The single-species logistic equation used above (equation 1) neglects any effect of competition from grasses on trees (it is unclear if this is important). It is shown below that if grasses are sufficiently vigorous to (mostly) fill the space not occupied by trees, then the distribution of tree fraction may still be modelled by a single-species logistic equation – leaving our conclusions unaltered.
 (5)
(5) (6)
(6) (7)
(7)This is identical to equation 1 except that the productivity is multiplied by the constant (1 – cg). Such a scaling of productivity would not affect the arguments presented below.
Topkill versus whole-plant mortality
 (8)
(8) (9)
(9)In addition to the processes in equation 1, these equations represent competition from topkilled trees on healthy trees (the ctTt term), the rate of topkill that doesn't lead to whole-plant mortality (mtT) and the resprouting rate of topkilled trees (rTt). ct, mt and r are coefficients. Here, T is the area fraction of healthy trees and mwT is the total rate of whole-plant mortality (including fire and other forms).
 (10)
(10) (11)
(11) (12)
(12) (13)
(13) (14)
(14)That is, if mf were plotted against β, the contours of constant T would again appear as straight lines. That is, to achieve constant T fire-related mortality (mf) must increase linearly with productivity (β). This means that our qualitative conclusions about the trimodal distribution of tree fraction would still apply.
Competition between fire-insensitive and fire-sensitive trees
This work was based on assuming a single tree species. It would be useful in the future to extend this study to include competition between fire-insensitive trees (as typically found in fire-prone savanna regions) and fire-sensitive trees (as found in tropical forests). Our results could alter, depending on the parameters for tree growth, mortality and competition specified.
Acknowledgements
P.G. and E.R. were supported by the Joint UK DECC/Defra Met Office Hadley Centre Climate Programme (GA01101). Anna Harper was funded under NERC grant NE/K016016/1: Process-based Emergent Constraints on Global Physical and Biogeochemical Feedbacks. A.M. and R.B. were funded under the EU-FP7 project AMAZALERT (grant agreement no 282664).
References
This research team shares an interest in numerical modelling of the future fate of tropical forests under climate and land-use changes. Interests cover numerical modelling, understanding of processes in models and observations and early warning of abrupt/irreversible forest loss.


