Global fire size distribution is driven by human impact and climate
Abstract
Aim
In order to understand fire's impacts on vegetation dynamics, it is crucial that the distribution of fire sizes be known. We approached this distribution using a power-law distribution, which derives from self-organized criticality theory (SOC). We compute the global spatial variation in the power-law exponent and determine the main factors that explain its spatial distribution.
Location
Global, at 2° grid resolution.
Methods
We use satellite-derived MODIS burned-area data (MCD45) to obtain global individual fire size data for 2002–2010, grouped together for each 2° grid. A global map of fire size distribution was produced by plotting the exponent of the power law. The drivers of the spatial trends in fire size distribution, including vegetation productivity, precipitation, population density and net income, were analysed using a generalized additive model (GAM).
Results
The power law gave a good fit for 93% of the global 2° grid cells with important fire activity. A global map of the fire size distribution, as approached by the power law shows strong spatial patterns. These are associated both with climatic variables (precipitation and evapotranspiration) and with anthropogenic variables (cropland cover and population density).
Main conclusions
Our results indicate that the global fire size distribution changes over gradients of precipitation and aridity, and that it is strongly influenced by human activity. This information is essential for understanding potential changes in fire sizes as a result of climate change and socioeconomic dynamics. The ability to improve SOC fire models by including these human and climatic factors would benefit fire projections as well as fire management and policy.
Introduction
Fire is a key variable in the global earth system, influencing vegetation dynamics (Bond et al., 2005), biogeochemical cycles (Bond-Lamberty et al., 2007) and the emissions of greenhouse gases and aerosols (van der Werf et al., 2010). Fire is an integral part of some biomes, being an essential factor for the functioning of many ecosystems, with a wide range of species having coevolved with fire (Keeley et al., 2011). Nowadays, fire occurrence is heavily influenced by human factors (Bowman et al., 2011), and certain fire regimes can be considered human-driven (Archibald et al., 2013). This is one of the reasons why wildfires are often seen as a negative factor, able to cause damage to ecosystems and human infrastructure (Chuvieco et al., 2014). In recent years, extreme fire seasons have resulted in substantial impacts on human lives and properties in Greece in 2007, in Australia in 2009 and 2013 and in the USA in 2007 and 2013 (Cary et al., 2003; Keeley et al., 2004; Maditinos & Vassiliadis, 2011; Cruz et al., 2012).
The impacts of fires largely depend on the fire's characteristics (e.g. size, heat released, duration and intensity). Larger fires are the result of more extreme conditions (high fuel availability, low humidity, high temperatures and high wind speed) and they are therefore often more intense and have greater impacts than smaller fires, for the same total area burned (e.g. Graham et al., 2004). Furthermore, large fires can have a homogenizing effect on the landscape, influencing the landscape's structure and complexity (Chuvieco, 1999). For this reason, knowing the total burned area is not enough to understand fire impacts on ecosystems, as the same area burned may be related to a few large fires or many small ones. Furthermore, a better understanding of the factors that affect fire sizes is critical for improving current efforts into fire mitigation and reducing vulnerability to fires (Cui & Perera, 2008).
 (1)
(1)The exponent β is often hypothesized to be a unique and ‘universal’ value because of the generic mechanisms that drive the system. One of the recurring observations of all these studies is that the exponent β from empirical size distributions is often larger than the exponent resulting from the fire model, estimates of which typically lie in the range 1–1.5 (Pruessner, 2012); moreover, it exhibits substantial spatial variation. These observations are not in line with the general results of the fire model and with the hypothesis that β is a globally fixed value. Research aiming to identify the factors that cause these variations in fire size distribution is rare. The relationships between the weather and the propagation of individual fires is relatively well-established (e.g. Rothermel, 1972), and the introduction of weather variability allow SOC fire models to better reproduce observations, with exponents that change realistically as a function of weather and that are larger in the aggregate (Pueyo, 2007). Changes in fire size distribution have also been observed as conditions change through the annual cycle in Australia (Yates et al., 2008). The effects of longer-term changes in climate are not well-established. Models suggest that, generally, these are not as intense as the effects of short-term changes, because of the strong self-regulation of the system (Pueyo, 2007), but there is little empirical information that directly links climatic changes to fire size distribution. There are, however, many studies on climate's impacts on other closely related traits of the fire regimes, such as the total area burned. Some of these studies agree with SOC models in suggesting that the observed impacts result from the non-linear interaction between climate and local fuel dynamics (Clark, 1988). Natural landscape fragmentation has also been shown to affect fire size distribution, by decreasing the frequency of large fires (McKenzie & Kennedy, 2012), which is probably also the case under human landscape fragmentation. Modelling studies for Africa suggest that the historical effect of humans on fire was mainly due to landscape transformation by grazing and cultivation, affecting fuel connectivity (Archibald et al., 2012). This is in line with evidence of increasing fire occurrence during the last decades in the western Mediterranean, where fuel connectivity has increased due to the abandonment of traditional practices (Pausas & Fernández-Muñoz, 2012). Practices such as fire suppression, fire ignition and fuel treatments have also been claimed to modify the fire size distribution (Minnich, 1983), although this claim has been disputed (Keeley et al., 1999). The remaining uncertainty on how the fire size distribution changes as a function of external factors is an important knowledge gap in fire science, because this distribution can be considered an expression of the general functioning of fire in the system. It is therefore impossible to understand global fire occurrence without understanding the characteristics and the factors influencing the fire size distribution.
In this study we aim to: (1) test whether the fire size distribution can be described globally using a power-law function; (2) determine the spatial patterns of fire size distribution at a global scale; and (3) determine the global drivers of fire size distribution.
Materials and Methods
Global fire size data
Global data on burned area (BA) were derived from the Moderate Resolution Imaging Spectroradiometer (MODIS) BA product MCD45 (Roy et al., 2008). Data from 2002–2010 were used, spanning nine years of observations. Pre-2002 data was not used, in order to avoid the data-gap of June 2001. This product identifies burned-area pixels at 500-m resolution, and was used because a preliminary validation of different BA products has indicated that it performs well (Roy & Boschetti, 2009). Estimates of the reporting accuracy of burned area detection have also been published recently, and they are generally accurate to within an 8-day interval (Boschetti et al., 2010). The standard MCD45 product provides the date of detection for each pixel. Using the burned patches detected by MCD45 would have produced an overestimate of the individual fire size in some areas, because of the joining of adjacent fires into one burned patch. We therefore used the spatiotemporal flooding algorithm proposed by Archibald & Roy (2009) to try to detect individual fires within larger burned patches. One of the critical aspects of this algorithm is the selection of a time-span over which contiguous pixels are considered part of the same burned patch, or how long a time-span we need to consider to be confident that two contiguous pixels are caused by different fires, taking into account all the limitations of burned-area detection and the limitations on data availability. Using a longer time-span results in fewer separate fires being detected, but also introduces less noise from errors in the original product. The choice of this time-span should therefore seek an equilibrium between increasing the detection probability of the individual fires and introducing noise into the dataset. Archibald & Roy (2009) initially used an 8-day interval over southern Africa, but we observed an artificial increase in the number of fires for some areas (e.g. boreal forest) when using an 8-day interval, probably due to dating errors in areas with persistent cloud cover, a situation in which the burned-area detection algorithm has problems (Roy & Boschetti, 2009). These effects largely disappeared when using a 14-day interval, and so we used this conservative metric for our global analysis. This resulted in a better fit when validating the fire size distribution estimates from MODIS, with an increased r2 (from 0.86 to 0.92) and slope (from 0.80 to 0.87) for the 8-day and 14-day time-step data. The number of fires was grouped together at a global scale on 2° grids, with each fire allocated to a grid cell according to the geographical centre of the fire.
Fire size distribution estimation
 (2)
(2)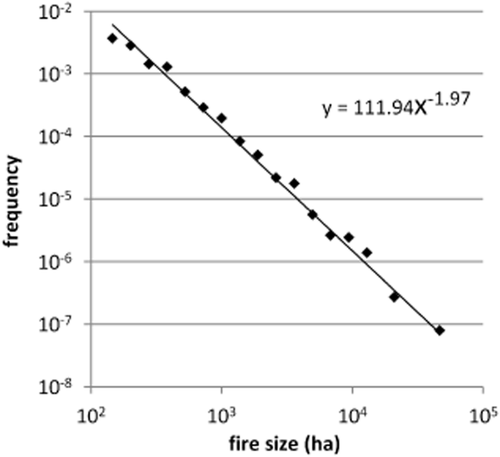
Example of the calculation of the power-law function for an area in Brazil. The points indicate the normalized frequency of fires within each bin, with the power law function given. In this case, β, the indicator of the fire size distribution, is 1.97.
Coarse-resolution burned-area products generally have large omission errors for small fires. We observed that the BA product does not detect most of the smaller fires, in line with Giglio et al. (2009), who considered the minimum detectable burn size to be around 120 ha. Including these partly detected small fires would strongly influence the fit of the power law, so only fires of at least 125 ha (at least five pixels) were included for analysis.
Validation
The global results of the fire size distribution (β) were validated using sets of burned-area perimeters extracted from multitemporal Landsat scenes, following the standard validation protocols (Padilla et al., 2011). These burned-area maps are distributed over eight different regions (Appendix S1 in Supporting Information), covering especially relevant biomes and vegetation types affected by fire occurrence. A total of 73 multitemporal Landsat pairs were processed to extract burned patches. More than 60,000 burned patches were extracted, covering around 8.5 million hectares. More information on the characteristics of this dataset can be found in Hantson et al. (2013). We considered a minimum fire size of 10 ha for Landsat, to take advantage of the large number of small fires present in the database, increasing the robustness of the power-law fit. The β-value of the power law as extracted from Landsat dataset was compared to the β resulting from the 9-year MODIS dataset for the same area.
Analysis of the factors influencing the fire size distribution
A dataset comprising most of the variables that may help explain the fire size distribution was compiled. These auxiliary datasets include climate, land-cover, human, socioeconomic and vegetation-productivity data at a global scale (Table 1). The net primary production (NPP) was extracted from the MOD17 MODIS product (Running et al., 2004) and the mean was calculated for the time-span of our analysis. The cover of agricultural and pasture land for the year 2000 was derived from Ramankutty et al. (2008). Mean tree cover for the time of our analysis was extracted from MODIS vegetation continuous fields (MOD44; DiMiceli et al., 2011). Human population-density data was taken from the Population of the World version 3 from CIESIN for the year 2000 (available at: http://geodata.grid.unep.ch/). Precipitation data were used as distributed by the Global Precipitation and Climatology Centre (GPCC) at 0.5° resolution (Schneider et al., 2011). The ratio of actual to potential evapotranspiration (AET:PET) was calculated from the MODIS global evapotranspiration project (MOD16; Mu et al., 2011). Net income data was extracted per country from the International Monetary Fund (available at: http://www.imf.org/external/data.htm). All data was summarized from its original resolution to 2° grid cells to match the fire size distribution data.
| Code | Units | Description |
|---|---|---|
| Pop_dens | persons km−2 | The mean number of persons per square kilometre |
| AET:PET | 0–1 | The mean ratio between actual and potential evapotranspiration for 2002–2010 |
| precipitation | mm yr−1 | The mean total annual precipitation for 2002–2010 |
| tree | cover (0–1) | Proportion of tree cover in 2001 |
| pasture | cover (0–1) | Proportion of pasture land in 2000 |
| cropland | cover (0–1) | Proportion of agricultural land in 2000 |
| NPP | kg C ha−1 yr−1 | Mean annual amount of carbon sequestered by the vegetation, minus plant respiration, for 2002–2010 |
| Net income | US$ | The net income per capita per year |
We use generalized additive models (GAM) to study the relationships between the fire size distribution and the explanatory variables. These models are especially useful in our case because they do not require a predetermined form for the relationship between the response variable and the covariates, because the smoothing parameter is derived from the proper dataset for each individual variable (Guisan et al., 2002). We added the joint geographical coordinates of each grid for the full model analysis to take into account spatial autocorrelation in β (Preisler & Westerling, 2007). The R package mgcv was used for the GAM analysis (Wood, 2011).
Results
Power-law fit
The fire size distribution could be described with a power law for almost all areas of the globe (Fig. 2). This distribution was rejected in just 7% of the analysed grid cells, at a significance level of 0.05. These grid cells generally had few fires. A good correlation was observed between the β-values as fitted to the MODIS data and those obtained from the Landsat validation dataset (Fig. 3), although the MODIS β-values were consistently larger than the values obtained from the Landsat data.
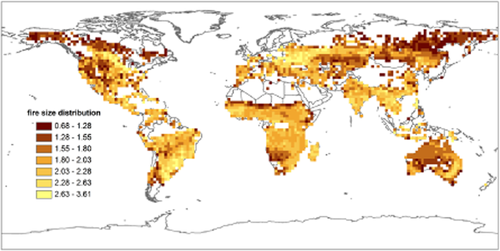
Global map of the fire size distribution as estimated by β of the power law, fitted to the fires in each grid cell as presented in Figure 1. Areas with low or absent fire occurrence, where the power law could not be fitted, are marked in white.
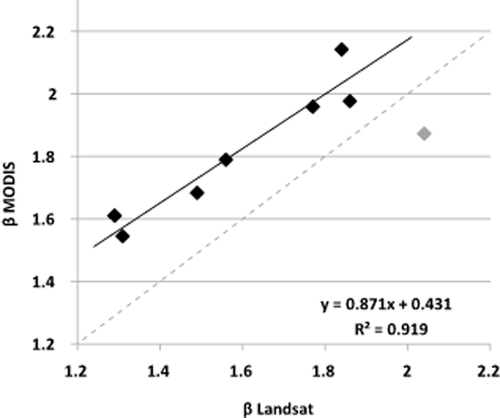
Values of β from the power-law function as estimated from Landsat and MODIS data for the eight study sites. The outlier (grey) corresponds to the study site of South Africa, having much larger uncertainty in the estimate from the Landsat data (upper and lower bounds 1.58–2.20, similar to the complete range of β in the validation sites).
Spatial trends in β
We produced a global map of β (Fig. 2), with low β-values indicating distributions with a higher frequency of large fires. Clear spatial variations can be observed, with sometimes rather sharp transitions between different regions. Some clear spatial patterns that coincide with some of the global biomes arise: low β-values are observed in boreal areas and areas with little vegetation cover (e.g. southern Africa, Australia), and the highest values are mainly observed in tropical savanna and woodland areas and temperate agricultural areas.
Global drivers of β
All the explanatory variables were correlated with β, with high R2 values for human factors such as cropland cover and population density, but also for variables related to climate and vegetation type, such as precipitation and pasture cover (Table 2).
| R2 | AIC | Model | |
|---|---|---|---|
| cropland | 0.35* | 1607.2 | + |
| log10(pop_dens) | 0.31* | 1723.7 | + |
| precipitation | 0.22* | 2031.6 | + |
| pasture | 0.21* | 2069.9 | |
| NPP | 0.12* | 2320.8 | |
| AET:PET | 0.11* | 2356.8 | + |
| tree | 0.08* | 2443.3 | |
| log10(net income) | 0.06* | 2491.8 |
- *P < 10−5.
The full GAM model explains 53% of the variance in β (Table 3), with only four variables included (Table 2). Of these four variables, two are related to human impacts on the environment (cropland and population density) and two are climatic factors that also have a strong impact on vegetation productivity (precipitation and AET:PET). The other variables did not increase the explanatory power of the model, mainly because some of the variables are strongly correlated (S2). There is, for example, a strong linear relationship between NPP and each of precipitation and AET:PET. Human factors explain a larger part of the variance than the ‘natural’ productivity variables; when constructing a GAM with only the human or productivity variables, the model still explains a considerable part of the variance (Table 3).
| Model | Variables included | R2 | AIC |
|---|---|---|---|
| Full model | Cropland, pop_dens, precipitation, AET:PET | 0.53 | −5948.1 |
| Productivity model | Precipitation, AET:PET | 0.31 | −5028.1 |
| Human model | Cropland, pop_dens | 0.40 | −5365.2 |
There are clear trends in the response of β to the estimated partial effects of the four variables resulting from the full model GAM (Fig. 4). There was a positive, almost linear relationship between cropland cover and precipitation, which levelled off at high precipitation values. For population density, the relationship is hump-shaped, with low values both for very high and for very low population densities, and a peak at intermediate densities. AET:PET showed a similarly humped shape, with an increase towards middle values and a decrease to either side.
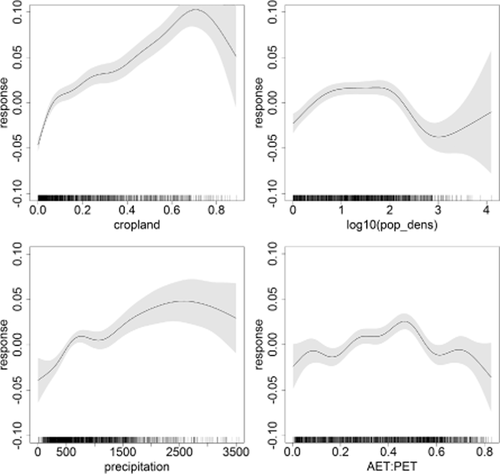
Generalized additive model (GAM) results for the complete model explaining β with proportion of cropland cover (cropland), logarithm of population density [log10(pop_dens)], total annual precipitation (precipitation, mm) and the ratio between actual and potential evapotranspiration (AET:PET). The grey areas indicate the 95% confidence bands, with black stripes in the x-axis marking data availability. For precipitation, the upper two data points are not shown for clarity.
Discussion
Fire size data and power-law fitting
We produced a first global map of fire size distribution, as estimated by the exponent β of the power law. We managed to describe the fire size distribution with a power law for 93% of the grid cells with appreciable fire occurrence. The proportion of sites where this was not possible (7%) is very close to the proportion of false negatives to be expected if the power law held everywhere (5%, at a 0.05 significance level). Furthermore, most of these sites displayed few fires, making the fit of the power law increasingly difficult. It must also be noted that we only used fires with an area of at least 125 ha. This means that we omitted the much more abundant small fires. These factors, together with the relatively large errors inherent in each burned-area product (Roy & Boschetti, 2009), partly explain why the estimated β-values are rather noisy.
One of the most difficult aspects was the estimation of the individual fire size, following Archibald & Roy (2009). We decreased the temporal resolution from 8 to 14 days, which largely solved the problem of fragmentation of individual fires. This mainly occurred in areas that often experience persistent cloud cover, causing problems for the BA algorithm (Roy et al., 2008). On the other hand, this could also result in an artificial increase in large fires for areas with a high burned fraction, which increases the chance that neighbouring burn scars touch and are counted as one. We did find a relationship between burned area and β, but it was the inverse of that expected if our fire-size estimates were strongly influenced by the available burned-area fraction (Appendix S3). Most importantly, this decision increased the spatial stability when estimating β (Fig. 3), increased r2 and slope for the validation results presented in Fig. 2.
At least in some cases, the fire size distribution is better described by a log-normal distribution than a power law (Corral et al., 2008). It is, however, hard to obtain stable estimates for the two parameters of the log-normal distribution from noisy, coarse-resolution data over just the upper range of fire sizes. We therefore continued to use the power-law, which should not be problematic because we only use the upper range of fire sizes for our analysis, and small ranges in a log-normal distribution can be described by a power law (Pueyo, 2006). The log-normal shape results in an increase in β when the minimum fire size increases, which is in line with the bias found during the validation of the β estimated from MODIS with Landsat-derived fire sizes (Fig. 3).
Fire regime
The characterization of the occurrence and characteristics of fire has traditionally been performed using the ‘fire regime’ concept. In practice, this has mainly focused on the burned fraction, seasonality, inter-annual variability, maximum fire size and intensity (Chuvieco et al., 2008; Archibald et al., 2013). Here, we have used the fire size distribution as the expression of the general functioning of fire within the system. We observed clear spatial patterns associated with certain biomes, with the boreal and some tropical regions well defined. Within some of these regions, clear trends can be observed, which is not surprising when the relationship of β to the different explanatory variables is taken into account (see below). We therefore consider the fire size distribution to be an important feature to consider when studying fire occurrence and its characteristics, giving additional information on the vegetation–fire feedbacks.
Spatial trends in β
Clear spatial trends were observed in the fire size distribution over the globe. The results of the GAM analysis point towards a dual effect of human factors and climate, the former being the more important. This indicates the strong impact human activities have on global fire occurrence and characteristics, in line with previous findings (Le Page et al., 2010; Bowman et al., 2011; Archibald et al., 2013). There is an almost linear increase in β with increasing agricultural cover, which is not surprising, because agricultural fires are known to be small, generally limited by the boundaries of the field. Furthermore, these fields fragment the landscape, indirectly limiting the sizes of natural fires in those areas. This effect of landscape fragmentation is also in line with the observed hump-shaped trend for population density, with low β-values for both low and high population densities, and high values for intermediate population densities. The effect of the population density on fire growth is more indirect, by changing land use and land cover, but also through active ignition and suppression of fires. For very low population densities, human fire ignitions are uncommon and the landscape is fairly undisturbed. This seems to indicate that, due to landscape fragmentation, and possibly an increased number of ignitions, β increases with increasing population density towards a maximum. This is in line with the results of Malamud et al. (2005), who found that human-caused fires had a higher β than lightning-caused fires in the United States. The decrease in β for high population densities is more difficult to explain. It is tempting to attribute it to features often found in high-income industrialized countries with a high urban population: large grain size (large continuous agricultural areas alternating with large wilderness areas; Loepfe et al., 2010) and intensive fire suppression, which might cause an increase in the proportion of large fires as a side-effect (Minnich, 1983).
Marked effects were also observed for the ‘natural’ factors precipitation and AET:PET. For AET:PET, a clear humped shape is observed, with low β-values for high and low AET:PET and highest β at middling values of AET:PET. Low precipitation and AET:PET are indicative of dry conditions in which fire propagates easily if enough fuel is available. Arid shrublands, which have low precipitation and low AET:PET, display low β (e.g. southern Africa & Australia; Fig. 4), but very low values of β are also evident in boreal forests which, like arid shrublands, have low precipitation, but can have high AET:PET in some cases, resulting from their low PET. These forests probably cause the decrease in β at high values of AET:PET. Similarly to arid shrublands, a large fraction of the organic matter produced by boreal forests is recirculated by means of fire, but in boreal forests this is because the cold conditions slow decomposition down. Our results, therefore, suggest that low β-values are found in cases where fire is central to the dynamics of the system. This interpretation is also supported by the observed negative relationship between β and the mean fire radiative power (FRP) estimated by MODIS Terra and Aqua (MOD14CMH; Giglio, 2010) (Appendix S3).
Relationship to self-organized criticality
Self-organized criticality (SOC) is a theory that describes, among others, the feedback between fire and vegetation. The power law is generally considered to be an indicator of SOC and our results could therefore be interpreted as a global validation of SOC. Our results confirm that the global fire size distribution can be described with a simple function for large fires and that β can therefore be used as an indicator of the general functioning of fire in the system. The power law is not enough to validate SOC, however, and SOC does not seem to give a realistic foundation in some cases. In these cases, scale-invariance in fire might result from scale-invariance in its contour conditions, rather than being endogenous, as in SOC (Pueyo et al., 2010). More research is needed to identify the areas where SOC does or does not drive the system. The macroscopic result of both (SOC or not SOC) has much in common, however, both being characterizable by a power law, as our results indicate.
Simple fire models are assumed to produce a single ‘universal’ value of β, which has, however, been assigned several different estimates in the range 1–1.5 (Pruessner, 2012). These values coincide only with the lower end of the range of values we found globally. There is therefore a need to adapt current fire models, as proposed by Henley (1989) and Drossel & Schwabl (1992), by including the effects of climate, fuel heterogeneity and landscape fragmentation. Including these factors in SOC-based fire models will make them closer to reality and better applicable for predictions and management while conserving their strong theoretical basis (e.g. Pueyo, 2007).
With or without SOC, our results present the factors that could drive transitions in the fire size distribution under future changes in social and climate conditions. They could therefore form the basis for the improvement of fire-disturbance representation in coupled carbon–climate models. This is currently problematic (Thonicke et al., 2001, 2010) because of the poor understanding of many aspects of fire ecology.
Conclusions
We show that the global fire size distribution can be characterized by a power law, and present the first global map of fire size distribution. Both human and natural factors determine the global pattern, with the human factors explaining the larger part of the variance. These results indicate the strong human impact on fire's occurrence globally. Furthermore, they indicate the limitations of current SOC models to serve as a policy tool for future predictions and ecosystem management. This stresses the need to adapt these models to include the factors that drive the fire size distribution. Our results identify the main drivers of the global fire size distribution and can therefore increase the predictability of spatial fire characteristics under changing social and climate conditions in the context of global change.
Acknowledgements
Comments from L. Vilar and T. Pugh improved the document considerably. S. Hantson received a FPU grant from the Spanish Ministry of Education.
References
Stijn Hantson holds a PhD from the Department of Geography and Geology, University of Alcalá (Spain). His research interests span various topics of fire ecology, forest ecology and remote sensing.
Salvador Pueyo holds a PhD from the Department of Ecology of the University of Barcelona, and has worked at several research institutions. He applies complex systems theory to a variety of topics of interest for the global environment.
Emilio Chuvieco is Professor of Geography at the University of Alcalá (Spain), and is studying remote sensing of forest fires for the last 25 years, both including fire risk estimation and post-fire assessment (burned area and burn severity).


